Vanguard Real Estate ETFPeople say how do you short the Housing Market Bubble?
I say look at this VG Real Estate ETF.
Head and Shoulders Target hit on the DTF.
I can see a pattern on the WTF and MTF that could play out and cause a massive market crash.
History repeats itself and we have a system that is built on debt and getting worse.
Can you see the patterns on the HTF?
Safe Trading.
Realestate

Chinese Real Estate Large Cap IndexThis is an updated version of my previous "Evergrande + others" chart of Chinese real estate. Instead of including some smaller companies with longer price history, this focuses on large market cap companies. I weighted the prices against each other equally by their 42 day average, and then weighted that by the market cap:
1. Sun Hung Kai Properties (0016) HKD 268.5 billion -2.06% Sun Hung Kai Properties Limited develops and invests in properties for sale and rent in Hong Kong, Mainland China, and internationally. It...See Company Profile HKD
2. China Overseas Land & Investment (0688) HKD 252.28 billion 24.86% China Overseas Land & Investment Limited, an investment holding company, engages in the property development and investment, and treasury...See Company Profile HKD
3. China Resources Land (1109) HKD 245.3 billion 4.88% China Resources Land Limited, an investment holding company, invests, develops, manages, and sells properties in the Peoples Republic of China....See Company Profile HKD
4. China Vanke Co. (2202) HKD 235.54 billion -11.14% China Vanke Co., Ltd., a real-estate company, develops and sells properties in the Peoples Republic of China. The company operates through...See Company Profile HKD
5. CK Asset (1113) HKD 202.95 billion 13.53% CK Asset Holdings Limited operates as a property developer in Hong Kong, the Mainland, Singapore, the United Kingdom, continental Europe,...See Company Profile HKD
6. Longfor (0960) HKD 177.07 billion -20.57% Longfor Group Holdings Limited, an investment holding company, engages in property development, investment, and management businesses in China....See Company Profile HKD
7. Sino Land Co. (0083) HKD 91.07 billion 21.52% Sino Land Company Limited, an investment holding company, invests in, develops, manages, and trades in properties. It operates through six...See Company Profile HKD
8. Country Garden Co. (2007) HKD 80.22 billion -49.28% Country Garden Holdings Company Limited, an investment holding company, invests, develops, and constructs real estae properties primarily in...See Company Profile HKD
9. Greentown China (3900) HKD 40.51 billion 28.98% Greentown China Holdings Limited, an investment holding company, engages in the property development and related business in China. It operates...See Company Profile HKD
10. Yuexiu Property Co. (0123) HKD 29.82 billion 40 .17% Yuexiu Property Company Limited, together with its subsidiaries, develops, sells, and manages properties primarily in Mainland China and Hong...See Company Profile HKD
source: fknol.com
(Unfortunately they no longer sort by market cap by default. To view it you'll have to sign up for fknol's terrible website.)
Here was the logic I used:
'a' = 42 day price average.
'b' = adjust b based on the market cap. if the market cap is larger, c gets smaller, market cap smaller, c larger.
Market....a=42D_AVG.....b=a/Market_Cap_Billions
---------------------------------------------------------------------------------------------
0016.......94.14................0.3506
0688.......21.49................0.08518
1109.......35.14................0.1433
2202.......18.51................0.07858
1113.......51.73................0.2549
0960.......37.36................0.211
0083.......0.3542..............0.003889
2007.......5.662................0.07058
3900.......13.34................0.3293
0123.......0.09548............0.003202
(I had to fill in the table with dots so it would show correctly.)
Now, for each row, take each market and divide by 'b':
'market1'/b1 + 'market2'/b2 + ... :
'0016'/0.3506+'0688'/0.08518+'1109'/0.1433+'2202'/0.07858+'1113'/0.2549+'0960'/0.211+'0083'/0.003889+'2007'/0.07058+'3900'/0.3293+'0123'/0.003202
You can also exclude the second column, skip computing 'b', and instead divide the price by 'a' and you would have a 42 day average price weighted index. Dividing a price by an average would normalize it near 1, weighting each price equally.
Does it make sense? Thanks for taking a look!
Misc. Analysis:
Total valuation, going by the info, is roughly 1623.26 billion HKD , which is ~200 billion USD. This is not an unusually large amount, but the importance of these companies is far beyond their numerical market cap. Chinese citizens and companies purchase properties around the world, so I think this price action goes hand in hand with global real estate, possibly with this index as a leading indicator. A large global surplus of buyers in the last few decades has pushed real estate prices everywhere to unreasonable levels and now there is a deficit of buyers. Any serious bailout will distort prices and at some point it's possible that the price action becomes useless. The CCP owns a piece of every company already so I think this would be the more probable route.
Good luck and don't forget to hedge your bets!

Chinese Real Estate Large Cap Custom Index v2Just a quick update of the last chart I posted, which had a bug. These stocks:
'0123'
'0083'
refer to Malaysian stocks, but these stocks:
'123'
'83'
are the symbols we want.
Here is the updated index for your usage:
'16'/0.3506+'688'/0.08518+'1109'/0.1433+'2202'/0.07858+'1113'/0.2549+'960'/0.211+'83'/0.1272+'2007'/0.07058+'3900'/0.3293+'123'/0.3196
See here for more discussion:
Thanks for taking a look!

This ETF will predict the 2022 recession.Looking at the graph, we can see a very high-quality inverted head and shoulders pattern, because the second top made a way higher top than the first top. To add to that, the volume is decreasing rapidly, meaning we are very near the next bottom. This would be definitive for the ETF, because if this ETF increases in price, than the house prices would drop. This would cause a chain reaction, leading to a recession. That is why, on my last study, I said that the 2022 recession is closer than we think it is. A crisis is imminent, so be ready.
AMEX:DRV

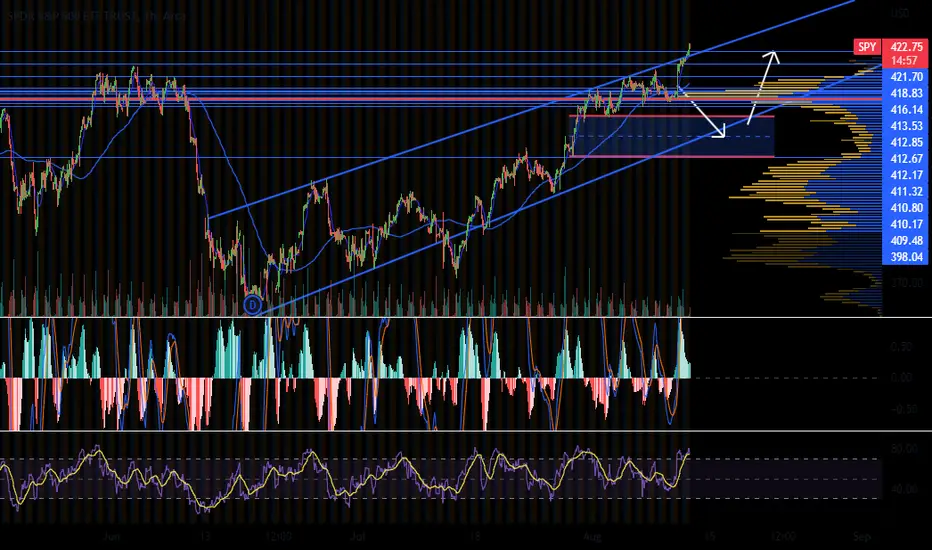
SPY is overextended again Spy is above the channel, I simply don't believe it is BTC time YET. Remember YET. We could be facing a pump then dump then takeoff from 19k BTC. But with all this negative talk about China's entire economy about to fail because of the real estate overbet, there's no way USA stocks don't face that value effect. China and Russia look like idiots. I expect some turmoil. Patience is key.
Inflation Update. Possible first wave?CPI-U is reported at 8.5%.
The alternate CPI-U from 1990 has inflation around 12%.
The alternate CPI-U 1980 has inflation around 16.5%.
This has triggered the markets sentiment that inflation is over to go hog wild on it's Goldilocks targets and head higher on the SPX.
To bring inflation down to the target of the FED now becomes the discussion. The market is seeking the fastest way to get the tightening cycle to stop. Like an addict searching for their next hit the question is how thick will the sugar coating get before the sun rays from the new recession and its implications dissolve the deep snow pack. Boy is it a blizzard coming down.
The two paths from here are #1 does the market whine that inflation is coming down fast enough now so the FED over did it tightening rates and this recession is bad so please print me some dopamine. Or #2 is inflation going to come down fast enough for growth to bottom out and rebound higher so the FED can stop and print me some dopamine to stimulate the bottom of the trend to have the downturn be as short as possible.
Either way the next 6 months will be the market trying to cajole the FED into please print some more money.
The wider trend after that is the classic hyperinflation trend. A small inflation wave that wakes up the public to inflation. Followed by a small deflation wave to catch market participants off guard and make money. Followed by an over correction and printing of currency resulting in a bigger second inflation wave. Followed by a second larger deflation wave with further over correction and printing. Finally causing a rollercoaster crash into hyperinflation where inflation jumps from 20% to 700% in a month. This takes years to play out and is by no means guaranteed but definitely a model to keep in mind.
If such a rollercoaster crash plays out hard assets are the name of the long game while volatile assets are the name of the short game. Real estate, and gold, with Bitcoin and ETH as insurance purchased at the bottom of deflation waves just as the FED pivots. Short term moves into and out of energy and food commodities for 3-6 month positions during inflation waves depending on market information.
Stay safe out there. See you on the moon.

Chinese Real Estate -8% TodayJust FYI, an equally price-weighted basket of large Chinese real estate companies is down 8% today. Rumor is going around lots of companies in this sector are not paying interest payments and are on the verge of default. Maybe it could spill over into global markets? Dare I say it could be an outbreak in the market flu?
These companies are much larger than Enron. Evergrande (HKEX:3333) by itself has 120,000 employees, about 6 times as many as Enron had. Maybe something to think about.
Here is the symbol if you want to view it yourself:
'1918'/2.912+'0960'/2.862+'2202'/2.623+'2777'/1.112+'3333'/1.527+'2007'
I hope this was somehow useful. Good luck and don't forget to hedge your bets!

housing slow down incoming? BEARISH DEATH SOMBRERO DETECTEDsombrero pattern detected (yes i know, sarcasm)
XHB XLRE WMT IYR DIA VT XLY

Zillow Market ManipulationA look at the Zillow market share. Here we compare Redfin, Zillow, and Berkshire Hathaway to understand the relative market share of some of the largest real estate companies in the US. Just for information, no predictions :)

Timing The Housing Market, Patterns Always (Win / Win Strategy)For over 2 years we've heavily referenced the NAIL ETF ( Provided by Direxion ) to get a better sense of the overall housing market. As a measure of context, our experience / trading background included heavy exposure in supporting MBS (Mortgage Backed Securities) and ABS (Asset Backed Securities) reference data providers. This is in no-way investment advice.
Needless to say, that with the right view, this particular security has been a pretty strong indicator on how the general housing and construction market will perform both in the short and long term.
One question that we are constantly asked, is whether the support price has already been reached. Well, historically speaking the support price hovers around US$20 and then bounces to over US$95. As part of our general methodology, we focus on generating a high volume of trades with automation, this allows for compounded returns (huge fan of pyramiding). So, buying at the support price, could well be one long-term strategy once the price reaches the US$20 support (if one can manage the stress associated with short-term risk), should the price drop even further one could increase the position to average down for a more preferable price.
On the other hand, we recommend that traders consider using two timeframes of reference for a guide on support and resistance levels. As an example, one could look at the long-term trend with 2–4-hour candlesticks across a large volume of ticks and then move to a shorter time-frame (such as the 15-minute candles) once a direction is established, to focus on directionally advantageous positions (either bullish or bearish outlook). This allows a swing-trader to remain in a position during times of volatility with a strong resolve based on back-tests that the future outcome will have some predictability.
The reason for this post is that we find that many "newly minted" retail swing-traders are focused on the short-term gain and tend to have stop-losses triggered fairly quickly. If one where to consider the approach above, a more loosely defined (%) stop-limit would allow for improved returns contingent on one using the long-term outlook as a guide.
Final Thoughts
Regardless of your strategy, we recommend one always trades with stop-limits and profit targets (this can be established with the tradingview strategy-tester), and more importantly focus on consistency. There is no such thing as a silver bullet, but historical trends on etfs certainly do help with timing.

$REK Volume & Upside Potential As the economic outlook degrades in the face of persistent and widespread inflation and GDP projection revision for Q1 was worse than expected, real estate will take a hit. Currently seeing record prices while the beginning of rate hikes and slowing sales appears.
A short opportunity exists and is currently reflected in a massive volume uptick in anticipation of a significant market correction appears imminent in the Dow Jones Real Estate Index.
Near-term ~20% to 25% price target with a substantive longer-term potential quite a bit higher if the macroenvironment doesn't turn around and the economic headwinds don't soften.
This is an inverse short play, so market retraction provides impetus to long $REK.

SIXRE $SIXRE Real Estate Initial ShortSIXRE $SIXRE Real Estate Initial Short. TP and SL on chart. Move SL on TP. After TP2, trail with 0.5ATR step and 1.5ATR offset.
$XHB ~ Correction still in progress...Just as the real estate sector, expect homebuilders continue to correct the same. Nice pull back for a wave 2 will present a amazing opportunity as we move forward in the decade. Inventory is very low which is good since rates are moving higher.

$XLRE ~ Expect correction to continue on the downside...As shown, real estate sector is in correction mode. Housing prices are at crazy prices and now 30 year mortgage rates are still climbing. Today the average was reported over 6.25%. Would expect these rates to continue on the upside while housing prices moderate.

ECONOMIC HURRICANE - Real estate 3X ETFInfamous Jaime Dimon economic hurricane for the real estate market. Inflation, recession, stagflation. You name it, houses are unaffordable for the average American.

Real Estate Assets Could Fall 30% or more - are you preparedThe excesses of the past 8+ years have driven RE prices to very high levels. Simple price channels and Standard Deviation channels suggest the unwinding of this bubble may see Real Estate price levels collapse -25% to -30% or more over the next 12+ months.
The US Fed, in an effort to combat inflation, will likely raise rates again - pushing sellers even further into an effort to DUMP assets before buyers are able to react to the shifting market climate.
My interpretation of what is happening is consumers are pulling away from making big purchases as global assets bubbles are unwinding. The US asset bubbles have just started this process - unlike China and other areas. I see the Fed bursting another RE bubble and sending price levels far lower.
Get ready, the fun is just starting (again).

Monthly Bearish Divergence Breaking Demand LineWe have a Potential Double Top inside of a Rising Wedge Pattern on the Monthly with Bearish Divergence and very little support below us.

HOUSING BUBBLE 2022 THE NEXT BIG SHORT?With rates set to rise 50 bps for the next 3 fed meetings, mortage rates will explode and so will home prices. Will Invitation Homes feel the pressure?

Silver versus Real EstatePotential relationship between real estate (using VNQ etf as a proxy) and silver. I drew this several months ago and so far the arc and channel have held. I've heard of the 18 year RE cycle but wonder if that's only valid during a prolonged bull market. I expect at least a 10 year bear market in the SPX to begin in the next few years after a final top is made. Will that 18 year cycle get affected as well?
In 1980 one could buy a median sized home for approx 1272 ounces. Then in 2011 it took 4647 ounces. How many ounces will one need at the next cycle high for silver expected this decade vs home price?
Ref:
www.silvercoins.com

MANA Chart AnalysisIts looking lovely for that exponential growth. Lots of coins going up in this format

AvH (ACKB.br) bullish scenario:The technical figure Triangle can be found in the Belgium company Ackermans & van Haaren (ACKB.br) at daily chart. Ackermans & van Haaren (often abbreviated as AvH) is a diversified group operating in four core sectors: Marine Engineering & Contracting (DEME, one of the largest dredging companies in the world - CFE, a construction group with headquarters in Belgium), Private Banking (Delen Private Bank, one of the largest independent private asset managers in Belgium, and asset manager JM Finn in the UK - Bank J. Van Breda & C°, niche bank for entrepreneurs and the liberal professions in Belgium), real estate and senior care (Leasinvest Real Estate, a listed real estate company - Extensa, a major land and real estate developer with a focus on Belgium and Luxembourg) and energy and resources (SIPEF, an agroindustrial group in tropical agriculture). The Triangle has broken through the resistance line on 30/04/2022, if the price holds above this level you can have a possible bullish price movement with a forecast for the next 23 days towards 174.70 EUR. Your stop loss order according to experts should be placed at 163.40 EUR if you decide to enter this position.
Ackermans & van Haaren realised a record result of 407 million euros over the full year 2021.
Excellent results of the companies across the whole AvH group support this impressive result, which also surpasses that of pre-COVID year 2019 (despite the substantial capital gains realised in that year).
A substantial increase (+17%) of the dividend to 2.75 euros per share is proposed to the general meeting of shareholders.
Risk Disclosure: Trading Foreign Exchange (Forex) and Contracts of Difference (CFD's) carries a high level of risk. By registering and signing up, any client affirms their understanding of their own personal accountability for all transactions performed within their account and recognizes the risks associated with trading on such markets and on such sites. Furthermore, one understands that the company carries zero influence over transactions, markets, and trading signals, therefore, cannot be held liable nor guarantee any profits or losses.

$X : Is Steel Ready For a Fall or Breakup?It appears Steel has reached an area of overhead resistance and at a quick glance one may assume it's ready for a break after temporary sector distortions due to covid and supply issues that plagued many sectors. We also know there are pressures from "cost inflation" as well that plague mines, as well as builders but it seems too early to tell if price will turn around and head down, fairly, quickly, or will these pressures in supply force prices upward.
It's also been suggested there is enough supply overhead despite, "sheet mills in North America relying heavily on the low phosphorus pig iron from Ukraine and Russia", according to industry publication the Steel Market Update. Russia and Ukraine’s pig iron supplies account for 60% of US imports.
Prices for steel have been falling since the fourth quarter of last year as supply exceeded demand, according to Axel Eggert from the European Steel Association. If supply exceeds demand, it's a no-brainer, however, there's this below:
“Ongoing supply chain disruptions, skyrocketing energy and carbon prices, as well as persisting inflation are putting the recovery of the steel sector at risk. Combined with the current EU climate and energy policies, these are the ingredients of a dangerous cocktail that may drive Europe into a structural crisis and industry out of Europe."
There's a push and pull of we have enough vs we won't have enough because of a, b and c. It's too early to tell. Need to just watch price as that will be the canary in the coal mine. :)

Realty Income $O Looking ready to go.Weekly chart with a large downtrend getting ready to break out on $O. MACD has crossed and all VWAPs and EMA cloud are supporting price. Only a matter of time. in my opinion
