How many bag holders will BTC leave behind?We've had our fun and some fake pumping from the short squeeze. No comes the real stuff! What are the fundamentals and what problem is BTC trying to solve? Ok, crickets. It's a speculative asset, that's it. If history repeats itself, which it typically does, we will see a major pull back and anyone who's bought at the top will have a negative performing portfolio. It's too expensive and you still can't buy a banana with BTC and there are plenty of middlemen involved, which goes 100% against it's original purpose (after the financial crisis).
If you're up, this would be a good time to sell IMHO and buy at the next support level, which is way below 100k.
Recession

BITCOIN 2025 - THE LAST HOPECRYPTOCAP:BTC currently finds itself at the intersection of geopolitical tensions and broader macroeconomic uncertainty. Although traditionally viewed as a hedge against systemic risk, it is presently exhibiting characteristics more aligned with high-risk assets. The FED's forthcoming policy decisions will likely play a pivotal role in determining whether Bitcoin stabilizes or experiences further downward pressure.
The chart represents the most optimistic scenario for Bitcoin to date

US Unemployment Rising: How Is This NOT a Recession?The U.S. unemployment numbers are steadily climbing, as indicated by recent Bureau of Labor Statistics data. Typically, significant rises in unemployment correlate directly with recessions, which are shaded gray in historical data charts.
Currently, unemployment has reached over 7 million, significantly higher than recent lows. Historically, every similar increase has coincided with or preceded an official recession declaration. Yet, mainstream economic narratives have avoided labeling this a recession.
What does this data tell us, and is the market accurately pricing in the risk? Are we already in a recession, or is this time different?
Share your thoughts below. Let's discuss the disconnect between the unemployment reality and official recession narratives.

SHORT $RCL | Recession UnderwayRoyal Caribbean bailout cash drying up.
This chart is a good indication of current economic weakness.
I am looking for NYSE:RCL to drop 60% - 80% from the all time high.
I will continue to monitor and provide updates.
God bless!

DXY 1W Forecast until the end of MAY 2025Up-trend will resume and last until the end of February 2025 topping no higher than 114. Current bottom is in at 105.9
Hence, it shouldn't fall below.
After February a consolidation period of 1,5 months will trap price action between the bottom of 122.16 and upper level of 114.9
The spring squeezed during consolidation will provide enough energy for further upwards movement starting in the end of April 2025. This will ignite a chain of devaluation of national currencies followed by epidemic inflation across the globe. This will finish/cool-down at DXY reaching the mark of 148.
New reality after May 2025?

US10 YR Yield Weekly Chart Analysis: NFAUS10 YR Yield Weekly Chart Analysis: NFA
-After sweeping the previous swing high we retraced back to 50% Fib(Equilibrium)
-Expecting this Week's candle wick to sweep Sellside Liquidity-1 and bounce
-If we bounce from here, iFVG-W (red rectangle) will be our resistance zone
-Rejection from that level can send it back to sellside and our next target will be BISI-W(green rectangle)
If any of these Support/Resistance levels are invalidated i will update the idea next week.
**Major economic events can cause drastic moves and invalidate these levels**

Recession indicator #2 Just realized that measuring the spread between TVC:US02Y and FRED:FEDFUNDS gives you a pretty accurate heads up of looming recessions. We might be in one from a few months now.

MARKETS NOT OVERSOLD CAUTION! UPDATE!This is a monthly chart and TV keeps forcing "Target reached" on my updates. As such i am reposting this chart I first issued back on April 1st, 2025, before our "LIBERATION DAY" FACEPALM!
We are still not oversold on a monthly chart!
WARNING!
Click Boost, follow, subscribe!

USOIL CAUTION! BREAK - TEST - GO!This is my new updated chart of Oil.
Trump's "Drill baby Drill" interfering with the free market is the absolute worst thing he could do. His ridiculous tariffs will put us in an economic depression!
Oil prices are driven by demand! As I have mentioned here on TV so many times before! Increasing supply while heading into a recession is the dumbest thing possible! You never want to consume your own oil when you can consume others first! Simultaneously, F your own nation's oil company's profit margins and gov tax revenue!
This is why we shouldn't put toddlers as POTUS!
Anyway!!! This is a break test go! setup!
If you haven't seen it before, here is an example I recently posted with AAPL.
Click Boost, follow, subscribe! Let's get to 5,000 followers so I can help them navigate these crazy markets too. ))

MAGS SUPER STRUCTURE FORMING CAUTION!We have MEGA superstructures forming everywhere. H&S Eiffel Towers, etc.. None will be more devastating to 401ks and people's portfolios than the MAGS breaking down from this mammoth structure.
Last chance to GTFO forming.
CAUTION is in order!
Click Boost, Follow, Subscribe. Let's get to 5,000 followers ))

Could The Stock Market Crash? - WARNING 🚨MartyBoots here , I have been trading for 17 years and sharing my thoughts on SPX .🚨
🚨 SP:SPX Could It Crash?🚨
Lets look into it deeper, very interesting chart but also a dangerous one. Need to see buyers soon or this is could be worse than people expect. 5-10% drop minimum and extreme bear could drop 40% total🚨
Watch video for more details

US500 - Will the stock market go up?!The index is located between the EMA200 and EMA50 on the four-hour timeframe and is trading in its descending channel. If the index moves down towards the specified demand zone, we can look for the next Nasdaq buying positions with an appropriate risk-reward ratio. The channel breakdown and the index entering the supply zone will provide us with its next selling position.
The chief economist at Citigroup has stated that the imposition of tariffs in the United States constitutes a stagflationary shock to the economy. According to his estimates, there is a 40% to 45% chance of a recession. It is expected that GDP will increase in the second quarter, as consumers rush to make purchases ahead of the new tariffs. However, the most significant negative impact on U.S. economic growth is projected to unfold in the second half of the year.
You may have noticed that recent economic statistics are no longer moving markets. The reason is simple: markets are forward-looking and trade on expectations rather than past data. Economic figures reflect what has already occurred, while market pricing focuses on what lies ahead.
At this stage, current data has yet to fully reflect the impact of tariffs and trade tensions. Even if weaker numbers emerge, markets may have already priced in the potential resolution of the trade war and an eventual recovery.
Experienced traders understand that today’s developments are already factored into prices. What matters now is the outlook for the coming months—the real driver of market direction.
Ryan Petersen of Flexport noted yesterday that, three weeks after the U.S.imposed heavy tariffs on Chinese imports, bookings for ocean freight containers have dropped more than 60% industry-wide. He explained that the U.S. imports around $600 billion worth of goods annually from China, with those items valued at approximately $2 trillion at the retail level.
He stated that the first ships carrying goods fully subject to the new tariffs arrived on Monday, and shipping volumes are expected to decline in the coming weeks. However, due to high inventory levels, the impact on the retail sector may be delayed.
Petersen also expressed concern that a potential rollback of tariffs could introduce a new set of challenges. With ships currently being repositioned globally, a sudden wave of new orders could disrupt logistics networks—especially if markets perceive the suspension of tariffs as only temporary.
In my view, no one really knows how this situation will evolve, as a large portion of imports consists of intermediate goods and components used in final products. My guess is that this could lead to a surge in transshipment and even smuggling, though it could just as easily echo the unexpected consequences seen during the COVID era. We are truly venturing into uncharted territory.
Petersen concludes: “This is a strange era for global logistics, as we must simultaneously prepare for the unimaginable—like full U.S. self-sufficiency—while also planning for a return to something closer to normal trade relations.”

BTC reach his topElliot wave count + Fibonacci time line shows btc gonna enter to a bear market soon

AAPL About to CRACK!Without Question, AAPL is the best company in the world and the most valuable. However, it means little in this economic landscape.
AAPL is about to start cracking here. I usually do not post them ahead like this, but in this situation, I will break my own rules.
Take your money and RUN!!!
WARNING!! GTFO!

WILL THE S&P 500 COME CRASHING DOWN? TRIPLE RSI DIVERGENCE?!S&P 500 (SPX) Is considered to be one of the primary benchmarks for the U.S economy. Recently it appears to be showing a triple bearish RSI divergence, DMI indicating bearish with ADX above 20, and a bearish MACD on the 1 Month chart. The technical analysis seems to have a highly bearish hypothesis in my opinion. If we give some thought to Ray Dalio's Principles for Dealing with the Changing World Order , some haunting indicators appear to be forming. Could this just be a minor correction? Or is this the beginning of an extended economic downturn?
Disclaimer: Not financial advice.

SPY CRACK! WARNING!We are in the "honey" phase in Stocks.
This is the part where they tell you:
-Don't panic
-Stocks are cheap forward EPS
-Nible on the way down
-Diversified portfolio wins..
-It's a stock picker's market
-There is a lot of cash on the sidelines
-It's just a reset
-It's a correction
-We needed this to shake out the weak hands
-Buy when there is blood in the streets, even if it's yours
-There is a lot of value in...
-This is your last chance to...
-This and that stock are going to $1,000
-Stocks are the best investment over the course of time
The list is endless to get you to buy or stay in and suck up the pain. They will "Future Fuke" you the world.
I will remind you that you cannot buy unless you first sell! No one has endless money, and your 1% addition monthly will not lower your cost basis.
All I can tell you is what this chart shows! A BIG CRACK!
WARNING!!!
Click like, follow, subscribe, and let me help you navigate these crazy markets.

Will Copper Equities Catch up Before a Slowdown?Copper equities are lagging the metal and wit recession looming will they have time to be milked

OPEC Cuts Oil Demand Forecast While Increasing SupplyOil prices are feeling bearish pressure. OPEC was unable to increase production significantly last year to stabilize prices. High interest rates have kept global economies cool enough. However, starting in May, OPEC will begin unwinding its voluntary production cuts. The timing of this decision is questionable. Tariffs are expected to hit global economies hard, while the Fed is likely to hold rates steady for a few more months. Recession risks in the world’s two largest economies, the U.S. and China are rising.
OPEC has acknowledged this trend by lowering its oil demand forecast for 2025 and 2026 by nearly 10%.
If summarized:
Oil demand is expected to fall 10%, possibly more if the U.S. and/or China enter recession.
Trump is expected to boost U.S. drilling, increasing supply.
OPEC will start to unwind supply cuts, increasing supply.
Brent is likely to remain under bearish pressure throughout the year because of rising supply and falling demand. As long as the current fundamental outlook remains unchanged, upward moves should be viewed as selling opportunities. A downtrend channel has formed since mid-2023, with the lower boundary recently tested. There is now an upward reaction. If this continues toward the 68.25–70.70 zone—previously a demand zone, now a potential supply zone—traders may look for short entry setups, provided this zone holds, with nearby stop-loss levels.

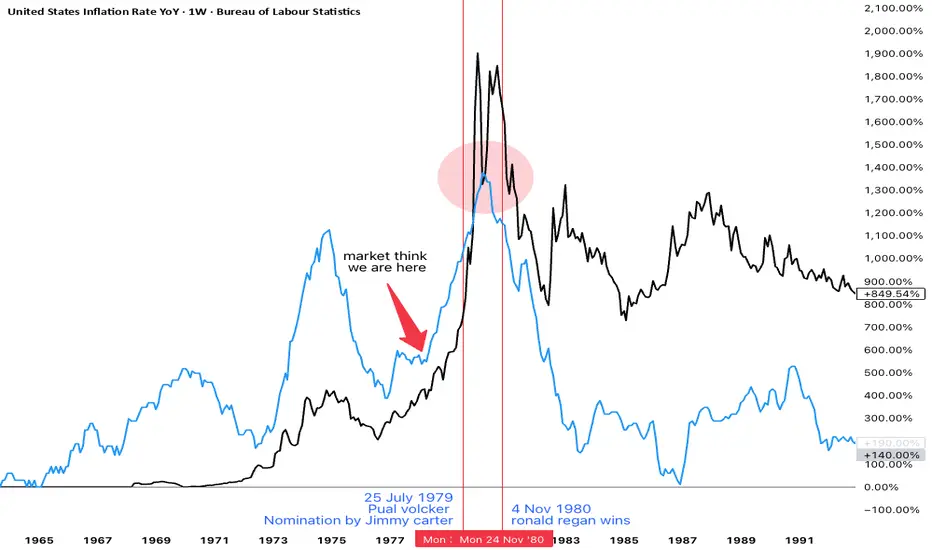
gold and inflation in 1970s stagflation fomc member repeatedly saying this is not stagflation like 1970s
but gold bug on social media constantly pump stagflation narrative after gold historic run from $2000 to $3000 in just one year
with usa cpi and gold chart in one image you can get idea
how gold moved in last stagflation crisis with big political news : when paul volcker comes into fed and when Ronald Reagan wins election
gold first makes double top before multi year bear market
inflation peaked after volcker get fed control but before election result.
is this is really replay of 1970s ?
we got same old president trump and same old fed chair powell
✅ biden forced fed to do big size 50bps cut pre election to choose inflation over higher unemployment which is stagflation
✅ in his first term trump in election year March 2020 use covid as excuse to cut 0% and do QE and trillion dollar fiscal policy stimulus check. choosing inflation over high employment which is stagflation but it was biden who has to face most of the inflation spike to 9%
✅trump raise tariff to 100 years high to choose high employment over inflation which is recession
✅ in next 4 years it will be clear is this replay of 70s or not.
in future we will have more inflation and gold price data to confirm
"When the VIX is low, look out below!""When the VIX is low, look out below!"
+
FEDs motto "Higher for longer"
=
Fed rate hikes to go: 2-3 left
it is pivot time, change of market dynamic from "bad news is good news" to "bad news is bad news".
state of economy is not good and it will start sinking in to investors and public

End of the US Dollar ****** end of INFLATED USD
Deflation is coming.
Food for thought.
Because THE CYCLES EXIST and THEY RHYME.

Merck & Co. (NYSE: $MRK) Sets Up Q125 Earnings Call for April 24Merck & Co. (NYSE: NYSE:MRK ) will hold its Q1 2025 earnings call on April 24 at 9:00 a.m. ET. Company executives will present financial results and performance updates during the call.
As of April 4th, 2025, MRK closed at $81.47, down $4.92 (5.70%). The stock has declined steadily since peaking at $134 in June 2024.
In Q4 2024, Merck posted global sales of $15.6 billion, a 7% increase from the previous year. Sales growth stood at 9% when excluding foreign exchange effects. Full-year 2024 revenue reached $64.2 billion, a 7% increase over 2023. Human health sales grew 8%, driven mainly by oncology treatments.
KEYTRUDA remained the company’s top product with sales of $7.8 billion in Q4, rising 21%. WINREVAIR generated $200 million in sales, while new vaccine CAPVAXIVE added $50 million. The Animal Health division showed strong momentum, growing 13% year-over-year. Merck’s global reach extended to nearly 500 million people in 2024.
However, GARDASIL vaccine sales dropped 18% in Q4 due to lower demand in China. This led Merck to pause GARDASIL shipments to the region temporarily. Operating expenses for the quarter totaled $7.4 billion. The company reported a gross margin of 80.8%, up by 3.6 percentage points. Earnings per share came in at $1.72.
For 2025, Merck expects revenue between $64.1 billion and $65.6 billion. EPS guidance is set at $8.88 to $9.03, excluding foreign exchange impact. The Medicare Part D redesign could reduce revenue by about $400 million in 2025. This would affect WINREVAIR and other small molecule oncology drugs.
Technical Analysis
MRK stock is currently testing a major support level at $81.A confirmed breakdown at this critical level could push the stock lower. Price momentum and volume suggest a likely continuation of the bearish trend unless support holds. With the bearish pressure in place, the next support level lies at $70.
The weekly chart shows consistent lower highs and lower lows since June 2024. MRK has fallen nearly 65% from its peak of $134.
If the $81 current support holds, a short-term rebound is possible, with an immediate resistance target around $95. Reclaiming this level may signal early signs of a trend reversal. If a strong break at the $81 level is witnessed, the next target remains the $70 support.
The current trend favors sellers. One thing to watch closely is the April 24th, 2025, earnings call as performance updates may provide clarity on near-term price direction.

Crude OIL CRASH - OPEC & Trump - Recession Catalyst#Recession is here, Markets are bleeding.
Crude #Oil is the kicker.
I shorted TVC:USOIL on Friday.
Hunting on this trade for a while now.
Very #Bearish outlook on #WTI.
MARKETSCOM:OIL Weekly
#FundamentalAnalysis
- #OPEC+ Output Hike (411K bpd)
- #Trump #Tariffs & #TradeWar
I'm looking at a #CrudeOIL #MarketCrash, similar to the #Covid era, when NYMEX:CL1! went in minus on #Nymex #Futures.
TVC:USOIL & my BIG SHORT
#Trading EASYMARKETS:OILUSD via CFDs with #Leverage.
Executed my #Sell Position on #WTI at $64.
* DYOR before, it's not a financial advice, I just share.
#TechnicalAnalysis
- #ElliottWave Impulse Cycle a (white)
- #Correction in Primary ABC (red)
- #LeadingDiagonal in Primary A (red)
- #Descending Triangle in Primary B (red)
Why will BLACKBULL:WTI Crash?
#Bearish Primary C (red) has started.
#Break-out below the Triangle Flat Line.
Important Note:
The #Bearish #Impulse will continue lower.
After the short-lived pull-back, Sellers will dominate.
$63-64 Range is the Entry.
MARKETSCOM:OIL Daily
TVC:USOIL #Short #TradeSignal
- Entry @ $63-64 Range
- SL @ $73
- TP1 @ $40
- TP2 @ $30
- TP3 @ $20
Stay in the green and many pips ahead!
Richard (Wave Jedi)
