Where US30 Is headed to next?Us30 has taken bearish hits since the beginning of this year. If it stays below $33,480 and continues back to the lows at 29,670 and further, we could see further decline.
Not only for US30, but for the stocks within the index. Before that happens price could pullback towards 32,500 giving the buyers some opportunity and hopes of recovery. That's just a thought until it happens.
For now, the Dow is bearish and if there is hopes of true recovery price will have to push up pass 33,480 and continue up from there.
Recession

COMMODITY GOLD PRICES FORECASTA trade idea based on my own.
Interest Rates Forecasted To Be HIKES AGGRESIVELY SINCE (FED) Focused on 'HOT' INFLATION RATE.
STRENGTHENING IN USD (DOLLARS), PINNED DOWN COMMODITY PRICES such GOLD.
P/S (1): Commodity such GOLD can be AFFECTED by another FACTORS such as SUPPLY and etc.
P/S (2): THIS IS NOT AN INVESTMENT ADVICE. PLEASE CONSULT ON YOUR OWN ANALYSIS.

ETHUSD CRASHING BREAKOUT, when to buy.Same thing for bitcoin .. I like around 500 area for a buy as a long term. Again the bear flag formation then a breakout.
Recession & inflation gone worse from the weigh pressure of high rates.
500 area long term to over 7000, even so price will go higher.
We be seeing 6000 but possible to go a lot higher. Same thing if your a day trader hold that sell profit if using MT4&5 .. be sure to take those large and buy with bigger lots.
Coin base..etc wait for the buy around 500.
Please be careful and good luck:) see you at the buy zone.
Buy ETHUSD: around 500 area
Take profit : 7000 or higher

More bitcoin crash from breakout, when To buy. Bear flag created and more drops, my analysis had been created of more drop , more breakouts.
Experts still expecting to down lower down to 10K so the price will pressure up to go higher. Even so the White House warned about the inflation are going highly elevated , inflation and recession are going a lot worse.
This is when to buy ..
10K area anywhere around 10K .. long term buy hold it for 2 years and will go over 100K, massive bull run is coming but we won’t expect the new low around august or September.
6500 is possible but not so sure yet of that low keep an eye only if just in case.
New low for bitcoin is around 10K because base on the charts it has stronger floors and support, if you are day trading like MT4 or MT5 hold that sell keep making those profits.. if you have coin base or binance I highly wait around 10K for the buy long term.
This is all for now trade safe and please be careful for bull traps.
Buy bitcoin: entry anywhere around 10K
Take profit: over 100K

Until 19.7K Recession concerns, this is why to go lowerBitcoin miners shit off the rigs since Texas power grids even so heat wave threatens grid rolling blackouts but there’s more..
The recession had gone worse and pushing the weigh as the inflation stilll marks the risk to go higher, while the red and still pushing the chains to high up the rates of the inflation. As so Wall St, expects bitcoin and all other crypto to crash even worse.. experts still seeing even investors expect low as 10K back to back haven’t bought since September 2020.
We all be expecting lower price as recession and inflation went higher rates, as for pandemic.. we aren’t in pandemic at all but still in a stage of Epidemic .. monkey pox are spreading, new omnicron variant are spreading even faster while BA5 variant are still spreading.
Now you all know and again if you are looking to buy , I would wait until 10K hits.. the more it drops the higher the price gets. 10K strongest bottom support will take us over 100K.
If your day trading please trade safe and use low risk, do not go high risk.

I see nothing good here... There is literally nothing good seeing #Euro and #USD reaching parity.
Clearly, and despite the roughly same volume at each top, the 6-year-double top is no joke. Especially considering the fact that its fueling the violation of a major round-numbered multi-year support right at this moment.
Most probably if not sure, Due to the fact that it takes longer to build than to tear down, #EURUSD will trade between 0.80-0.90 before Dec22 pushing the market into a (deeper) recession and inflation will hit harder this time.

Ugly Markets - Embrace the TrendsThe trend is always our best friend in markets across all asset classes. While many investors and traders waste their time interpreting the new cycle and other factors, the path of least resistance of market prices is a real-time indicator of the current sentiment.
Stocks and bonds fall in Q2
Four of six commodity sectors post losses
Rising interest rates and a strong dollar
Economic contraction- Copper tells a story
Go with the flow
Market prices rise when buyers are more aggressive than sellers and fall when sellers dominate buyers. The current price of any asset is always the correct price because it is the level where buyers and sellers agree on value in a transparent environment, the marketplace.
The results for Q2 were ugly in most markets. Stocks and bonds fell, the dollar index rose, and four of six commodity sectors posted losses. The best performing sectors reflect the supply-side issues created by the war in Ukraine, sanctions on Russia, and Russian retaliation.
Uncertainty in markets creates price variance, and markets reflect the economic and geopolitical landscapes. As we move into the second half of 2022, uncertainty is at the highest level in years. Meanwhile, market liquidity tends to decline during the summer vacation months. Lower participation only exacerbates price variance as bids can disappear during selloffs and offers often evaporate during rallies. It is a time for caution in markets across all asset classes, but the trends on a simple price chart tell us all we need to know about the path of least resistance of prices.
Stocks and bonds fall in Q2
The stock market was ugly in Q2:
The DJIA fell 11.25%
The S&P 500 declined 16.45%
The tech-heavy NASDAQ dropped 22.45%
Over the first half of 2022:
The DJIA was down 15.31%
The S&P 500 fell 20.58%
The NASDAQ plunged 29.51%
As the Fed began increasing the Fed Funds Rate and reducing its swollen balance sheet, the US 30-Year Treasury bond futures fell 8.19% in Q2 and were 13.75% lower over the first half of this year as of June 30. The long bond fell below its technical support level at the October 2018 136-16 low and reached 132-09 in June before bouncing.
Four of six commodity sectors post losses
While the energy and animal protein sectors posted gains in Q2, base and precious metals, grains, and soft commodities moved to the downside. The quarterly results by sector were:
Energy- +6.77%
Animal proteins- +3.31%
Gains- -3.46%
Soft commodities- -4.12%
Precious metals- -12.91%
Base metals- -27.24%
Over the first half of 2022, four of six sectors were higher than at the end of 2021:
Energy- +43.86%
Grains- +14.65%
Animal proteins- +10.96%
Soft commodities- +1.46%
Precious metals - -5.43%
Base metals- -13.07%
The results reflect the economic and political landscapes. Energy and food prices rose as the war in Ukraine threatens the global supply chains. Metal prices declined because central bank policies and economic conditions led to rising rates and a strong US dollar.
Rising interest rates and a strong dollar
The US Federal Reserve blamed rising prices and inflation on “transitory” pandemic-related factors throughout most of 2021. The central bank waited far too long to address inflation and is now playing catch-up when the war in Ukraine and geopolitical tensions impact the global economy’s supply side. Central bank monetary policy can affect the demand-side, but they have few tools to manage supply-side shocks. The rise in energy and food and the decline in metal prices tell us that central banks are struggling to address the current economic landscape.
The US 30-Year Treasury bond futures chart shows the pattern of lower highs and lower lows. While the long bond bounced from the June low, the bearish trend remains intact in early July.
The US dollar index, which measures the US currency against other world reserve foreign exchange instruments, rose 6.21% in Q2 and was 9.28% higher over the first half of 2022. The dollar index settled at the 104.464 level on June 30 and rose to a new two-decade high of 107.615 on July 8. Since the US dollar is the world’s reserve currency and the pricing benchmark for most commodities, a strong dollar caused raw materials to rise in other currencies, putting downward pressure on dollar-based prices.
Economic contraction- Copper tells a story
The US remains the world’s leading economy. In Q1, US GDP fell, and it likely declined in Q2. The textbook definition of a recession is two consecutive quarterly GDP declines.
Copper is a base metal that trades on the London Metals Exchange and the CME’s COMEX division. Copper has a long history of diagnosing the economic climate, earning it the nickname Doctor Copper. In Q1, COMEX and LME copper prices rose by around 6.5%. In Q2, they plunged, with the COMEX futures falling 21.82% and the LME forwards dropping 20.41%. COMEX and LME copper prices were down over 15% over the first half of 2022.
The chart of COMEX copper futures shows the move to an all-time $5.01 per pound high in March 2022 and a decline to a low below $3.40 in early July. The descent below technical support at the August 2021 $3.98 low and nearly 30% drop as of July 8 are signs that recession is not on the horizon; it has already gripped the economy.
Go with the flow
Inflation remains at a four-decade high, and while raw material prices have declined, the economic condition is far higher than the current Fed Funds rate. The central bank has pledged to fight inflation with monetary policy tools. Higher interest rates could put more downward pressure on raw material prices and the stock market as the economy contracts. Time will tell if the Fed continues its hawkish path or reacts to current market conditions. Waiting far too long to address inflation in 2021 suggests the central bank will likely remain hawkish regardless of market conditions in 2022.
It is impossible to pick tops or bottoms in any market as prices often rise or fall far beyond where logic, reason, and rational analysis dictate. A market participant’s most effective tool is to follow the trends until they bend. The path of least resistance of asset prices can be the most significant factor for future performance. In these troubled times, where uncertainty is at the highest level in years, don’t fight the trends and go with the flow. In early Q2, it remains bearish in many markets across all asset classes. Stocks, bonds, commodities, cryptos, and other asset classes are making lower highs and lower lows, while the dollar index is moving in the opposite direction.
Markets are ugly, but nothing lasts forever. Trend following can be the best route for capturing the most significant moves. You will never buy the lows or sell the highs when following trends, as they will cause short positions at bottoms and long positions at market tops. However, trend-following allows for extracting a substantial percentage from a significant price move. Embrace those trends until they change.
--
Trading advice given in this communication, if any, is based on information taken from trades and statistical services and other sources that we believe are reliable. The author does not guarantee that such information is accurate or complete and it should not be relied upon as such. Trading advice reflects the author’s good faith judgment at a specific time and is subject to change without notice. There is no guarantee that the advice the author provides will result in profitable trades. There is risk of loss in all futures and options trading. Any investment involves substantial risks, including, but not limited to, pricing volatility, inadequate liquidity, and the potential complete loss of principal. This article does not in any way constitute an offer or solicitation of an offer to buy or sell any investment, security, or commodity discussed herein, or any security in any jurisdiction in which such an offer would be unlawful under the securities laws of such jurisdiction.

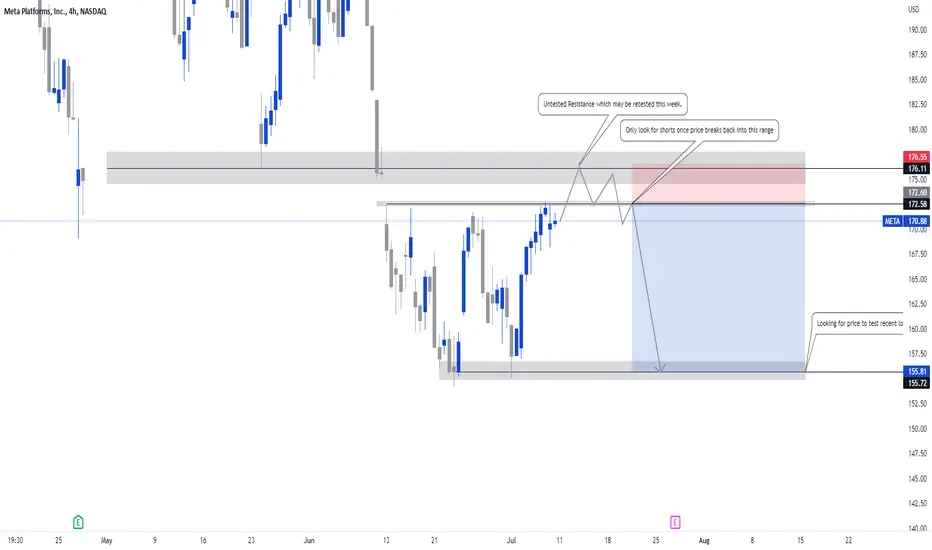
Facebook (Meta) False Breakout SetupHi Traders,
New week new opportunities. I am currently looking at Facebook (Meta) for a False Breakout Setup. The most recent price action shows that price has created a resistance at 172.58 which has multiple attempts to break, I do believe that price will break the current resistance and meet with the real untested resistance at 176.0.
If this does happen I will then start looking at trading opportunities. Now I don’t really care what happens when price breaks the resistance or how the price may move, All I care about is price break back into the range below 172.58. If this does happen I will be more than happy to start looking at shorts.
Looking at higher time frames, This is a simple lower high we need formed for the continuation. I am long term bearish on most Nas100 stocks and I will be looking at the longer term picture or potential shorts to come.
Let smash this week.
Renaldo Philander
US 10-year rate. Elliott wave possibilitiesThe US 10-year yield has pulled back from 3.50% to 2.75%, which is a sizeable drop by any stretch of imagination. The Fed has clearly said its current focus is on price stability and with yesterday's employment numbers, there is still little reason to believe that fears of a so-called slowdown, or even worse - a recession, are showing up in high frequency data that the central bank is using, atleast for now (or they have the data, but because of political pressures, continue to focus on containing inflation).
The vertical drop in commodities has been puzzling no doubt; in fact the descent has been so quick that most people are aligning towards the fact that Fed forward guidance of more hikes (it remains to be seen whether existing measures of tightening policy are having the desired effect) are showing signs of demand destruction. I think for the Fed to acknowledge that a recession is a bigger worry than growth (at a certain point of time in the future), they would like to see a consistently southward CPI print which shows credible signs of not being sticky on the downside. For now, I believe they are simply taking back all that they made available in terms of additional QE to pull the world economy out of the Covid led crash.
Tactically, the visit to 2.75% was fleeting -- that was a key support level, so the market comfortably vaulted past 3% on employment gains that were more than expected. These moves have now resulted in the market dangling at a critical juncture which I will try to address via the three best Elliott wave counts I have conjured up (the right to be wrong is exclusively mine, and so is the right to adapt quickly to what the market might be doing regardless of what I think it should do) given the presently available evidence. All three counts start from the July 2021 lows -- the count from the 2020 crash lows of 0.34% has not been used for the sake of this analysis (which suggests the bull market in yields has much longer and higher to go) but that's a separate discussion altogether.
Primary Count: Long term trend in yields higher and is very much intact, but more sideways churn is expected within a RUNNING TRIANGLE before a surge:
Requirement: 2.75% must hold for this to be valid labelling
Alternate count #1: Long term higher, but one dip below 2.75% is needed to meet the minimum requirements for w((4)) to end
Requirement: One more dip before a larger degree 5th wave targets 3.50% and higher; 2.75% can be broken or at the least, retested
Link:
Alternate count # 2: More aggressive count that suggests higher immediately, longer-term higher yields play
Requirement: 2.75% cannot be broken from here, not even by a tick as per the rules of the wave principle for an impulse
Link:
Conclusion: Regardless of which wave count is in play - we will know that as we have more information appearing from the right of the chart, the impulse up in yields is anything but done. Perhaps, inflation will remain sticky longer than the consensus view is.
-- Guest Contributor at the @CMTAssociation

WTI -5/7/2022-• April-June period prices were contained inside an ascending channel
• After peaking in June, prices broke the channel support and started trading inside a bearish descending trend line
• Long term support trend line holding since Dec 2021 still intact
• As the worldwide economic picture is worsening, outlook is slowly turning negative for the oil's demand
• Bears are targeting trend line support, today at 104
• Below 104, next target is 100 psychological figure

Reviewing Trends and their behavior during RecessionsWhile retiring after some decent gains during this whipsaw day, I thought I'd go over utilizing the Weekly trend indicator, and how that ended up during a recession vs the occasional downtrend signal.
To recap the video if you don't feel like listening, the ONLY time a Weekly Downtrend Signal has occurred, and that index prices were lower when the Weekly Uptrend Signal occurred, is during the recessions. Even during the beginning of Covid, the Weekly Downtrend Signal hit at 2983, but the rapid rise back up and the calculation of trends would have signaled the Weekly Uptrend at 3276.
An overall boost in the economy from here for the rest of the year would make this nothing more than a downturn. That doesn't really add up when looking at the overall state of the economy, at least not from my perspective. Many factors are worse than the last recession (Literally called the "Great Recession" because of how rough it was), and the next few months in terms of inflation falling without unemployment rising above 5% could be real factors to watch.

S&P 500 - RECESSION SCENARIO, 15% DOWN TREND in ONE WEEK!Interval: 4hrs
Description: In this Recession Bear Scenario, we have 15% decline from the current 3889 S&P 500 levels. We could hit 3350 for S&P in one week.

Unemployment is inevitable part 3INVERTED GRAPH>
This isn't a shocker. It's well documented. But what is happening right now is interesting.
When the stock market does better, unemployment falls.
When the stock market does worse, unemployment grows.
Right now, stocks have dropped but unemployment hasn't fallen.
Guess what happens next?
Peak unemployment will be near the end of the recession.
Sorry to say, but that's going to be well into 2023.

WOW RIGHT ONCE AGAINWe have been seeing crazy trading success lately!
SPY and the general etf and index market alone have been showing some struggle all day long. Today just market a huge double top on every time frame under the daily. This is crazy! This is confirmed by an ascending wedge pattern that looks beautiful on the hourly and 30-minute chart. If this isn't a double top, then this is a cup and handle. Half the base to the handle is 8.25 up from the peak putting our estimates at 381.87 a previous support.
GOOD LUCK BYE BYE MARKET>

Recession Indicator New Orders vs Job OpeningsShowing the causation between new orders data and job opening data.
When new orders fall, new jobs fall.
RN, new orders have fallen. New jobs haven't fallen yet.

GDX GOLD MINER may bottom@24 or 21 zone to retest channel.GDX seems to be doing a BIG UPCHANNEL started from the 2016 low & retested at the 2018 low. If this lower channel is to be retested, GDX may bottom at the 24 green zone. This is the most probable since this is also the 2016 VWAP & the FIB 0.618 retracement from 2016 low.
However, if you look at the VOLUME PROFILE, then GDX may fall more to the 21 zone to create a divergence, ending wave 1 of wave III.
BULLISH longterm: Gold & gold miners will be a good hedge during rising inflation or recession. Every portfolio should have this insurance policy & some other defensives like XLV health, XLP staples & XLU utilities. TLT bonds will also rise during recession while US10Y rates go down in a deflationary environment. GDX may be just in the early stages of the longest wave III rally & has a long way to go.
GDXJ Junior miners fell a lot more so I think percentage wise it will have to rise more just like today. Miners tend to be the leading indicator for GOLD. Gold may fall more to the 1670 to 1760 zone. Gold recovering 1800 will be very bullish while GDX reclaiming 30.37 wave 1 top & previous neckline pivot will also be bullish.
Not trading advice.

$SPX breaking downtrendS&P 500 index looks to be finding its footing. It just broke through the 20-day moving average with gusto. The 20-day MA is a good gauge for shorter-term momentum.
This all hangs on being able to hold above the 20-day MA, if so, the next test will be at 3,978, which is approximately right where the downtrend line and the 50-day moving average meet. If it can break through this downtrend line and hold above it while making higher highs, we could be saying bye-bye to this bear market.
Oddly enough this is also right where the gap that is yet to be filled is.
Those of you that don't think stocks can do well during a recession have not read your history books or done your due diligence. I am not in the recession camp though. I am in the "definition for recession is no longer relevant in today's financial world" camp. Yes, based on the old technical textbook definition, 2 negative GDP quarters in a row=recession.
I think we are going to still have the next roaring 20s, I'd put my money on a rally/rage into the end of the year then an economic boom when some of the macro and geopolitical bugaboos get solved with time.
Happy to discuss and answer questions.
Thanks,
Tiger

EURCHF breaks below parity. A further drop expectedThe last time this pair dropped below parity, investors chose the CHF over the Euro. However, the SNB was worried about the deflationary aspects of such a move and acted to reverse the move.
This time, the fundamentals are more or less the same or different depending on how you interpret it.
The Euro zone investors are worried about the block tipping into a recession due to high energy costs. In Germany, for example, regulators have warned that entire industries could come to a halt should Russia fail to reopen the Nordstream 1 pipeline gas flows. The Yamal pipeline has also seen huge drops in gas supplies.
With this in mind for Euro fundamentals, the question remains whether the SNB is going to do anything. A stronger CHF is definitely going to the reduce inflationary pressures for Switzerland.
In my opinion, I expect the pair to head lower toward the Jan '15 bottom.
Risks to trade
Historically, strong moves in one direction tend to reverse with similar momentum.
The EURO - SWISS bond yield spreads show that the downward move may not be sustainable since FX tends to move in lockstep to spreads
The SNB raised rates by a whooping 50bps for the first time in a long time. In typical fashion, Swiss bond yields jumped, some out of negative territory. However, the yields have retraced most of their earlier moves. This may imply that the markets are pricing that the SNB will not raise rates as much in the face of a recession in Europe.
This might reduce the strength of the CHF with weakness showing up in the USDCHF.
PS: I already have an open position ( This is not trading advice)
With that in consideration, I'll be short the Euro for Q3.

Unemployment is inevitable part 2INVERTED GRAPH
Unemployment rates in black.
INVERTED Michigan consumer index in blue.
As consumer sentiment falls, unemployment rises.
Every.
Time.
The consumer index just fell to all-time lows.
Unemployment hasn't risen.
Either we have done something completely unique in the history of the stock market redefining how modern economics work...
Or there's a lot of unemployment coming.

Recession concerns dominate the headlinesEUR/USD 🔼
GBP/USD 🔽
AUD/USD 🔼
USD/CAD 🔼
USD/JPY 🔽
USD/CHF 🔽
XAU 🔽
WTI 🔽
As the dollar remained strong, EUR/USD reached a 20-year low of 1.0160 on Wednesday. Amidst predictions of a local recession and an impending energy crisis, the shared currency is among the weakest.
The GBP/USD exchange rate fluctuates about 1.1930, under pressure as the UK government crisis intensifies. Over thirty officials resigned, and many others begged Boris Johnson to quit. The 1922 Committee, comprised of Conservative backbenchers, sought to alter the rules that shield PM Johnson from the second vote of no confidence.
The FOMC issued the Minutes of its most recent meeting. The memo demonstrated that Federal Reserve officials concurred that rising inflation necessitated restrictive interest rates and are willing to become even more stringent if inflation persists. In addition, most respondents perceived an adverse risk to growth and a "substantial danger" that rising inflation may stay entrenched. The US Federal Reserve opened the door for another 75 basis point rate rise.
Wall Street struggled to register gains throughout the day, but significant indices ended higher. Although the FOMC Minutes' hawkish tone, policymakers refrained from discussing a 100 basis point (bps) rate rise, despite committing to do everything necessary to combat inflation. In addition, policymakers abstained from discussing the recession.
The yield curve for US Treasuries remains inverted. Currently, the 10-year note yields 2.93 percent, while the 2-year note yields 2.97 percent. Typically, an inverted curve is viewed as an early indicator of a recession.
Against the U.S. dollar, commodity-based currencies exhibited minimal movement. The AUD/USD exchange rate is around 0.6780, while the USD/CAD exchange rate is approximately 1.3040.
The USD/CHF exchange rate touched a new monthly high of 0.9743, while the USD/JPY pair finished at 135.85.
Gold reached a new 2022 low of $1,732.19 per troy ounce before the end of the trading day. The current price of a barrel of WTI crude oil is $98.40.
More information on Mitrade website.

Inflation is over now time to deflate It all comes down to Newton’s third law “what goes up must come down”. With the pressure of the federal reserve and the U.S. government doing what they can to hedge inflation. Oil is well on its way to a downtrend the Sp oil and gas exploration index will follow suit. Rising wedge has broken likely next move is down.

Bear Flag on 4H chartThere is a bearish divergence in the 4-hour graph of the # BTCUSD , which could bring the price of bitcoin even lower, to 7K levels. For now, what seems is that we are in a Bull trap, and then fall even more, derived from the global financial crisis, uncertainty and possible economic depression that we are about to reach. All cryptocurrencies could fall at abnormally low prices, even some disappear such as LUNA. You have to be very careful and ready for the worst, and try to win and take advantage of this moment.
This is only a personal opinion, and should not be taken as a financial advice.

SPX - Calculating the odds of a RecessionUnderstanding the possibility and consequences of a recession by determine the strength of U.S Economy using key economic indicators
GDP - In order to sustain the economy consumption must be increased meanwhile, Fed trying to tame inflation by implementing policies that will
going to reduce the demand. Ergo, The GDP is expected to fall by 1.25 next quarter.
UNEMPLOYMENT RATE - Every time a huge trend of layoffs starts 45 days prior to a recession. at this point, No major corporate layoffs have taken
place and currently the unemployment rate is at historically low levels.
INFLATION RATE - High oil prices, Supply Chain disruption, Hyper inflation risks across the globe and most importantly higher interest rates, There
is no doubt that inflation rate will counting rising.
CONSUMER SENTIMENT INDEX - Current level is below 60 which reflects lower consumer confidence which will result in lower consumer spending
DOLLAR's PURCHASING POWER - U.S Dollar getting stronger against other fiat currencies, However it's purchasing power is eroding, High interest
rates have strengthened the U.S dollar and it's expected to continue rising.
10-Year Treasury Constant Maturity Minus 2-Year Treasury Constant Maturity - Short term vs Long term treasury inflows, Whenever yield nears the
zero or becomes negative then recession follows.
Federal Funds Rate - Interest rates are expected to hit 3.75% by the end of this year, There will be several rate hikes in the following months that will result in global economic slowdown.
Geopolitical Risk - Disruption of world order has already begun with Russia's Invasion of Ukraine, Growing risks of China and Taiwan conflicts, Shri Lanka's Crisis, Turkey's Hyperinflation risk and if U.S economy crashes then a new world order is imminent.
Conclusion: Current Health status of U.S economy is bearable However, projection for upcoming quarter is uncertain,
the most optimistic part is low unemployment rates, Financially strong businesses and Strong households
with higher savings rate, in turns following rate hikes cannot be associated with an inevitable recession.
Health care and defense sectors with high dividend yield stocks are greater alternatives to invest in.
