BTC looks serious this time! #BTCUSD Falling wedge is broken! Now, BTC is challenging the red line! Breaking it is a bullish signal, targeting the levels mentioned in our video recently.
Watch it here
tacademy.pro
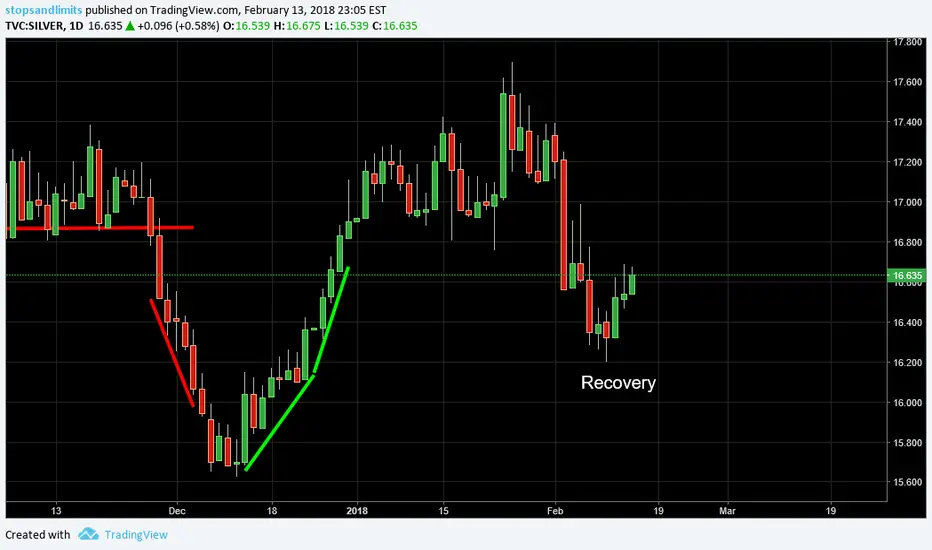
Recovery

BTC ... will we get away without a back test of the bottom?Hello folks ... interesting times.
I have to admit, the fact that we did not crack 7k (yet) threw me off a little. The Bart Simpson pattern which was created prior to the bottom at 7040 made it very difficult to count waves. It does seem we completed an ABC from 10k down to 7k. It also seems to be that we are in recovery mode.
But let's be honest ... the entire climate is still bearish ... it doesn't take much of a drop to have mostly everyone predicting we are going to 5k soon!
I have my predictions going out, but we'll take it one step at a time.
Based on what I am seeing, I'd say the highest probability is BTC will test one of the old all time high trend lines, at around 7800 to 7900. At that stage it is hard to predict whether it will drop back hard, or after a smaller correction, make its way up again even higher ... possibly to test the top of the triangle (maybe). The gold lines show the projected path, which will definitely require adjustment as data comes in!
So likely 7800 is the key level to watch.
However, be on guard ... we are due for a correction soon. It shouldn't be a major one ... but just some consolidation to enable BTC to carry on to 7800. However, it is possible that a drop to the 7250 ... 7300 level ... which is definitely in normal correction range ... that could set-off a retest of the 7k bottom.
So taking it one step at a time ... a correction is due soon. If it holds up above 7250/7300, then likely we would continue to 7800. If it breaks down here ... we could go deep, even well past 7k. 7250/7300 and 7800/7900 are the key levels over the next day or two. Be sure to keep an eye on them. The red arrows I show are where there is a highest chance of going back down to test bottom over the next few days, in my humble opinion.
Remember only a fool relies on one potential scenario.
Do not use this information for financial decisions. For educational purposes only!

S&P 500 Recovering from CorrectionI am not licensed or certified by any individual or institution to give financial advice. I am not a professional Stock trader.
The S&P 500 has been in a Correction since February 2018. Some of you are worried about Corrections and Retracements and Down Markets. Don't be. They are a normal part of a Market life cycle. According to the Motley Fool, at fool.com, "Cumulatively, the S&P 500 has spent 7,040 days declining in correction since 1950. Given that there have been 36 corrections, the average correction time is about 196 calendar days over the past 68 years." A quick calculation (not meant to be pin point accurate, just a ball park figure) makes 196 days roughly 6.5 (six and a half) months. If the Correction started in February, that gives us roughly to August or September (again, ballpark figure) until the Market goes back to being a Bull. My theory is the Recovery has already started. The purple lines I've drawn (solid horizontal lines at top and in middle of the chart) show the Correction range (a Correction is typically calculated to be around 10%). The red line (horizontal solid line at very bottom of chart) is the range of a Bear Market, or roughly 20% down from the high. Yes, you read correctly, we are not in a Bear Market. We have not been in a Bear Market. We have been in a Correction; but I think that's about to change. The orange lines show an up-trend in the S&P starting in early April. Now, I could be wrong; the Market could turn and show me I have no idea what I'm talking about (which is completely possible, read my disclaimer at the top). However, If nothing changes, this could be the Recovery period. Don't run out and start spending Bullish just yet; this is an Up-Trend with pretty defined support and resistance lines which means the Market will still go down.
If you see the Market going down; or hear, see, or read about it on your preferred media outlet--don't panic. Look at the trend lines and see if it still following them. If the S&P remains between the Support and Resistance up-trend lines the Recovery is still going smoothly, albeit slowly. One last hurdle it has to jump before starting to run with the Bulls again is that dotted blue line at around 2800ish. That marks a Resistant Line from March 12-13, 2018. That is third base. Once it rounds that corner it is heading home; but in order for it to avoid getting tagged out, and to cross the plate and score, it needs to breach the high from January 26, 2018 which sits around 2872. I do think this Correction will be over by the Fall of this year, but that hypothesis is centered entirely on the S&P maintaining the Up-Trend or going entirely Bullish in some other way. If the S&P breaks the Up-Trend Support, then forget almost everything you just read.

BTC: Now That's Bullish.BTC just attempted a corrective dump after a double top near strong resistance up at 9k, and recovered surprisingly fast.
The dump didn't even make it down to the common 236 fib before receiving a strong bounce on the 382 above it, and then clearing over the 618. The 15m RSI didn't even touch the 30 line during the dump, let alone the 30m RSI. This has the signs of an immediate recovery after what should have been a much steeper drop following a long ride up to a solid double top at major resistance. The bulls are back in town; looks like its finally not just bots boosting an uncertain market.
This could mean we won't be seeing a deep correction to an inverse head n shoulders, but might form yet another cup n handle to break resistance up to test 10k. However, things change fast in the crypto space so we'll have to see.

MTL Price Recovery?Looking at the past several month's decline in MTL prices coupled with the recent increase in trading volume and value, it seems possible a price recovery may be taking place.
In the graph, the plotted lines show what a complimentary incline for the past several months of decline could look like.

LTC COULD RECOVER $180As I am learning some trading indicators, I would to share you my point of view for the short LTCUSD. I noticed a validated inverse H&S pattern, so LTCUSD could test the $170 support of the bear channel. The RSI seems to work towards an increase trend, since we already had 3 oversold before. If we break that support, LTCUSD could recover $180 tomorrow.
What do you think about that short analysis, is it enough to justify such forecast ?
My english is not the best, but think it is enough to be understood.
Thank you and have a great trade ahead.
The chart with more details :

Possible BTC recovery signs??BTCUSD : DAILY
Are we seeing a the clouds clear up??
If we fill out all of these scenarios we may see some serious recovery happen over the next month as we approach the tip of this wedge.
I am seeing a Head and Shoulders pattern possibly fill out here pending some ideal conditions:
- Stoch RSI double bounce, cross, and separation due to oversold condition signaling bullish movement upward.
- RSI staying above or bouncing off of 32 level and increasing strength into the bullish zone.
- And most ideally, a MACD crossover as close to, if not on, the Zero line. I see this consistently, MASSIVE bullish movement after a MACD cross ON the zero line.
Oooooofffff course....... it could very well break out below the wedge, but that's not a happy thought. Plus I prefer to make rockets on my charts, not missiles =)
The price might bounce off of the $7510 resistance, but will likely hit the $6950 to $7000 range before it begins recovery, this is kissing the current trend line as well as a strong resistance intersection point.
Assuming these conditions are met and the price doesn't jump off of a cliff, we need to see some consistent closes above previous resistance lines, and hopefully we will see a positive breakout of the wedge come end of March or beginning of April.
However, if it drops below that trend line, the next identified support is at the $6100 to $6200 range. Fingers crossed that I will not have to reevaluate due to those conditions.....
I seriously put a lot of work into my rocket.
-Spreck
Standard disclaimer: This is not financial advice, just ramblings of some dude that likes looking at, and drawing on graphs.

The Road to Recovery for Bitcoin and Altcoins During the 2008 recession, economist looked at data from the Great Depression in the 1930's to help them understand what the path to recovery would look like. In cryptocurrency, the only past example of a major retracement was 2014 (and that took 3 years to recover!). However, of course, since more people know about crypto now and there are other great coins and development teams out there (not just Bitcoin), the recovery shouldn't take quite that long. This is a projection of what the 2018 recovery would look like if it does follow the pattern of 2014-2016. One major assumption I'm making is that the market will crash back down to its strongest support, below even the lowest ebb we saw in February. This is just a realistic assumption; I've never seen a head and shoulders that turned out well; crypto enthusiasts are telling themselves that this couldn't possibly be like the dot-com bubble because it's different, but it is much like it. A recovery won't happen overnight, and I would be highly suspicious of any massive recovery that happens in a very short period of time. A Fibonacci cup that tests resistances and grows organically is much more healthy and likely than a surge to 820 billion in April that basically just looks like a set of twin peaks. Since the massive correction happened 3 times as quickly, this projection does assume that the recovery period will happen 3 times as quickly (just under 1 year instead of 3).
I understand many people who expected quick sustainable growth will be very disappointed, especially because they're surrounded themselves with yes-men who even told them in January that the market was just bull-flagging and there was nothing to worry about. But this recovery may very well take the better part if not most of the year if the market truly falls down to its strongest support. The massive bull run that happened in October, November and December took the entire 9 months of accumulation to create. The next bullrun will need an accumulation phase as well. For mid to long term holders, I would wait till April or May to buy in at least.