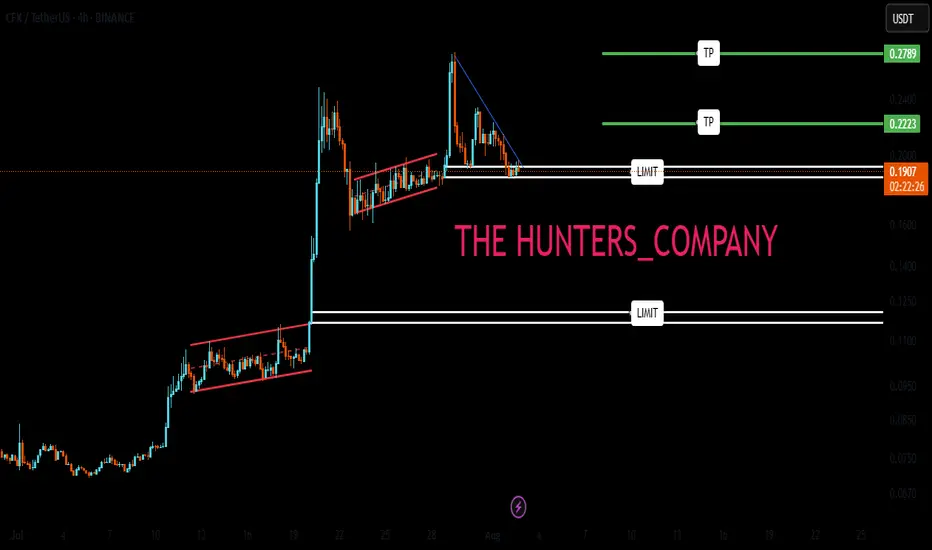
CFX : don't be afraidHello friends🙌
If you take risks, you will win. If you don't, you will regret it.
✅Given the good price growth, now that the price is in a correction phase, there is a good opportunity to buy with risk and capital management, of course, at the specified support levels and move with them to the set targets.
🔥Follow us for more signals🔥
*Trade safely with us*
Rectangle
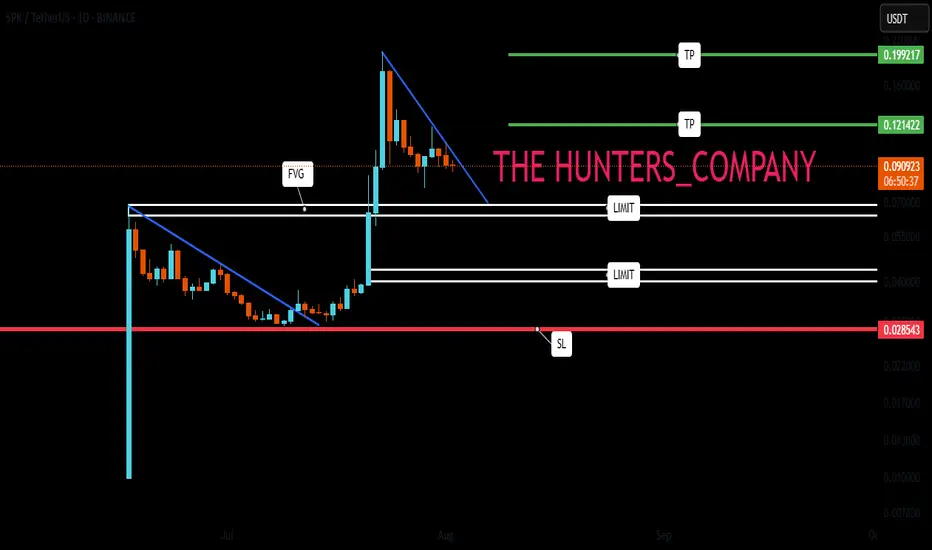
SPK : Does history repeat itself?Hello friends🙌
✅You see that once a pattern was formed and after the resistance was broken, we had a good growth.
✅Now the same pattern has formed again and the price is in the accumulation phase.
✅We have to see if history repeats itself and if the buyers support the price again or not.
✅We have obtained important support areas for you, so that if it falls, you can buy in steps and if the pattern breaks, you can buy in steps right here, of course with capital and risk management.
🔥Follow us for more signals🔥
*Trade safely with us*
Johnson & Johnson Wave Analysis – 31 July 2025 Johnson & Johnson reversed from the resistance zone
- Likely to fall to support level 160.00
Johnson & Johnson recently reversed down from the strong resistance zone located between the long-term resistance level 168.15 (upper border of the weekly sideways price range from 2023) and the upper weekly Bollinger Band.
The downward reversal from this resistance zone stopped the earlier intermediate impulse wave (3).
Given the strength of the resistance level 168.15 and the overbought weekly Stochastic, Johnson & Johnson can be expected to fall to the next support level 160.00.

USDCAD Wave Analysis – 31 July 2025
- USDCAD broke resistance zone
- Likely rise to resistance level 1.3900
USDCAD currency pair recently broke the resistance zone located between the resistance level 1.3785 (upper border of the sideways price range from the start of June) and the 50% Fibonacci correction of the downward impulse from May.
The breakout of this resistance zone accelerated the active impulse wave 3, which belongs to medium-term impulse wave (B) from the start of July.
USDCAD currency pair can be expected to rise further to the next resistance level 1.3900 (target price for the completion of the active impulse wave 3).

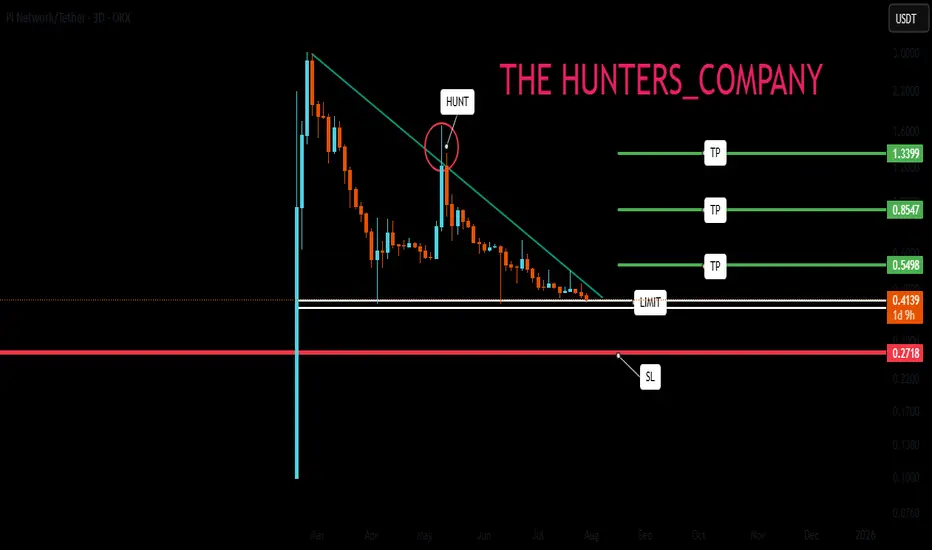
PI NETWORK : Will it finally be pumped?Hello friends🙌
👀According to the decline we had, you can see that the price has reached an important area and has formed a floor in this area. Considering the classic ego that is forming on support, you can enter the trade by breaking the resistance, of course, by managing risk and capital and moving with it to the specified goals.
🔥Follow us for more signals🔥
*Trade safely with us*
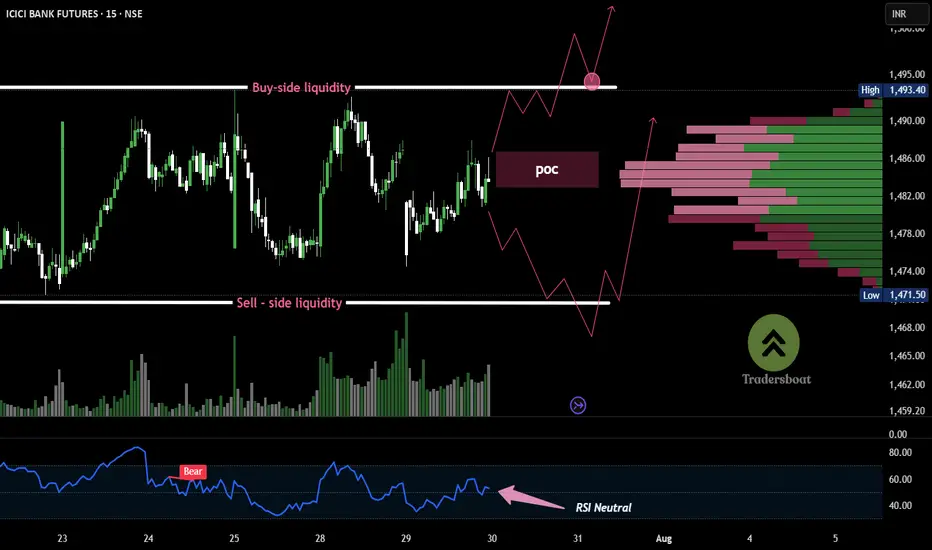
ICICI BANK -15MIN Volume bulge at ₹1485 = decision pointICICI Bank Futures is consolidating in a tight range between ₹1462 and ₹1493, building both buy-side and sell-side liquidity. This structure typically precedes a strong breakout.
The volume profile shows a concentration around ₹1484–₹1486, indicating it as a decision zone. RSI remains weak below 50, suggesting short-term bearish control, but a breakout in either direction could trigger momentum.
Trump Wave Analysis – 29 July 2025- Trump falling inside the sideways price range
- Likely fall to support level 8.4380
Trump cryptocurrency continues to fall inside the sideways price range, which has contained price action from the start of June.
The earlier downward reversal from the upper boundary of this price range 11.00 formed the daily Japanese candlesticks reversal pattern Shooting Star, which started the active impulse wave 3.
Given the clear daily downtrend, Trump cryptocurrency can be expected to fall to the next round support level 8.4380 (lower border of the active price range).

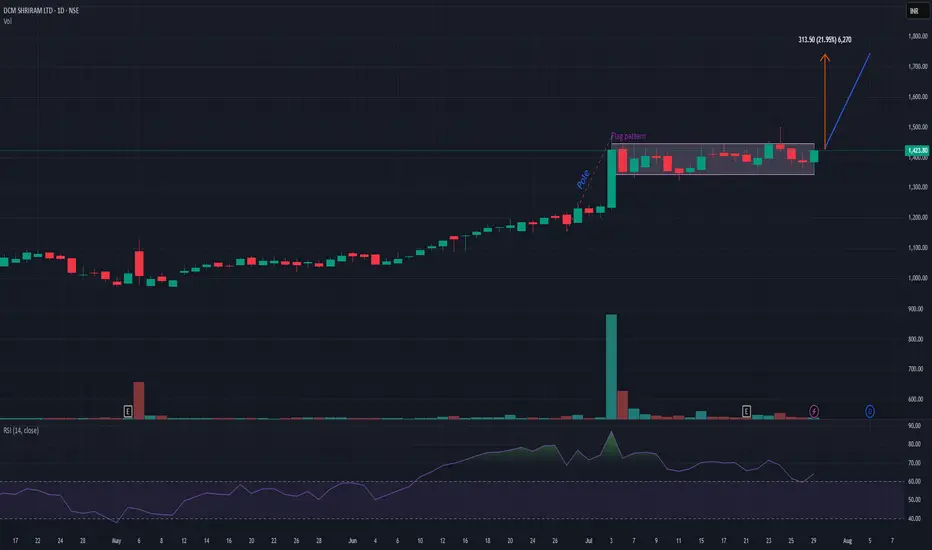
DCMSHRIRAMDCMSHRIRAM is on verge of flag pattern breakout provided that it closes above 1440 level. It has a potential to add up to 20-22% from this level. My view may change if it closes below 1350. Risk-reward is quite in favor. Keep it on radar.
Trading breakouts in summer: Japan’s index pushes higherSummer breakouts are tricky with low market participation, but Japan’s stock index just cleared a major level. Whether it’s a rectangle or inverse head and shoulders, the breakout looks valid. We explore how to manage risk, trim stop losses, and aim for a solid reward ratio. Will this push continue?
This content is not directed to residents of the EU or UK. Any opinions, news, research, analyses, prices or other information contained on this website is provided as general market commentary and does not constitute investment advice. ThinkMarkets will not accept liability for any loss or damage including, without limitation, to any loss of profit which may arise directly or indirectly from use of or reliance on such information.

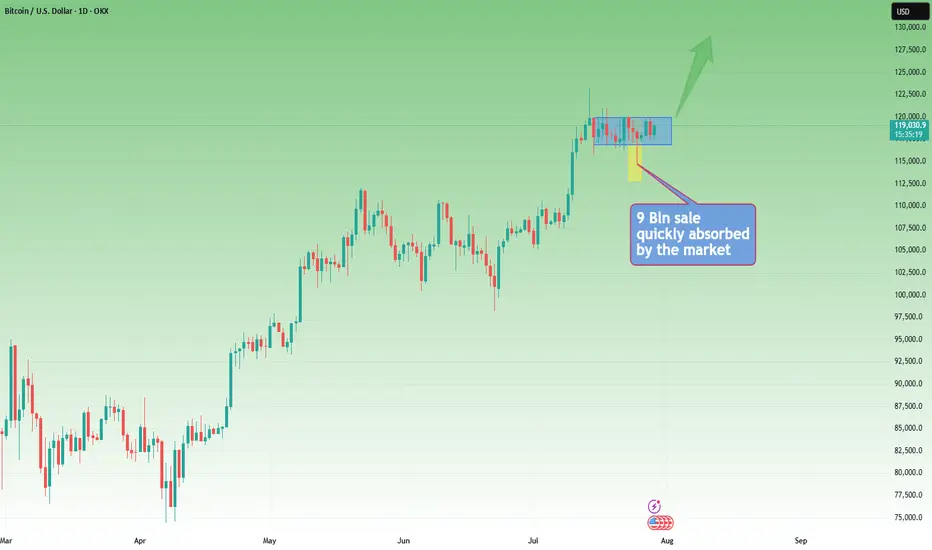
Rectangle Consolidation + Bull Trend = BTC Setup for ATHYesterday, Bitcoin dipped and recovered again, following last week's sharp spike down, triggered by the $9B Galaxy Digital sale on behalf of a Satoshi-era investor.
________________________________________
🧠 Why is this important?
Despite being one of the largest BTC sales in history, the move only caused a temporary spike down.
That’s a clear sign of market strength and strong interest on dips.
________________________________________
📉📈 Current Technical Context:
• If we ignore the spike, price is consolidating in a tight rectangle
• That’s typically a continuation pattern
• The broader trend remains strongly bullish
📌 Put all of that together, and we have at least 3 reasons to expect upside continuation
________________________________________
🎯 Key Levels:
• Break + daily close above $120K → likely leads to a new ATH and a potential test of $130K
• Invalidation only comes with a break below $114K
________________________________________
Conclusion:
BTC just absorbed a massive $9B sell without blinking.
As long as $114K holds, I'm bullish and expecting continuation.
Next leg could (and I hope it will) be explosive. 🚀
CADJPY: Consolidation Trading 🇨🇦🇯🇵
I expect a retracement from a resistance of a consolidation
range on CADJPY.
My confirmation is a double top pattern formation on that
on a 4H time frame.
Goal - 107.79
❤️Please, support my work with like, thank you!❤️

NAS100 [Consolidating ] – Will It Break Higher or Pull Back?The NAS100 has maintained a bullish structure and is currently pressing against the resistance zone around 21,777.3. This area has acted as a ceiling several times in recent sessions. Price is showing consolidation just below resistance, suggesting either an imminent breakout or another rejection.
Currently trading at 21,777.3, with
Support at: 21,450.0 🔽
Resistance at: 22,230.7 🔼
🔎 Bias:
🔼 Bullish: A strong break and hold above 21,777.3 may drive price toward the next resistance at 22,230.7.
🔽 Bearish: Rejection from 21,777.3 could lead to a retracement toward 21,450.0, with deeper downside potential if that level fails.
📛 Disclaimer: This is not financial advice. Trade at your own risk.

USDCAD Wave Analysis – 25 July 2025
- USDCAD rising inside sideways price range inside
- Likely to reach resistance level 1.3800
USDCAD currency pair recently reversed from the key support level 1.3575 (which is the lower boundary of the sideways price range inside which the price has been trading from June).
The upward reversal from the support level 1.3575 created the daily Japanese candlesticks reversal pattern Morning Star.
USDCAD currency pair can be expected to rise to the next resistance level 1.3800 (upper border of this sideways price range, top of wave (2)).

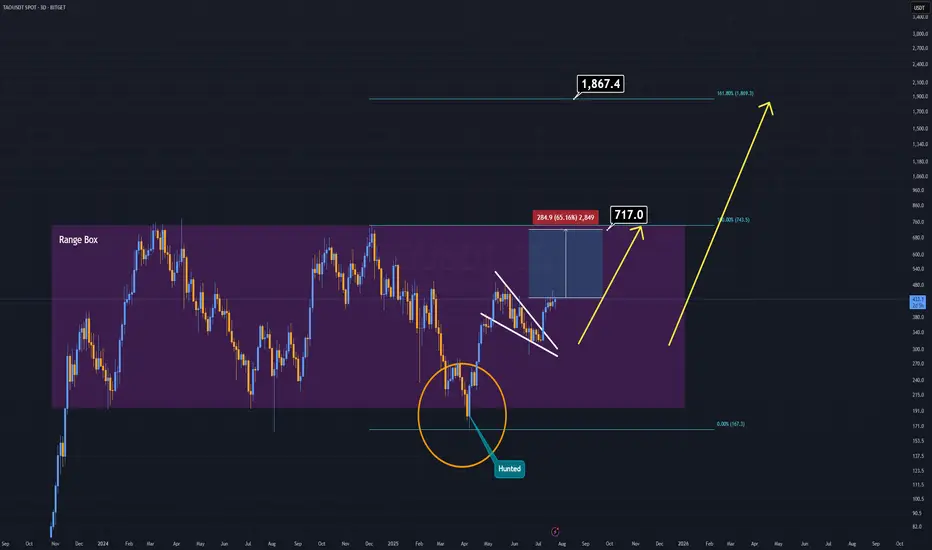
TAO Analysis (3D)Sometimes, there's no need for complex patterns or heavy indicators — and TAO is a perfect example of that.
For years, TAO has been consolidating inside a clearly defined accumulation box. Before the current bullish breakout, it liquidated all weak hands by sweeping the lows — convincing many that the project was dead.
Now, on the daily timeframe, we’re seeing a broken and active pennant formation, which is already being validated.
This structure alone is a strong technical buy signal.
With the upcoming AI-driven bull run, TAO has the potential to outperform many of its AI-sector peers.
This one might just fly ahead of the pack.
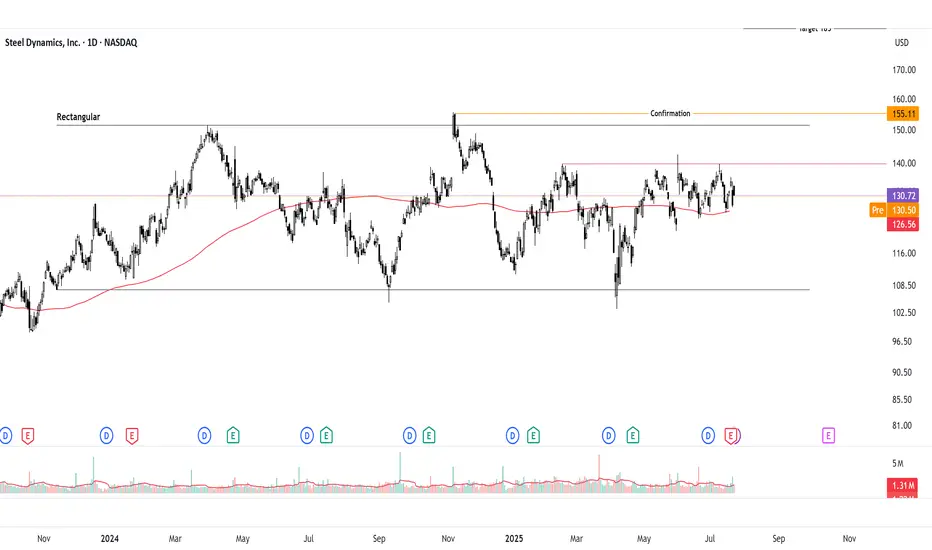
Bullish Breakout Watch on Inverted Head & ShouldersSteel Dynamics ( NASDAQ:STLD ) is consolidating on the daily chart but forming an inverted head and shoulders (IHS) pattern, signaling potential bullish reversal. Neutral until breakout above 140 pivot, but bias leans bullish with supportive steel fundamentals. Long idea on confirmation; current price ~132-135 (as of July 23, 2025). Upside targets offer strong risk-reward if triggered.
Thought Process Walkthrough:
Spotting the Setup: Scanned steel stocks amid sector rebound signals. STLD's daily chart shows a downtrend bottoming at 107, forming IHS: head at 107 support, shoulders higher, neckline ~140. Overlaid rectangular consolidation (107-151.5) adds confluence for breakout potential.
Technical Tools: Used trendlines (descending from highs, capping at 140-151.5), pivot points (140 key reaction level), and classic patterns. No indicators needed—price action clear: volume up on rallies, RSI neutral ~50. IHS target: measure 33-point head-to-neck, add to breakout → ~173 (adjusted to 185 for prior highs). Rectangular height ~44 points → 208 target.
Key Levels:
Support: 107 (IHS head, historical low—break invalidates bull case).
Resistance: 151.5 (rectangular top, past peaks—break above 155 confirms momentum).
These are significant due to repeated price reactions, providing high-probability zones.
Prediction: Consolidation now, but bullish breakout likely if 140 clears on volume, driven by pattern resolution and fundamentals. Without it, range-bound neutrality persists.
Fundamentals Supporting Thesis:
US steel outlook for 2025 shows moderate growth: CAGR ~2.4% through 2030, driven by automotive and construction demand. Economic moderation but robust drivers like infrastructure spending position the sector. For NASDAQ:STLD STLD, Q2 2025 EPS $2.01 missed estimates but operating income rose 39% despite challenges; revenue $4.57B, EBITDA $533M. Management eyes profitability acceleration into 2026 via efficiencies and demand While global capacity rises ~6.7%,US protections and STLD's strong balance sheet support upside.
BREAKING – US to Unveil Key Crypto Report: Crucial Moment for BiIn what could be a watershed moment for the digital asset industry, the U.S. government is expected to release a major crypto policy report in the coming days. Sources suggest the report will outline a framework for regulating digital assets, including Bitcoin, stablecoins, and DeFi—potentially defining how crypto will be governed in the world's largest economy.
Why This Report Matters Now
Amid rising political and economic pressure, the U.S. is being forced to take a firmer stance on crypto. With the 2024 elections behind and growing institutional participation, Washington is no longer able to delay key decisions.
Expected highlights of the report include:
Clarification on whether certain crypto assets are securities
Guidelines for stablecoin regulation
A potential roadmap for central bank digital currency (CBDC) development
Recommendations on DeFi and wallet service compliance
The report comes at a time when market volatility and fragmented oversight have led to investor uncertainty and inconsistent enforcement across states and agencies.
Possible Scenarios: Boom or Bust
Pro-Bitcoin Outlook
If the report favors clear rules, supports innovation, and endorses Bitcoin as a commodity (as the CFTC suggests), it could trigger a strong market rally. Institutional players sitting on the sidelines may finally enter.
Harsh Regulation
On the other hand, if the report leans toward heavy-handed enforcement—especially targeting self-custody, privacy, or DeFi—it could stifle innovation and lead to capital flight to offshore markets.
Neutral-but-Positive
A middle-ground report offering regulatory clarity without immediate enforcement could calm markets and lay the foundation for measured growth.
What’s at Stake for Bitcoin?
Bitcoin’s status in U.S. law remains technically undefined, though it’s generally viewed as a commodity. A clear statement reaffirming this status could fuel renewed institutional demand, ETF expansions, and deeper integration with traditional finance.
Conversely, if Bitcoin is lumped into broader regulatory restrictions, especially around AML or taxation, it could face new compliance burdens—dampening short-term momentum.
How the Market Is Reacting
Ahead of the report, Bitcoin has shown elevated volatility. Whales appear to be repositioning, with increased activity across derivatives markets and stablecoin inflows—indicating expectation of major movement.
Traders are watching key support at $56,000 and resistance near $60,000. A clear policy win could break this ceiling fast.
Conclusion
The upcoming U.S. crypto report could mark a historic regulatory pivot. For Bitcoin and the broader industry, the stakes are high: legitimacy, liquidity, and long-term growth—or repression and stagnation. One thing is certain—the days of regulatory limbo in the U.S. are numbered.

S&P500 INDEX (US500): Bullish Trend Continues
US500 updated a higher high this week, breaking a resistance
of a bullish flag pattern on a daily time frame.
I think that the market will rise even more.
Next goal for the bulls - 6359
❤️Please, support my work with like, thank you!❤️
I am part of Trade Nation's Influencer program and receive a monthly fee for using their TradingView charts in my analysis.

NASDAQ INDEX (US100): Bullish Continuation Confirmed
NASDAQ Index broke and closed above a resistance of a horizontal
parallel channel on a daily.
It confirms a bullish trend continuation and a highly probable growth
to the next strong resistance.
Goal - 23300
❤️Please, support my work with like, thank you!❤️

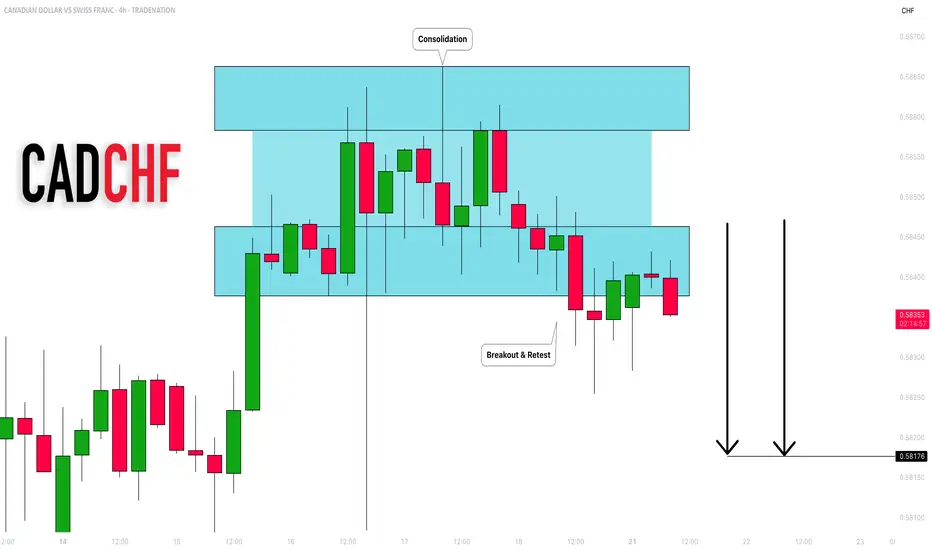
CADCHF: Bearish Outlook Explained 🇨🇦🇨🇭
CADCHF completed an intraday consolidation within a horizontal
parallel channel.
Its support was broken on Friday and we see a positive bearish
reaction to that after its retest.
With a high probability, the price will drop to 0.582 level soon.
❤️Please, support my work with like, thank you!❤️
I am part of Trade Nation's Influencer program and receive a monthly fee for using their TradingView charts in my analysis.
This is eth 2.0, grab your seat before pumpingSame chart pattern like eth 2.0
If smart money tp eth, they will move this counter next.
Grab the seat before the rocket is fire.

ROIV: A Speculative Biotech Play with Cash in the Bank and CatalRoivant Sciences (NASDAQ: NASDAQ:ROIV ) is one of the more intriguing speculative plays in the biotech sector right now. Trading around $11.45, the stock offers exposure to a deep pipeline of clinical-stage assets through its decentralized “Vant” model—subsidiaries focused on specific therapeutic areas like Immunovant (autoimmune), Pulmovant (pulmonary), and Priovant (inflammatory and dermatological conditions).
The company went public via SPAC in 2021 and has maintained a capital-efficient approach, acquiring and spinning off promising drug candidates. What sets Roivant apart is its incredibly strong balance sheet: nearly $5 billion in cash and equivalents with minimal debt. That translates to about $7 per share in net cash, giving it one of the strongest financial positions in the biotech sector and a long operational runway.
Roivant’s upcoming earnings call on August 7 (after market close) will be closely watched. Investors are particularly focused on late-stage clinical data expected in the second half of the year, including Phase III readouts for brepocitinib (Priovant) and updates from Immunovant’s FcRn inhibitor programs. These results could serve as major price catalysts.
Financially, Roivant is still burning cash, as expected at this stage. The most recent quarterly earnings showed an EPS loss of –$0.29, missing analyst expectations. Revenue came in at $7.6 million—above estimates but significantly below the prior year’s figure of $28.9 million. Free cash flow was –$844 million for the year, but with a current ratio over 30 and a healthy reserve, the company is in no danger of running out of capital in the near term.
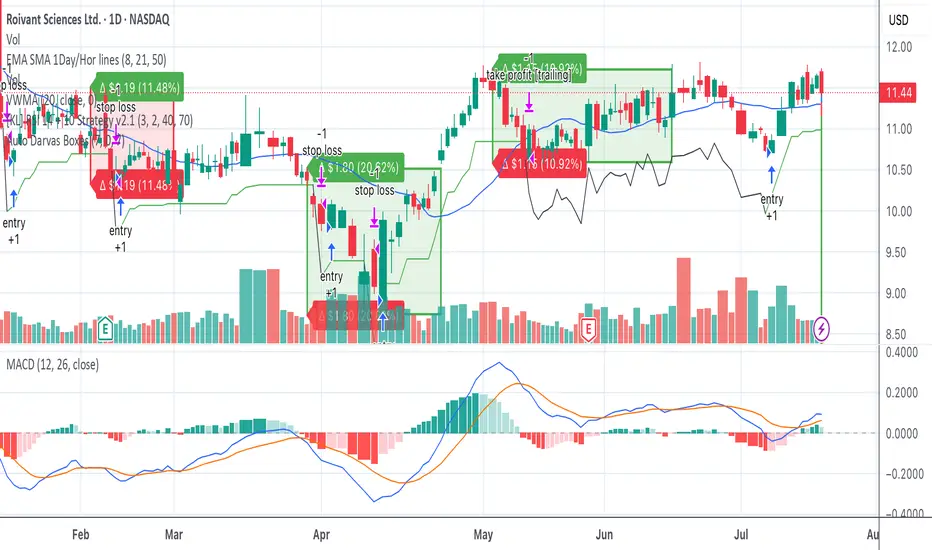
Technical Outlook: Holding Range, Eyes on Breakout
The daily chart shows ROIV in a tight $10.80–$11.80 range, consolidating after a solid run. While the short-term 15-min chart showed a recent pullback, support held at $11.40 and triggered a fresh entry signal in our system. MACD is flattening and could curl bullish again soon. On the daily, MACD remains bullish with room to run if volume enters.
A break above $11.70–$11.80 could trigger the next leg toward $12+, and ultimately the psychological and options-heavy $13 level.
Options Activity: Big Bet on October $13 Calls
What’s catching serious attention is unusual options flow on the October $13 call contracts. Over 17,000 contracts are open, with recent trades in the $0.45–$0.55 range—showing real speculative interest in a move above $13 by Q4. That’s about a 13% move from current levels, well within range for biotech on a good catalyst.
I like the $12 August call for ROIV offers a more conservative upside play than the $13 strike, with less distance to break-even and still attractive risk/reward. Trading around $0.20–$0.25, it only requires an ~5% move to be in the money, making it a more realistic target if momentum builds post-earnings or on positive trial news. With less premium risk and higher probability, it’s a smart middle ground. And it's not a bad buy at $12 heading into Q4.
My Position
I’ve taken a very small position in near-term calls to test the setup and stay engaged. The combination of:
A strong cash runway
Upcoming catalysts
Technical setup near breakout
And rising options interest
makes ROIV a name to watch closely.
The Setup: Binary Risk, Asymmetrical Reward
For those considering the October contracts, this is a classic biotech setup:
Defined risk (premium paid)
Asymmetrical upside if catalysts hit
A clear breakout level to monitor ($13+)
And a high cash floor that provides downside cushion
This fits perfectly into a broader strategy of small speculative bets with high return potential.
Roivant isn’t without risk—trial results and sentiment shifts matter—but it’s one of the better-positioned clinical-stage plays heading into the second half of 2025. Watch for updates on Priovant and Immunovant, track the $13 level, and monitor volume and MACD crossovers for clues. If this stock breaks out, October could be the window.
#btc #btcusd #elliottwave short sell setup wave 4 16Jul24This count is based on my assumptions so anything can happen not a trading or financial advice just for educational purposes only kindly do your own ta thanks trade with care good luck.

Ethereum Wave Analysis – 16 July 2025
Ethereum: ⬆️ Buy
- Ethereum broke resistance area
- Likely to rise to resistance level 3400.00
Ethereum cryptocurrency recently broke the resistance area located at the intersection of the resistance level 3200.00 and the resistance trendline of the daily up channel from May.
The breakout of this resistance area should accelerate both of the active impulse waves 3 and (3).
Given the clear daily uptrend, Ethereum cryptocurrency can be expected to rise to the next resistance level 3400.00 (which reversed Ethereum multiple times in January).
