USDCHF - BULLISH MOVE !Hello Traders !
The USDCHF price formed a rectangle pattern.
Currently, The resistance level (0.79950 - 0.79800) is broken !
So, I expect a bullish move🚀
_______________
TARGET: 0.80330🎯
Rectangle

Silver Analysis – Strong Bulls and a Clean Setup AheadLast month, Silver printed a new multi-decade high, a major technical milestone.
Since then, price has entered a sideways consolidation, forming a rectangle — but what stands out is this:
👉 Silver bulls have absorbed every dip, even when Gold dropped.
That’s strength. And strength usually precedes breakout.
🔍 Current Situation
At the time of writing, price is trading around 37.20,
and from the current structure, it looks like nothing is standing in the way of an upside break.
We don’t predict — we prepare...
And this chart looks ready.
🎯 Next Target: 40.00 USD?
A push to 40.00 looks like the next “normal” target.
But don’t forget: that’s a 3,000 pip move.
This type of move will require patience
Plan your trade.
Respect your risk.
Let the bulls work. 🚀
Disclosure: I am part of TradeNation's Influencer program and receive a monthly fee for using their TradingView charts in my analyses and educational articles.

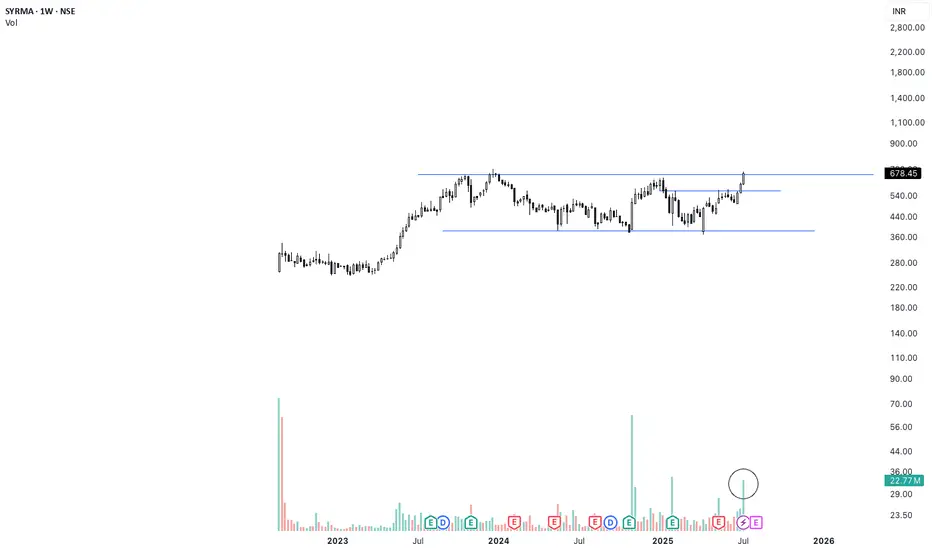
SYRMA Weekly Breakout | High Volume + 1.5-Year Base Structure🚨 Breakout Alert on SYRMA (Weekly)
After 1.5 years of sideways consolidation, SYRMA has finally broken out with strong conviction. The breakout is supported by the highest weekly volume seen in months — signaling smart money accumulation.
📊 Technical Setup:
🔹 1.5-year base formation now broken
🔹 Breakout candle closed above resistance with strength
🔹 Volume spike confirms breakout validity (HVE)
🔹 Structure resembles classic Stage 2 breakout
🟢 Ideal retest zone: ₹670–₹680
🛑 Support zone: ₹635–₹645
Fundamental Snapshot:
✅ Revenue: ₹2,000 Cr → ₹3,800 Cr in 2 years
✅ Net Profit up 50% YoY
✅ EPS (TTM): ₹9.57
✅ Promoter holding: ~46%
✅ Dominant player in EMS & IoT hardware
⚡Macro trend supports domestic electronics manufacturing — still early in the cycle.
SILVER (XAGUSD): Correction is Over?!
It looks like Silver has finally completed a consolidation within
a wide horizontal parallel channel on a daily.
A new higher high formation today indicates coming growth.
Because if its Friday, I suggest looking for trend-following buy from Monday.
Let the market close above the underlined resistance to let it set a Higher Close
as well.
Look for buying after a pullback, aiming at 38.0 as the first goal.
❤️Please, support my work with like, thank you!❤️

Educational: how to spot bitcoin tops before they happenBitcoin is rising, but how far can it go? In this video, I walk through key tools to spot local tops, including funding rates, Twitter sentiment, and pattern targets. We also discuss setups in XRP and Solana, and what to watch ahead of the US crypto regulation update on July 22.

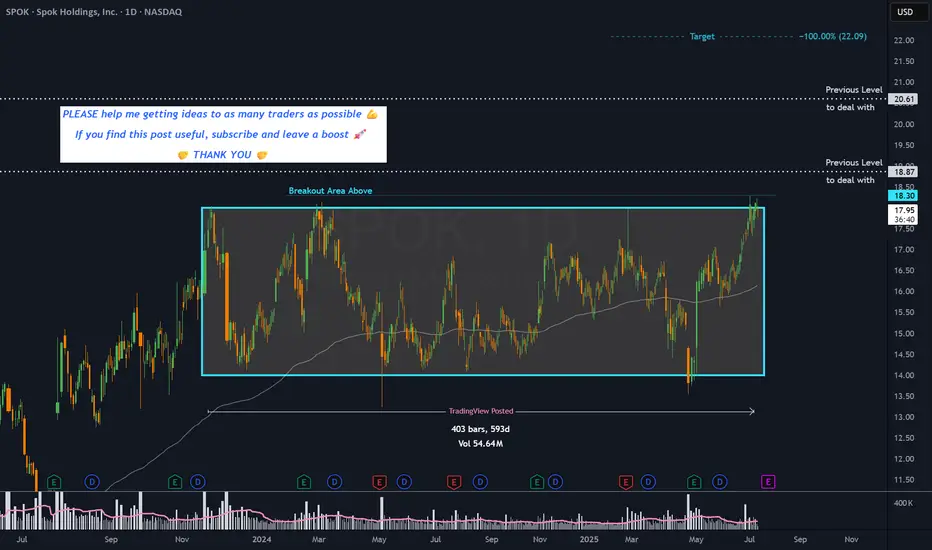
SPOK - 19 months RECTANGLE══════════════════════════════
Since 2014, my markets approach is to spot
trading opportunities based solely on the
development of
CLASSICAL CHART PATTERNS
🤝Let’s learn and grow together 🤝
══════════════════════════════
Hello Traders ✌
After a careful consideration I came to the conclusion that:
- it is crucial to be quick in alerting you with all the opportunities I spot and often I don't post a good pattern because I don't have the opportunity to write down a proper didactical comment;
- since my parameters to identify a Classical Pattern and its scenario are very well defined, many of my comments were and would be redundant;
- the information that I think is important is very simple and can easily be understood just by looking at charts;
For these reasons and hoping to give you a better help, I decided to write comments only when something very specific or interesting shows up, otherwise all the information is shown on the chart.
Thank you all for your support
🔎🔎🔎 ALWAYS REMEMBER
"A pattern IS NOT a Pattern until the breakout is completed. Before that moment it is just a bunch of colorful candlesticks on a chart of your watchlist"
═════════════════════════════
⚠ DISCLAIMER ⚠
Breakout Area, Target, Levels, each line drawn on this chart and any other content represent just The Art Of Charting’s personal opinion and it is posted purely for educational purposes. Therefore it must not be taken as a direct or indirect investing recommendations or advices. Entry Point, Initial Stop Loss and Targets depend on your personal and unique Trading Plan Tactics and Money Management rules, Any action taken upon these information is at your own risk.
═════════════════════════════
Hero MotoCorp — Daily Chart Breakout Trade SetupHero MotoCorp — Daily Chart Breakout Trade Setup
Range Bound: The stock has been consolidating between ₹4,170–₹4,400 for the past several weeks.
Structure: This is a classic rectangle consolidation, often a continuation pattern.
Volume: Watch for volume expansion on the breakout; prior breakouts lacked follow-through due to low volumes.
Higher Timeframe (Weekly/Monthly) charts show a bullish continuation since mid-May, with high-volume candles across weekly and monthly charts
Key resistance zones: Weekly resistance lies between ₹4,930–₹5,000.
Strong fundamental macro tailwinds: March sales show robust performance in both domestic ICE and EV segments (Vida)
🔍 Key Confirmation Signals for a Potential Trade
✅ Strong daily candle close above ₹4,420
✅ Above-average volume on breakout
✅ RSI crossing 60 on breakout adds momentum confirmation
⚠️ Risk Management Notes
Avoid early entry within the range (false breakouts possible)
Wait for EOD close above resistance for confirmation
Consider a trailing SL once the stock crosses ₹4,500

CRUDE OIL (WTI): Will It Rise More?
Quick update for my yesterday's analysis for WTI Crude Oil.
As I predicted yesterday, the price went up to the target.
We got one more strong bullish confirmation after a New York
session opening:
the price violated a resistance of a horizontal range on a 4H time frame.
I think that the market may rise even more and reach 69.25 level.
❤️Please, support my work with like, thank you!❤️

Side way Breaks to new all time high Hello Traders,
i can see big volume compared to the monthly trading at the ending of side way markets which will lead for a continuation for the bullish trend targets is already mentioned and it depends what you are investing for short intermediate long if we break the discount area we well go for big correction advice to sell with the retest however if we breaks the discount area huge profits coming. if you like the idea kindly show your support for more ideas to come good day.

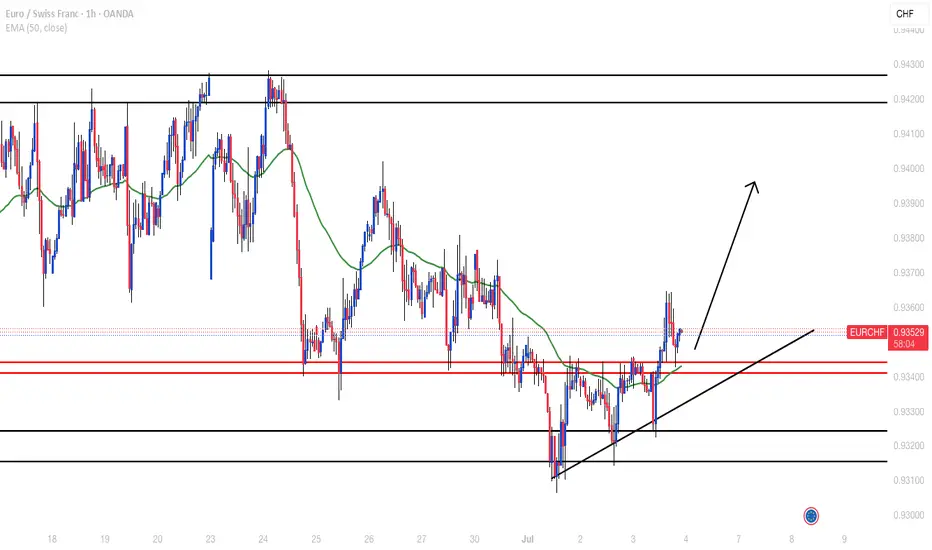
EURCHFPair still in an H4 range. Bounced off support zone, broke H1 resistance and retested. Looking to go long to next H1 resistance zones
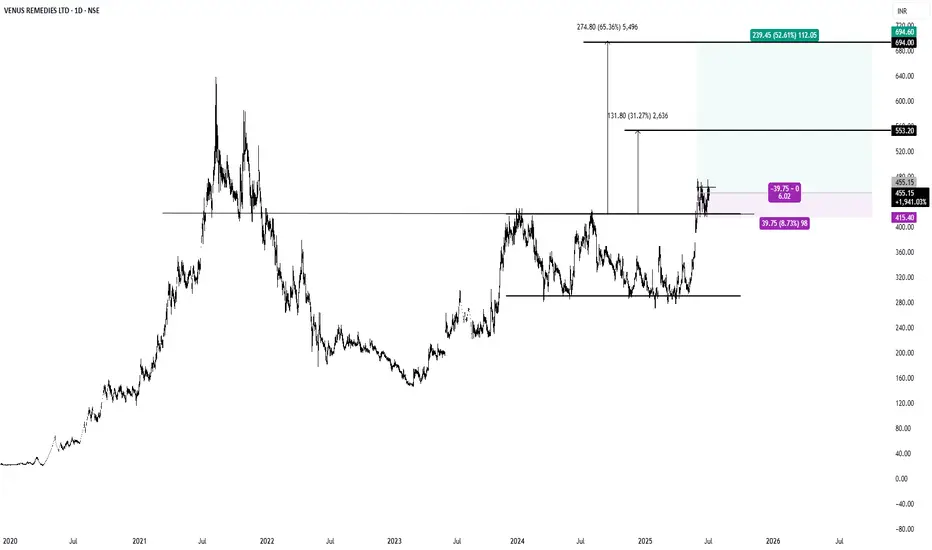
$VENUSREM #INDIA #NSE1. Cup and Handle Break Out.
2. Parallel Channel Break Out.
3.R:R >6 , Tight Stop Loss.
CRUDE OIL (WTI): Consolidation is Over
Crude Oil was consolidating for 6 trading days in a row
after a test of a key daily support.
The yesterday's Crude Oil Inventories data made the market bullish
and the price successfully violated a minor resistance of a sideways movement.
We can expect that the market will grow more.
Next resistance - 69.27
❤️Please, support my work with like, thank you!❤️

EURGBP: Strong Bullish Confirmation 🇪🇺🇬🇧
EURGBP is going to continue rising in an uptrend
that the pair established at the end of May.
A completion of a consolidation and a formation of a new local Higher High
indicate a highly probable bullish continuation soon.
Next resistance - 0.8605
❤️Please, support my work with like, thank you!❤️
I am part of Trade Nation's Influencer program and receive a monthly fee for using their TradingView charts in my analysis.

HAL: fake breakdown and a possible bullish move.Stock: Hindustan Aeronautics Ltd NSE:HAL
• Timeframe: 1-day candles (each candle represents one day of trading)
1. Consolidation Zone: A grey rectangular box highlights an area of "consolidation" starting from around May 14th. This means the stock price has been trading sideways within a relatively narrow range, not showing a clear uptrend or downtrend.
2. Fake Breakdown: An arrow points to a price dip below the lower boundary of the consolidation zone. The annotation calls this a "fake breakdown." This implies that the price temporarily moved below the support level, but then quickly bounced back up.
3. Potential Trade Setup: The chart suggests a potential long (buy) trade based on the fake breakdown and the subsequent recovery.
• Entry Point: Around 4,897.55 (labeled "ENTRY" on the chart) which is the price at which the stock could be bought.
• Stop Loss: Around 4,733.75 (likely intended to be the "4733.60")
This is the level below which the trader would exit the position to limit potential losses if the price moves against them.
• Targets: The chart identifies three potential profit targets:
* Target 1: 5,087.85
* Target 2: 5,305.15
* Target 3: 5,497.80

XAGUSD – Bullish Setup for a Move Toward 40 1. What happened recently
After the massive selloff in early April, Silver (XAGUSD) reversed aggressively — gaining nearly 10,000 pips and breaking into multi-decade highs near 38. That kind of move is not noise. It’s power.
The month of June brought consolidation, with price slowly correcting and stabilizing. But this doesn’t look like distribution — it looks like new accumulation.
2. The key question
Is Silver building a base for the next breakout, or has the rally run out of steam?
3. Why I expect another leg up
- 35.00 is now acting as a solid support — tested, respected
- The correction has been shallow, typical for a bull rectangle structure
- Momentum remains on the buyers’ side — no major breakdown signs
- If buyers step in strongly, the next target is clearly the 40.00 psychological level
- This is a textbook bullish continuation setup.
4. Trading plan
Swing traders should watch the 35.00–35.20 zone for buying opportunities.
The risk/reward is attractive — with a potential for +5000 pips on a move toward 40, while keeping stops under the base.
Buy the dips — not the breakouts.
5. Final thoughts 🚀
Silver is shining again. The trend is up, the structure supports further gains, and the chart is offering a clean setup. Until 35 fails, the bias remains bullish.
Disclosure: I am part of TradeNation's Influencer program and receive a monthly fee for using their TradingView charts in my analyses and educational articles.

OKLO — when nuclear momentum breaks resistanceSince late 2024, OKLO had been consolidating inside a clear rectangle between $17 and $59. The breakout from this long-term range triggered a new bullish impulse. The price has since returned to retest the breakout zone, now aligned with the 0.618 Fibonacci retracement at $51.94. The retest has completed, and the price is bouncing upward, confirming buyer interest.
Technically, the trend remains firmly bullish. The price closed above the prior range, EMAs are aligned below, and the volume spike during breakout supports genuine demand. The volume profile shows a clean path toward $100, indicating limited resistance ahead. The structure suggests a controlled rally rather than an exhausted move.
Fundamentally, OKLO is a next-generation SMR (Small Modular Reactor) company focused on delivering compact, efficient nuclear power solutions. Following its public debut via SPAC and recent capital injection, OKLO is transitioning from development to implementation. Institutional interest is holding strong, and the broader move toward decarbonization and energy independence places the company in a strategic position.
Target levels:
— First target: $100 — psychological and technical resistance
— Second target: $143 — projected from prior range breakout
OKLO isn’t just another clean energy ticker — it’s a quiet disruptor with nuclear potential. The chart broke out. The volume confirmed. Now it’s time to see if the market follows through.

EURGBP: Bullish Move Ahead! 🇪🇺🇬🇧
EURGBP violated a consolidation range on Friday.
It is an important sign of strength of the buyers and I expect a bullish continuation
next week.
Goal - 0.856
❤️Please, support my work with like, thank you!❤️
I am part of Trade Nation's Influencer program and receive a monthly fee for using their TradingView charts in my analysis.

XPTUSD 1W:While Everyone Watches Gold, Platinum Quietly Wakes UpGold gets the headlines — but platinum just broke two years of silence with a clean, high-volume breakout from a symmetrical triangle on the weekly chart. And this isn’t noise — this is the structural shift traders wait for.
Price has been coiled inside a compressing wedge since early 2022. Equal highs. Equal lows. Stop hunts both ways. The classic “shake out before take off.” Now? The breakout is in. And the weekly candle closed above resistance with volume confirmation. Oh, and while we're at it — the 50MA just crossed above the 200MA, signaling a long-term trend reversal.
Target? Measure the triangle height: ~398 points. That projects a breakout target of 1440 USD, which aligns perfectly with previous institutional rejection zones.
But this isn’t just about the chart.
🔹 South Africa, the top global supplier, is struggling with energy and production cuts;
🔹 The Fed is pausing rate hikes — the dollar weakens, metals rally;
🔹 Demand from hydrogen tech, clean energy, and industrial catalysts is on the rise.
Translation? Smart money has been accumulating. The move from 965–1070 was just the ignition. The drive hasn’t started yet.
So while everyone fights over gold highs, platinum sits at the base of a move no one's prepared for — except those who know how accumulation ends.
🧭 Key support: 965–985
📍 Resistance zone: 1150–1180
🎯 Measured target: 1440+

GBPUSD Wave Analysis – 25 June 2025- GBPUSD broke resistance level 1.3590
- Likely to rise to resistance level 1.3880
GBPUSD currency pair recently broke the resistance level 1.3590, which is the upper border of the narrow sideways price range inside which the price has been moving from May.
The breakout of the resistance level 1.3590 accelerated the active intermediate impulse wave (3).
Given the clear daily uptrend and the strong US dollar sales seen today, GBPUSD currency pair can be expected to rise to the next resistance level 1.3880.

PLTR 1D — When the tea is brewed and the handle’s in placePalantir’s daily chart is shaping up a textbook cup with handle pattern — one of the most reliable continuation setups in technical analysis. The cup base was formed over several months and transitioned into a consolidation phase, building a rectangle structure where smart money likely accumulated positions before a breakout.
Now here’s the key: price has not only broken out — it’s settled above all major moving averages, including EMA 20/50/100/200 and MA 50/200. The breakout candle was supported by surging volume, signaling strong participation from institutional buyers. When all the averages start bending upwards, it's usually not by accident.
The breakout above the $121 resistance zone unlocked a pathway toward a target at $187 , derived by projecting the height of the cup upward from the breakout level. This kind of structure, once confirmed, often fuels aggressive continuation — and this one’s got the setup locked in.
From a fundamental perspective, Palantir is holding solid ground: strong earnings reports, expanding government and commercial contracts, and aggressive development in AI services. Institutional interest is rising steadily, and that momentum is visibly reflected in price action.
To sum it up: price has launched cleanly out of the consolidation zone, pierced all critical MAs and EMAs, and continues to gain momentum. While the market sips its tea, this cup is boiling hot. Just don’t forget your stop loss — this is a trading desk, not a tea party.
If you enjoy posts like this, drop a like, share it around, and let’s hear your thoughts below. It keeps ideas moving and the content flowing — free, sharp, and relevant.

Dow Jones breakout targets 44K and beyondThe Dow Jones is finally breaking out, and the chart suggests a 3 to 4 percent move higher is in play. We analyse the key patterns, trade setups, and risks ahead including market seasonality, war headlines, and economic data. Bitcoin, EURUSD, and Nasdaq also showing strength. Is this the start of a bigger rally?
This content is not directed to residents of the EU or UK. Any opinions, news, research, analyses, prices or other information contained on this website is provided as general market commentary and does not constitute investment advice. ThinkMarkets will not accept liability for any loss or damage including, without limitation, to any loss of profit which may arise directly or indirectly from use of or reliance on such information.

War shock moves EURNZD: breakout targets 196.69The US strike on Iran hit risk currencies hard. NZD, AUD, and JPY dropped, while EURNZD broke out of a rectangle pattern. We analyse the setup, target at 196.69, and possible entry zones. Would you trade this in wartime volatility?
This content is not directed to residents of the EU or UK. Any opinions, news, research, analyses, prices or other information contained on this website is provided as general market commentary and does not constitute investment advice. ThinkMarkets will not accept liability for any loss or damage including, without limitation, to any loss of profit which may arise directly or indirectly from use of or reliance on such information.

CRUDE OIL (WTI): Technical Analysis & Important pattern to WatchHere’s my latest analysis on ⚠️USOIL price action.
The price has recently finished a correction, followed by a brief consolidation in a horizontal range and an ascending triangle pattern
A bullish breakout above the intraday resistance levels would suggest a likely end to the accumulation phase.
The chances are high that the pair is returning back to a bullish trend, with a target of 77.00.
Strong fundamentals back this bullish outlook.
