ICP technical analysis, buy here for the long term!ICP looks very strong from a technical perspective. We can see that we have started this whole uptrend with an impulse wave 12345, which is very good to see if you are an Elliott Wave trader. We are now in a corrective phase, and usually we want to see a liquidity sweep below the previous wave (4). In this case, below 8.5 USDT - that would be a great level to buy ICP for the long term!
What is the Internet Computer and ICP?
The Internet Computer blockchain incorporates a radical rethink of blockchain design, powered by innovations in cryptography. It provides the first “World Computer” blockchain that can be used to build almost any online system or service, including demanding web social media, without need for traditional IT such as cloud computing services. As such it can enable full end-to-end decentralization.
Why Does the ICP token have value?
The ICP token has three main utilities. Firstly, ICP provides a source of “cycles” that are burned to power computation (thus when ICP is converted to cycles, it disappears, creating deflationary pressure). Secondly, ICP can be staked in the permissionless Network Nervous System DAO that governs the Internet Computer blockchain, creating voting neurons that generate voting rewards. Thirdly, ICP plays the role of a store of value, for example allowing users to invest in decentralization sales run by web3 services.
Rectangle


MSFT 4HR CHARTQuestion what happens here? Do we breakout this week or do we continue to just trade in this range for another week or two? IDK but I like being able to see these trends. Only if I had unlimited money to take these trades, but one day I will be a great investor/trader also a better technician!!!!


QKC - 1400% profit in 2024, best time to buy!I am giving you this information in advance! Just before a huge pump that is going to happen very soon. Why? We have a very long accumulation phase by whales on the weekly chart (670-day). Usually, after such a long time, there is a great expectation for such a move. From the Elliott Wave perspective, we have a bullish (1)(2)(1)(2) combo (nest) which is pretty much the dream of every Elliott Wave trader. This coin is definitely something you want to consider, you still have time to do your own research as the price is still inside the accumulation phase. I provide you with 3 profit targets; now it's up to you which one you choose and how long you want to wait for it! Let me know what you think about my analysis, and please hit boost and follow for more ideas. Trading is not hard if you have a good coach! Thank you, and I wish you successful trades.
About QuarkChain
The QuarkChain Network is a permissionless blockchain architecture that aims to meet global commercial standards. It aims to provide a secure, decentralized, and scalable blockchain solution to deliver 100,000+ on-chain TPS. The main features of the QuarkChain Network are:
Flexibility: QuarkChain is a public chain that can support multiple consensuses, multiple transaction models ( including virtual machines VMs), ledger, and token economics in one network. It can reportedly adapt to blockchain innovations by customizing consensus, transaction model (including VM), ledger, and token economics in each shard so that to satisfy different requirements of different industries/enterprises/DApps. The network supports two consensus algorithms, PoW and PoSW ( a combination of PoS+ PoW). More consensus algorithms (DPoS, PoS and etc) will be added into different shards in the future. It is EVM-compatible - every DApp deployed on Ethereum can be deployed in QuarkChain. The team plans to add more virtual machines (e.g. EOS VM) in different shards so that developers have more choices.
Scalability: QuarkChain aims to deliver 100,000+ on-chain TPS. Currently, 55000+ peak TPS has already been achieved in TPS competition held within the community
Decentralization: QuarkChain has a two-layered structure and encourages individual miners with different levels of capability to mine directly without joining mining pools. People can choose to mine either in the root chain or in the shard.
Great Usability: QuarkChain supports Native token which enables each shard to have its own tokeneconomics. It also supports scalable cross-shard transactions. Only one account is required to access entire resources in all shards, and smart wallets simplify the management.
Let me know what you think about my analysis, and please hit boost and follow for more ideas. Trading is not hard if you have a good coach! Thank you, and I wish you successful trades.

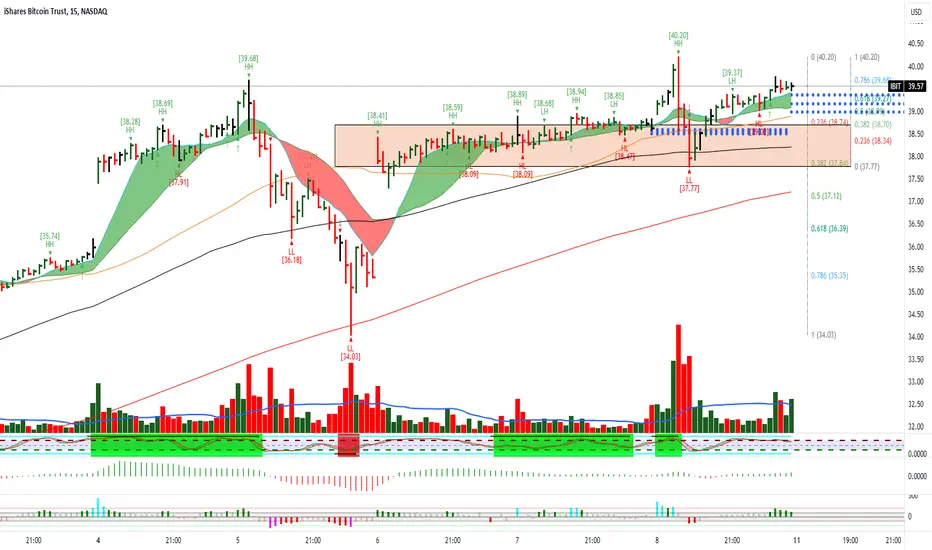
$IBIT March 11, 2024NASDAQ:IBIT March 11, 2024
As of now, the uptrend is intact. Broke the box. On retest took support at the bottom of the rectangle and now above box.
The sideways movement has given enough time for moving averages to catch up.
For the rise of 34.03 to 40.2 NASDAQ:IBIT retraced to 37.77 which is approximately 38.2% retracement.
And for the fall 40.2 to 37.77 NASDAQ:IBIT is around 39.6 well above 61.8% levels.
Holding 38.7 I expect the uptrend to continue for an initial target of 41.5 to 42.5 levels.
I am holding longs at the moment for 42+- 0.5 as targets.
GBPUSD: Watch This Zone to Buy! 🇬🇧🇺🇸
GBPUSD broke and closed above a key daily horizontal resistance
and set a new higher high higher close of this year.
The broken structure: 1.277 - 1.283 area, turned into a demand zone now.
I will expect a bullish trend continuation from the underlined blue area.
Goal: 1.293
❤️Please, support my work with like, thank you!❤️

AUDJPY: Your Trading Plan Explained📊AUDJPY is currently in a consolidation phase, with the price forming a horizontal range 97.50 - 97.36 is s the neckline
If the price breaks and closes below support of the range on the 4-hour chart, it would indicate a strong bearish signal.
Traders should consider selling aggressively or on a retest, with a target set at 96.82.

Unlocking Potential: Power Finance Corporation Analysis! 💼📈Traders, let's delve into Power Finance Corporation today ! 🌟 In the daily timeframe, we're witnessing a range-bound movement, with the price testing previous swing highs. 🔄 Anticipate a breakout above this level(red box), potentially targeting Rs. 450 and beyond. But before that it may come around at Rs.400 to go up further. PFC appears poised for bullish action! 🚀 Options traders, explore 400 CE or below 400 CE options with ample liquidity. Let's capitalize on this opportunity! 💼📊
Thank you. See you again in the next post!
Best regards,
Alpha Trading Station

GBPUSD - BULLISH SCENARIO 🚀Hello Traders !
On The Daily Time Frame, The GBPUSD Formed a Rectangle Pattern.
Currently, The Price Reached The Resistance Level (1.27428 - 1.28280)
So, Let's Expect The Bullish Scenario .
If The Price Breaks and Closes Above The Resistance Level !
We Will See a Bullish Move...
TARGET: 1.29380🎯

GBPUSD: Bullish Trend Will Continue 🇬🇧🇺🇸
GBPUSD set a new higher high higher close on a daily,
violating a resistance of a wide horizontal range on a daily.
It clearly indicates the dominance of buyers on the market.
More growth is coming.
Next resistance - 1.294
❤️Please, support my work with like, thank you!❤️

Coral Finance : High risk, high gainTARGET : 85
STOP LOSS: 58.5
Check chart for more details
**These are my personal observations. Please trade at your own risk.**

Triple Top ReversalExpecting some consolidation SOON
Triple Top Reversal Pattern
Short the dip back to a recent support

$SPY March 7, 2024AMEX:SPY March 7, 2024
15 Minutes.
The gap at open to 510 levels did not allow for a short.
AMEX:SPY taking support on 200 averages and is consolidating for a move.
The moving averages have converged at close.
So holding 508 levels I expect an upward push today towards 513-514 levels.
The stochastics which had a black bar at the bottom have now reversed.
For the rise of 504.91 to 512.05 AMEX:SPY has retraced 50% of the rise, so I expect a top around 514 levels.
As we can see in chat the 512 levels become a resistance, hence I feel the next upward move is only when 514.5 is crossed with a close near the top of the bar.
AMEX:SPY has managed to hold the gap at 503 very well so far.

PIXEL / RangeWe've completed a five-wave structure, removed liquidity above the previous high (ph), and on the linear chart, we're breaking the ascending structure (bos). These indicators suggest a probability of correction towards equal lows (eql), which act as a price magnet.
After removing liquidity at equal lows (eql), I anticipate price action ascending towards the upper level of the sideways channel. This will confirm the range.

USDJPY: Your Trading Plan For Today↪️USDJPY was in an upward trend and reached a new high before entering a consolidation phase in a tight range on the 4-hour chart.
To consider shorting the currency pair with confirmation, it is recommended to wait for a breakout below the support level of the range.
A confirmation of this breakout would be a 4-hour candle closing below the support level. If this occurs, a bearish continuation towards the 147.78 level can be expected.

Rectangle BottomSell opportunity
Rectangle Bottom Pattern
Look to short the breakout to the next level

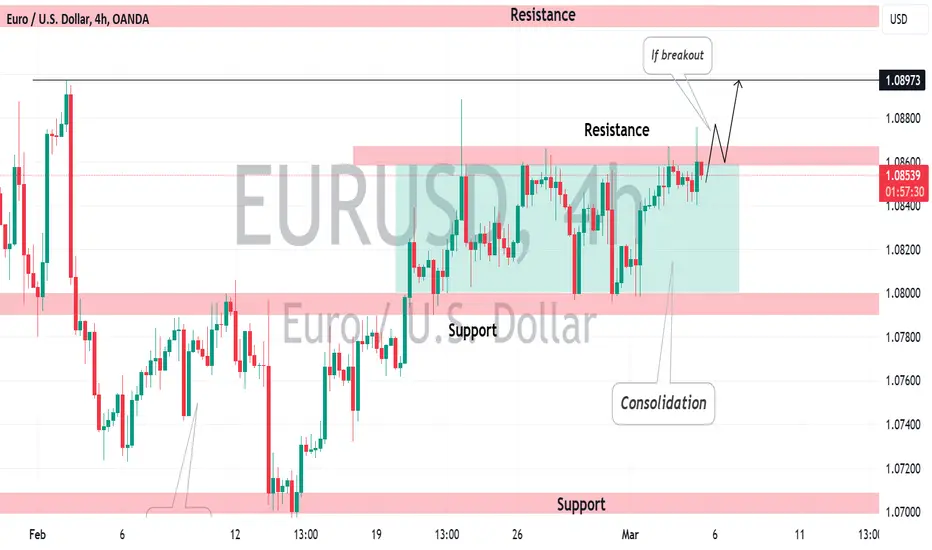
EURUSD: Your Trading Plan For This Week📊EURUSD is currently in a bullish trend, with a consolidation phase happening within a horizontal range after reaching a new higher high.
The resistance of the range is at 1.0867/58, and a break and close above this level on a 4-hour chart could signal a trend-following movement with the next resistance at 1.0897.
On the other hand, a bearish breakout below the support of the range could lead to a bearish continuation in the market.
SILVER - NEW BREAKOUT 🚀Hello Traders !
On The Daily Time Frame, The XAGUSD Reached a Support Level (22.27700 - 21.88300).
The Price Formed a Rectangle Pattern.
The Resistance Level is Broken.
So, I Expect a Bullish Move 📈.
------------
TARGET: 24.16000🎯

SILVER (XAGUSD): Important Breakout 🪙
Silver successfully violated a resistance line of a wide
horizontal trading range on a daily with a strong bullish imbalance.
It may indicate the dominance of the buyers and a strong bullish sentiment.
The market may reach at least 24.0 resistance soon.
❤️Please, support my work with like, thank you!❤️

DCMNVL - BUY ACTIVEDCMNVL - DCM Nouvelle Limited - BUY ACTIVE
Chart Insights : Day Chart
Stock closed at 217 on 04-Mar-23
We can see that stock is broken the resistance with volume and can expect upside move if its sustain above the resistance.
BUY Active only on top of resistance , it may try to retest the same level in coming days , best buy on retest level & keep monitor for future investment.
Drawn support and resistance levels on chart for entry and exit reference

USDJPY: Your Trading Plan For This Week 🇺🇸🇯🇵
USDJPY is trading in a bullish trend.
After the price set a new higher high, we see quite an extended consolidation
within a horizontal range.
150.9 is the resistance of the range.
If the market breaks and closes above that on a daily,
we can anticipate a trend-following movement.
Next resistance will be 151.6
Alternatively, a bearish breakout of the support of the range
may trigger a bearish continuation.
❤️Please, support my work with like, thank you!❤️

Bitcoin is about to reach ATH zone! Are we gonna break it?We're now formalizing consolidation triangle which is mostly telling us about to continue of the trend, means that we're expecting to continue to grow. So by growing we're reaching the resistance of ATH, I think after that we are going for correction, or we're going for correction after breaking ATH.
You thoughts guys?
