BITCOIN (BTCUSD): Strong Bullish Confirmation?!
Bitcoin has a high chance to rise more, following
a strong bullish reaction to a rising trend line on a 4H.
Goal - 108000
❤️Please, support my work with like, thank you!❤️
Rectangle

USDJPY – Fed Meeting Ahead With Range Highs In FocusYesterday’s Bank of Japan meeting saw the central bank act as expected. They kept interest rates unchanged and slowed the pace at which they will decrease monthly JGB purchases by half to help ensure market stability. This eventually assisted USDJPY to push higher and touch a peak early this morning at 145.44, matching a monthly high set on June 11th (145.46).
So far, this move to June range highs has been met with fresh selling, but there is still a lot for FX traders to consider moving into the Friday close, including an escalating conflict in the Middle East that has seen Israel and Iran exchange fire for six days in a row, and more importantly for wider financial markets, has drawn the full attention of President Trump and his national security team. How this situation evolves across the remainder of this week could influence the direction of USDJPY.
Also important could be the outcome later this evening of the Federal Reserve (Fed) Interest Rate Decision (1900 BST) and Press Conference (1930 BST). No change to interest rates is expected as policymakers, including Chairman Powell have been clear that they are currently in wait and see mode before making their next move, however their updated projections for US inflation, growth, and rate cuts may provide some extra volatility for USDJPY prices if these deviate from market expectations.
We shouldn’t forget it is also a holiday in the US tomorrow so liquidity could be reduced, so assessing the technical outlook, including relevant support and resistance levels may be useful.
Technical Update: Balanced Range Extends into Fed Meeting
Little has changed in USDJPY price activity from a technical perspective following Tuesday’s Bank of Japan meeting, and the focus now shifts to Wednesday’s Fed meeting in the US as the next potential sentiment driver for price.
As the chart above shows, the latest USDJPY activity has been held within a sideways range marked by potential support at 142.11, the May 27th session low, and potential resistance at 146.29, the May 29th session high.
This latest price activity may be an indication of trader uncertainty as to the direction of the next move and possibly the need for prices to ‘breakout’ and establish where the next directional risks might lay.
Of course, nothing is guaranteed and a closing break above resistance or below support might not see a more sustained phase of price movement, however being prepared is important.
Let’s consider the potential levels traders might find useful to watch if a breakout from the current sideways range is seen.
Potential Resistance Levels:
Successful closing breaks above 146.29 might be viewed by some as opening scope to higher levels and may possibly lead to a more sustained phase of price strength.
It’s at this time that the focus for traders may shift to the next potential resistance which could be at 148.65, the May 12th session high, even 151.21, the March 28th peak.
Potential Support Levels:
Equally possible within the current more balanced sideways price activity, is that a closing break under support provided by the May 27th low at 142.11 might well develop and be viewed as a potential negative breakout from the current sideways price range.
If closes below support at 142.11 are seen over the coming sessions, it might reflect for moves to even lower levels in price, with traders potentially shifting their focus to the April 22nd low trade at 139.89 as the possible next support.
The material provided here has not been prepared
accordance with legal requirements designed to promote the independence of investment research and as such is considered to be a marketing communication. Whilst it is not subject to any prohibition on dealing ahead of the dissemination of investment research, we will not seek to take any advantage before providing it to our clients.
Pepperstone doesn’t represent that the material provided here is accurate, current or complete, and therefore shouldn’t be relied upon as such. The information, whether from a third party or not, isn’t to be considered as a recommendation; or an offer to buy or sell; or the solicitation of an offer to buy or sell any security, financial product or instrument; or to participate in any particular trading strategy. It does not take into account readers’ financial situation or investment objectives. We advise any readers of this content to seek their own advice. Without the approval of Pepperstone, reproduction or redistribution of this information isn’t permitted.

Ethereum Wave Analysis – 16 June 2025
- Ethereum moving inside sideways price range
- Likely to rise to the resistance level 2754.00
Ethereum cryptocurrency recently reversed up from the support zone between the support level 2435,00 (lower border of the active narrow sideways price range from May), lower daily Bollinger Band and the 38.2% Fibonacci correction of the upward impulse from May.
The upward reversal from this support zone continues the active minor impulse wave 3 of the intermediate impulse wave (3) from last month.
Ethereum can be expected to rise to the next resistance level 2754.00 (upper border of the active sideways price range).

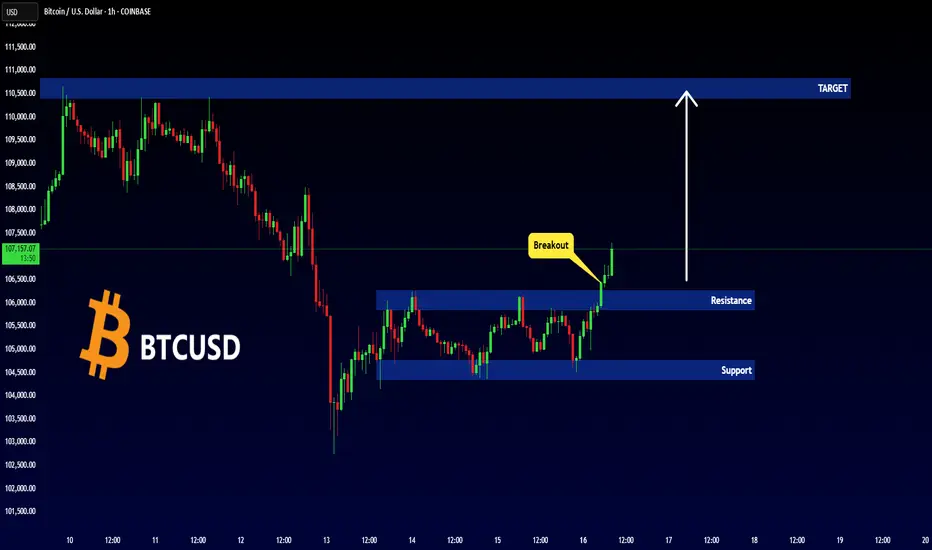
BITCOIN - Important Breakout !Hello Traders !
The Bitcoin price formed a rectangle pattern.
Currently, The resistance level is broken !
So, I expect a bullish move🚀
_____________
TARGET: 110400.00🎯
NEW ATH Quick flush down to 100K done, tbh was thinking it could drop to 90K but then again price action is king and I've got to go with the flow.
Not a confirmed breakout to all-time highs yet but will happen.
continuation of uptrend 🔒.
BITSTAMP:BTCUSD

Ethereum set for breakout? Watch this 27-day patternEthereum is forming a 27-day pattern that could trigger a major breakout. After last week's failed move in Bitcoin, Ethereum now sits at a critical level. A breakout above 2741 could signal the start of a big rally, especially if US deregulation news lands. Could this be the beginning of a big move? Watch the full analysis and share your thoughts in the comments.
This content is not directed to residents of the EU or UK. Any opinions, news, research, analyses, prices or other information contained on this website is provided as general market commentary and does not constitute investment advice. ThinkMarkets will not accept liability for any loss or damage including, without limitation, to any loss of profit which may arise directly or indirectly from use of or reliance on such information.

AUDJPY: Consolidation is Over!🇦🇺🇯🇵
AUDJPY is completed a consolidation, violating
a resistance of a horizontal range on a daily.
The price will most likely continue rising and reach 95.0 level soon.
❤️Please, support my work with like, thank you!❤️

SI1! - 7 months RECTANGLE══════════════════════════════
Since 2014, my markets approach is to spot
trading opportunities based solely on the
development of
CLASSICAL CHART PATTERNS
🤝Let’s learn and grow together 🤝
══════════════════════════════
Hello Traders ✌
After a careful consideration I came to the conclusion that:
- it is crucial to be quick in alerting you with all the opportunities I spot and often I don't post a good pattern because I don't have the opportunity to write down a proper didactical comment;
- since my parameters to identify a Classical Pattern and its scenario are very well defined, many of my comments were and would be redundant;
- the information that I think is important is very simple and can easily be understood just by looking at charts;
For these reasons and hoping to give you a better help, I decided to write comments only when something very specific or interesting shows up, otherwise all the information is shown on the chart.
Thank you all for your support
🔎🔎🔎 ALWAYS REMEMBER
"A pattern IS NOT a Pattern until the breakout is completed. Before that moment it is just a bunch of colorful candlesticks on a chart of your watchlist"
═════════════════════════════
⚠ DISCLAIMER ⚠
Breakout Area, Target, Levels, each line drawn on this chart and any other content represent just The Art Of Charting’s personal opinion and it is posted purely for educational purposes. Therefore it must not be taken as a direct or indirect investing recommendations or advices. Entry Point, Initial Stop Loss and Targets depend on your personal and unique Trading Plan Tactics and Money Management rules, Any action taken upon these information is at your own risk.
═════════════════════════════

NZDJPY: Move Up Ahead! 🇳🇿🇯🇵
There is a high chance that NZDJPY will continue rising.
I see a strong intraday bullish confirmation after a confirmed
breakout of a key daily horizontal resistance.
Next key resistance is 0.875
❤️Please, support my work with like, thank you!❤️
I am part of Trade Nation's Influencer program and receive a monthly fee for using their TradingView charts in my analysis.

USDJPY: Bullish Outlook For Next Week Explained 🇺🇸🇯🇵
USDJPY completed a consolidation, violating
a resistance line of a horizontal range on a 4H time frame.
I believe that it provides a strong bullish confirmation signal.
The price will most likely go up and reach 146.0 level next week.
❤️Please, support my work with like, thank you!❤️
I am part of Trade Nation's Influencer program and receive a monthly fee for using their TradingView charts in my analysis.

GOLD Ready to Explode? Breaking ATH Resistance – 3800 Next?!Gold is heating up! 🔥 Price just broke the daily resistance trendline and is now testing the top of the range 👀
📈 A confirmed breakout could send us flying to 3523, 3628, and even 3800+ USD!
💡 Watch for strong bullish momentum above ATH resistance.
📊 Targets marked – Risk/Reward is 🔥
💬 What’s your bias – breakout or fakeout? Drop your thoughts below!
#Gold #XAUUSD #Breakout #TradingView #PriceAction #SmartMoney #TrendlineBreak

PolkaDot (DOT) Structure Analysis (1D)BITGET:DOTUSDT is showing signs of strength after a deviation below the long-standing $3.70–$4.10 demand zone.
Key Levels
• 🟢 Demand Zone: $3.70–$4.10, respected since October 2023
• 🟡 Broken downtrend resistance, retested as support
• ⚪ Current falling channel (compression) following range high retest
• 🟥 Sell Order Block: $5.10–$5.40
• 🟧 Range Resistance: $5.40
• 🎯 Target on breakout: ~$7.00, potential extension to ~$7.50
Thesis
• The recent breakdown was quickly reclaimed, hinting at a possible spring/fakeout. After retesting the range high, price is now compressing within a descending channel, building energy just above demand.
• A breakout from the channel followed by an S/R flip of the $4.40–$4.60 region could trigger a rally toward the upper range.
Watching for
• Channel breakout with volume
• Clean break above $5.40 to confirm range expansion
Invalidation
• Sustained break below the $3.70–$4.10 demand zone

RITESRITES showing good strength in recent session. And currently trading near strong hurdle. It has a strong resistance near 310-15 levels and rejected many times earlier. So if now closing above 315 may start new momentum rally in the counter which may continue for next 20-22% upwards. On lower side 270 seems very good support But closing above 315 is very crucial. I would avoid before that but surely keep a closer watch on it.

Types of Engulfing Candles!In trading, an Engulfing candle (or Engulfing pattern) is a two-candle reversal pattern that can indicate a potential change in market direction. It is commonly used in technical analysis in both bullish and bearish contexts.
Types of Engulfing Candles
1. Bullish Engulfing Pattern:
Occurs during a downtrend.
The first candle is bearish (red or black), showing continued selling pressure.
The second candle is bullish (green or white) and completely engulfs the body of the first candle (its open is lower and close is higher).
This pattern signals a potential reversal to the upside.
2. Bearish Engulfing Pattern:
Occurs during an uptrend.
The first candle is bullish.
The second candle is bearish and completely engulfs the first candle's body (its open is higher and close is lower).
This pattern signals a potential reversal to the downside.
Key Characteristics
The second candle’s body must fully engulf the first candle’s body (wicks/tails are not necessary to engulf).
The stronger the engulfing candle (in terms of size and volume), the more significant the signal may be.
Often more reliable when confirmed with volume or used in conjunction with other technical indicators (e.g., RSI, support/resistance levels).
Example:
Bullish Engulfing Example:
Day 1: Bearish candle opens at $100 and closes at $95.
Day 2: Bullish candle opens at $94 and closes at $101 — it completely engulfs Day 1's body.
This would suggest a potential shift from sellers to buyers.

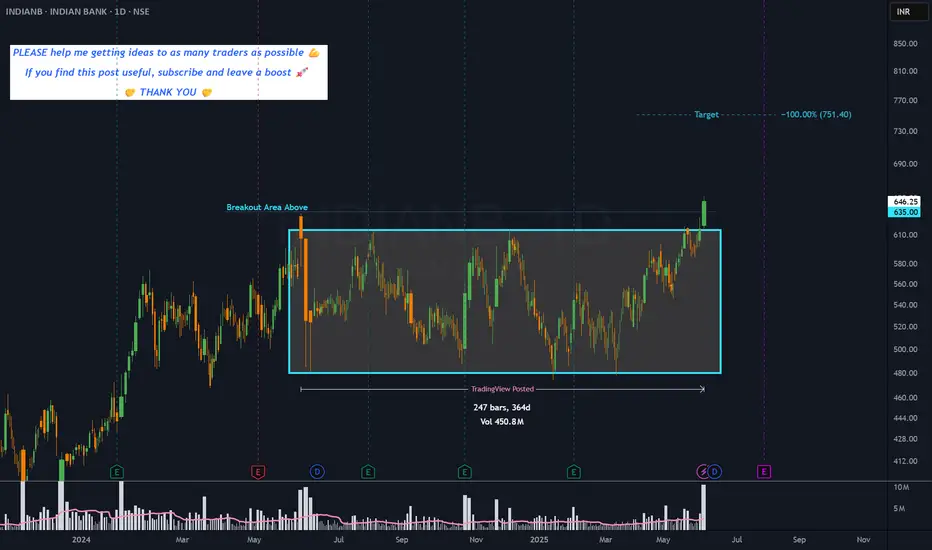
INDIANB - 1 year RECTANGLE══════════════════════════════
Since 2014, my markets approach is to spot
trading opportunities based solely on the
development of
CLASSICAL CHART PATTERNS
🤝Let’s learn and grow together 🤝
══════════════════════════════
Hello Traders ✌
After a careful consideration I came to the conclusion that:
- it is crucial to be quick in alerting you with all the opportunities I spot and often I don't post a good pattern because I don't have the opportunity to write down a proper didactical comment;
- since my parameters to identify a Classical Pattern and its scenario are very well defined, many of my comments were and would be redundant;
- the information that I think is important is very simple and can easily be understood just by looking at charts;
For these reasons and hoping to give you a better help, I decided to write comments only when something very specific or interesting shows up, otherwise all the information is shown on the chart.
Thank you all for your support
🔎🔎🔎 ALWAYS REMEMBER
"A pattern IS NOT a Pattern until the breakout is completed. Before that moment it is just a bunch of colorful candlesticks on a chart of your watchlist"
═════════════════════════════
⚠ DISCLAIMER ⚠
Breakout Area, Target, Levels, each line drawn on this chart and any other content represent just The Art Of Charting’s personal opinion and it is posted purely for educational purposes. Therefore it must not be taken as a direct or indirect investing recommendations or advices. Entry Point, Initial Stop Loss and Targets depend on your personal and unique Trading Plan Tactics and Money Management rules, Any action taken upon these information is at your own risk.
═════════════════════════════
Solana (SOL) Rectangle (4H)BINANCE:SOLUSDT appears to be forming a rectangle, clearly visible on the 4H chart.
Key Levels to Watch
• $160: Support
• $185: Resistance
Measured Targets
Activated, respectively, with a 4H close with good volume below support or above resistance.
• $135: Rectangle Short Target
• $210: Rectangle Long Target

TMGH's Current Peak ZoneTMG Holding trend has reached its peak zone at the resistance line 55.661. Historically, it is expected to rebound to the support line at 55.2, then the support line at 54.987 and 54.916. In conclusion, it increased by 0.09% due to TMGH signing a memorandum of understanding to develop a new large-scale mixed-use project on a 14 million sqm plot, as part of its regional expansion strategy focused on replicating its integrated city model in Middle Eastern markets, as per a disclosure, regarding negotiations with local Iraqi authorities, is expected to include approximately 46,000 mixed-use units. It will focus on high-quality housing, smart infrastructure, and sustainability.

EGX30 Increases by 0.62%EGX30 stock has jumped to an upper region, and it's apparent that this has been a gradual upward trend due to a mutual connection between positive fundamental news and the technical candlestick analysis. It has already breached the resistance line of 32,621.248 and reached the maximum at 32,695.736 points. On a personal level, I expect it to rebound not because of any negative news but because of taking into consideration the short-term history patterns. In case of rebounding, it may reach the support line 32,536.119, the support line 32,408.426, then the support line 32,376.503. In conclusion, EGX30 is increasing in the pink region by 0.62%.

Bitcoin Wave Analysis – 29 May 2025
- Bitcoin broke daily up channel
- Likely to fall to support level 105000.00
Bitcoin cryptocurrency recently broke the support trendline of the sharp daily up channel from the start of April intersecting with the 50% Fibonacci correction of the upward impulse from the middle of May.
The breakout of this up channel stopped the previous impulse wave 5 of the extended upward impulse wave (3) from April.
Bitcoin cryptocurrency can be expected to fall to the next support level 105,000.00, the breakout of which can lead to further losses toward 102150,00 (low of the previous minor correction 4).

Lam Research May Be Done ConsolidatingLam Research rallied sharply in late April and early May. Now, after a period of consolidation, some traders may expect a breakout.
The first pattern on today’s chart is the bullish price gap on May 12 after Treasury Secretary Scott Bessent lowered tariffs on China. LRCX spent the next two weeks in a range between $79.78 and $86.04, while holding above its March high. Did new support form above old resistance?
The maker of chip equipment established itself above the 200-day simple moving average (SMA) in the process. The 200-day SMA is also turning positive. Those signals may be consistent with longer-term bullishness.
Next, the 8-day exponential moving average (EMA) is above the 21-day EMA and MACD is rising. Those signals may be consistent with shorter-term bullishness.
Check out TradingView's The Leap competition sponsored by TradeStation.
TradeStation has, for decades, advanced the trading industry, providing access to stocks, options and futures. If you're born to trade, we could be for you. See our Overview for more.
Past performance, whether actual or indicated by historical tests of strategies, is no guarantee of future performance or success. There is a possibility that you may sustain a loss equal to or greater than your entire investment regardless of which asset class you trade (equities, options or futures); therefore, you should not invest or risk money that you cannot afford to lose. Online trading is not suitable for all investors. View the document titled Characteristics and Risks of Standardized Options at www.TradeStation.com . Before trading any asset class, customers must read the relevant risk disclosure statements on www.TradeStation.com . System access and trade placement and execution may be delayed or fail due to market volatility and volume, quote delays, system and software errors, Internet traffic, outages and other factors.
Securities and futures trading is offered to self-directed customers by TradeStation Securities, Inc., a broker-dealer registered with the Securities and Exchange Commission and a futures commission merchant licensed with the Commodity Futures Trading Commission). TradeStation Securities is a member of the Financial Industry Regulatory Authority, the National Futures Association, and a number of exchanges.
TradeStation Securities, Inc. and TradeStation Technologies, Inc. are each wholly owned subsidiaries of TradeStation Group, Inc., both operating, and providing products and services, under the TradeStation brand and trademark. When applying for, or purchasing, accounts, subscriptions, products and services, it is important that you know which company you will be dealing with. Visit www.TradeStation.com for further important information explaining what this means.

EURJPY: Move Up Ahead! 🇪🇺🇯🇵
EURJPY is going to rise more after breaking
a resistance line of a tiny horizontal consolidation range
that was formed on a retest of a recently broken daily structure.
Goal - 164.8
❤️Please, support my work with like, thank you!❤️
I am part of Trade Nation's Influencer program and receive a monthly fee for using their TradingView charts in my analysis.

Silver Wave Analysis – 28 May 2025
- Silver reversed from resistance level 33.70
- Likely to fall to support level 31.70
Silver recently reversed from the resistance level 33.70 (which is the upper border of the sideways price range inside which the price has been trading from April).
The resistance area near the resistance level 33.70 was strengthened by the upper daily Bollinger Band.
Silver can be expected to fall to the next support level 31.70 (lower border of the active sideways price, which reversed the previous waves a and 2).

Cardano (ADA) Rectangle + Internal Uptrend (1D)BINANCE:ADAUSDT has spent months ranging between ~$0.51 and ~$1.15, and the structure now clearly qualifies as a rectangle pattern.
After a 3rd touch on support in April, Cardano is showing strength with steady higher lows and a reclaim of a key High Volume Node (HVN).
Key Levels to Watch
• Main Demand: ~$0.51-$0.58
• Rectangle Support: ~$0.51
• Rectangle Resistance: ~$1.15
• Internal Uptrend Support: Rising diagonal from April
• HVN Zone: ~$0.75 — key volume cluster
• Rectangle Midline: ~$0.83 — also a previous S/R
• Main Supply: $1.10–$1.32
Measured Target
If price breaks above $1.15 with volume, the rectangle measured move points to ~$1.80.
Context
ADA has respected this range for nearly half a year. A breakout could mark the start of a macro bullish leg.
Triggers
• Bullish: Clean daily close above $1.15 with volume → $1.80 target activated. For a safer entry, it could be worth waiting a full breakout from the main supply above $1.32.
• Bearish: Breakdown of the ascending trendline and HVN → Potential return to ~$0.51. Failure to hold that level could lead to further downside to the previous ~$0.30 demand zone.
