REDUSDT Forming Falling WedgeREDUSDT is attracting fresh eyes in the crypto community as this pair sets up for what could be a remarkable bullish move. The recent chart shows price action consolidating within a falling channel, hinting at a potential breakout scenario if the resistance trendline is successfully breached. With a strong volume profile backing this setup, REDUSDT is showing signs of healthy accumulation, suggesting that market participants are quietly building positions in anticipation of a trend reversal.
Many crypto traders are now closely watching REDUSDT because of its high-risk, high-reward potential, with an expected gain of 90% to 100%+. If the breakout confirms, the upside move could be sharp and decisive, driven by both technical momentum and fresh investor sentiment. This aligns with broader market conditions where investors are increasingly hunting for altcoins that can deliver outsized returns in a short period.
What makes REDUSDT even more compelling is the growing interest among investors in the underlying project and its ecosystem. A surge in community engagement and positive developments could serve as fundamental catalysts to sustain this projected bullish momentum. For traders, this setup could present a unique opportunity to catch an early trend before it gains mainstream attention.
✅ Show your support by hitting the like button and
✅ Leaving a comment below! (What is You opinion about this Coin)
Your feedback and engagement keep me inspired to share more insightful market analysis with you!
RED

RED looks bearish (4H)From the point where we placed the red arrow on the chart, the RED correction has begun.
It seems to be inside an ABC structure, and we are currently in wave C, which is bearish.
A demand zone is visible on the chart, which could temporarily reject the price upward.
Since wave B did not retrace more than 0.618 of wave A, it is expected that the low of wave A will be taken out.
For risk management, please don't forget stop loss and capital management
Comment if you have any questions
Thank You

RED New Update (4H)This analysis is an update of the analysis you see in the "Related publications" section
The previous analysis scenario has expired, and this update's scenario is valid.
Given the time correction of recent waves and the absence of sharp drops, this scenario for RED is valid, and buyers' footprints can be seen on the chart.
We expect a strong rejection to the upside from the green zone.
From the point where we placed the red arrow on the chart, it seems that RED's correction has started, which appears to be either a diametric or a triangle.
Wave C itself has formed a diametric, and it is expected to end in the green zone, leading to a bullish wave D.
The closure of a daily candle below the invalidation level will invalidate this analysis.
For risk management, please don't forget stop loss and capital management
When we reach the first target, save some profit and then change the stop to entry
Comment if you have any questions
Thank You

RED buy/long setup (4H)It is one of the new symbols with a bullish chart.
A bullish CH is present on the chart. A supply zone has been cleared. A strong demand zone is located at the bottom.
We are looking for buy/long positions in the demand zone.
Targets are marked on the chart.
A daily candle close below the invalidation level will invalidate this analysis
Do not enter the position without capital management and stop setting
Comment if you have any questions
thank you

REDUSDT - It gives you money!Its not redbull is redusdt, Plan your shorts well before buying, Rather wait for the shorts from the points mentioned

redTo reach higher prices, the red box must be broken. We have a support area in the green box, if the price cannot be supported in this area, it can be led to the blue box and the process to break the red box will be difficult and tiring.

RED in Consolidation: Is a Breakout Around the Corner...?🚨 Current Market Update on RED 🚨
RED is currently consolidating between key levels:
💥 Resistance: 0.5925
💥 Support: 0.5670
We have two possible scenarios unfolding:
1️⃣ Bullish Breakout: If RED breaks through the resistance at 0.5925 and closes above it on the hourly chart, look for a potential long entry on the retest.
2️⃣ Bearish Breakdown: If RED breaks below 0.5670, we could see a sharp decline toward the next major support at 0.4000.
It's best to sit tight and enjoy your coffee ☕️ while we wait for a clear signal. 📊

BTC/USDT RED LOW TIME FRAMEThis is a low time frame update which shows that BTC has the chance to have a correction in the coming time frame, the weekend trend.
We will follow the trend and see if these red signals are confirmed in the coming time frame.
We followed the BTC before, from a 54K to 62K trend. as this below update shows
About the side where BTC is going, we can't know, since we only follow data.
we never hope for a trend where BTC can go since we always check all 2 sides and where data shows a high chance.
our statics show that we are the best of all coins with data in BTC long term.
Knowing this is BTC there can be always manipulation in trends that can make fake liquidity before it will enter the real liquidity, we have seen before at 56650 before increasing to 62K, in a different way can always happen. make always plan..
data shows there is a chance that 70% BTC will make first a correction

LONG Bitcoin during RED days always!Morning lads,
Figured I'd share my view on BTC for the following weeks.
There's a chance that instead of a channel, its a descending triangle on the daily, bringing prices to 50k.
But Im gonna keep that in mind and hope we move up!
This trade would help alts tremendously as well..
Trade thirsty, my friends..

RED! Long RED!Evening fellas,
This chart to me looks like one of the best.
I think its a cup and handle formation building-up.
Keep an eye on it.
Trade thirsty.

TOTAL -- red strong short arrowstrong short showing over the top of the week view of total crypto similar to Cryptex finance's TCAP. This is a new week and brand new candle signal.

#RED/USDT
#RED
The price has been moving in a descending triangle since July 2022
Moving average 100 was broken to the upside
We are about to continue going up
Current price 2.05
First goal 2.14
Second goal 2.41
Third HDQ 2.77

USDJPY- STILL DOWN LIKE WE PREVIOUS ANALIZED
The USD/JPY currency pair has seen significant movements recently, with several factors influencing its expected performance next week:
Current Position and Recent Movements: As of December 14, 2023, USD/JPY stood at 141.986, indicating a decrease of 2.28%. The currency hit a high of 145.995 and a low of 141.832 during this period. Over a broader 52-week range, the pair fluctuated between 127.221 and 151.924, with a year-to-date change of 8.29% and a one-year change of 4.73%.
Influence of Bank of Japan's Policies: Recently, signals from the Bank of Japan about an imminent shift towards a more accommodative monetary policy have strongly influenced the Japanese yen's strengthening against other major currencies, particularly against the dollar. This caused the USD/JPY pair to fall to the support level of 141.63 before recovering. Therefore, the future of the pair largely depends on the central banks' policies, especially from Japan, where markets have long awaited a shift in negative interest policy.
Expectations from the U.S. Central Bank: This week, the focus will be on the U.S. Central Bank's policy announcement, with strong expectations to maintain U.S. interest rates, but there will be attention on the bank's policy statement and expectations report. Monitoring of new expectations for U.S. interest rate levels at the Federal Reserve is ongoing.
Technical Analysis: Technically, the USD/JPY has formed lower highs connected to a trend line that has held since mid-November. It appears ready to test this resistance level again. The Fibonacci retracement tool indicates levels where sellers may be waiting to jump on the downtrend. The 61.8% Fibonacci level nearest to the trend line is around the key psychological mark of 146.00, which might be sufficient to keep gains in check. Hence, the USD/JPY may resume its decline to its lowest level at 141.62. However, a breakout above the Fibonacci levels and trend line could trigger a reversal to the upside. Additionally, technical indicators suggest a continuation of the downward trend, with the 100 SMA below the 200 SMA, confirming a shift downward in the trend or that a sell-off is more likely to gain momentum rather than reverse.
In summary, the future performance of USD/JPY will depend on key factors including the central banks' policies of Japan and the United States, as well as technical signals that currently indicate a potential continuation of the downward trend. The chart reflects this with the price recently testing a key support level and showing a potential for continuation of the downward trend as indicated by the trend lines and recent price action.
A video of my trade made it yesterday at USDJPY
drive.google.com
Like i analyzed before go look my past analysis:
drive.google.com

RED TOKEN BULLISH IN THE NEXT BULLRUNRed looks so 🔥 so bullish is just manner of time, this token lost 90.40 % since mid April, and many indicators sound bullish 💯 and can make 100X easily in the next bullrun, however it should start making 100X with at the beginning of the bullrun because it lost a lot just recently within short amount of time ⏲️
💥Not a financial advice.


Possibility of regrowth RED TOKEN [high risk]According to the chart, we have the possibility of a new growth for this project, the time analysis period was approximately 70 to 75 candle drops in the previous round, and then we had a pump.
We expect the same thing to happen again this time, although there has been a sharp drop

I have to hand it to $RED, even charts are as stated color...Welcome to low cap ventures! It's not my name but it is what you are looking for....
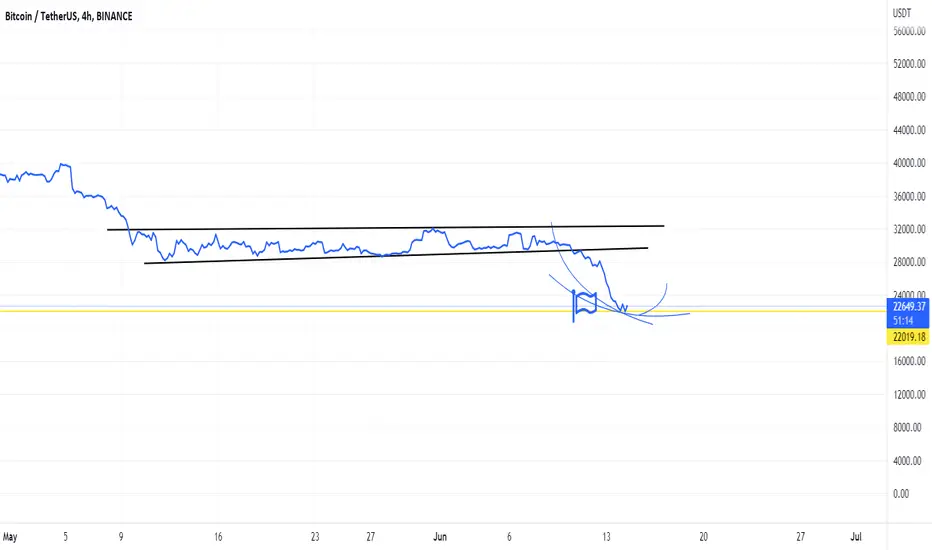
We have a clear rejection at may the 7th. So first resistance is a descendant resistance line which was the sub line of a bullish flag...
The bullish flag is broken down cause of Bangkok expansion news (buy the rumor sell the news club), but it has gone far from expected and panic sell has happened. Although it is not a meme coin, people tend to recognize low caps as shit/memecoins. Redpepe also stole some stage from this I guess, RED Token doesn'T have a sustainable social media management, so market cap is leaking towards non-sense coins...
The tiniest triangle shown in the chart (the bottom end) will hopefully trigger some buying instinct which I am anticipating an upward reaction between 0.000088 - approx 0.000070.
I am also anticipating a short summer rush.
Key horizontal resistances are 0.00046 and 0.00075...
This coin is for esports and entertainment, it has some promises but 100 billions coins is too much, they need to burn some on the way...
Those are merely an amateur and humble approache from my perspective. Don't you dare to receive those ideas as investment advices.
NOT INVESTMENT ADVICE AT ALL!

CD Projket Red to 1500 dollarsIf there is one place i will be putting a chunk of my portfilo in studio right here.
For anyone that doesn't know this studio created video games based on the witcher series and also developed cyberpunk 2077 that released in 2020 when the stock was at all time high at 458 dollars.
To think this stock is 80% down is mad , CD projket red have began a partnership with epic games and the Witcher 4 is already in production on the new unreal 5 engine ,this one is a no brainer.

SPX500 - Possible short opportunity for beginning of week 12/12.Hello World,
I still believe Santa & and his helper (J. Powell) can bring us more pain before the year ends.
With that said, I will be waiting for price to pullback into my ideal entry zone (yellow box).
If bearish entry confirmation is present on LTF, shorts will be activated.
Goodluck to you all.

Red everywhere. 12k-11k is the floor.The pain continues, 12k will be the bounce to look at. Consolidation will take place before any legitimate turns towards the moon.

BITCOIN///WARNING///WEEKLY SIGNAL Hello.
For first time Bitcoin is trying to brake the WEEKLY 200MA, and to turn it to resistance.
This is huge weekly signal.
Don`t trust your friends, don`t trust youtubers... Read the chart - 1 week candles + 200MA.
Perfect time for DCA.
Confirmation for down trend continuation from November it will be when we brake below 17 500. Till than we are in range 18K-25K.
Good Luck!

BTC/USDThis is both indicative of recent probe action and also an artistic expression of basically all you need to know about crypto.

IS THIS THE START POINT FOR BTC TO INCREASE?It's not only BTC that did break down last time, but more markets - think of stock markets and most of the projects that did get into a bull trend in 2021.
It's hard to predict the start of a new increase into a market that is fully red - but 20K is known from history as an important level - today we had hit around that area 20800 - will this be the point for return BTC - times will show us more.
At last, it's important to check this point or whether it holds this level - if BTC holds this level, then this could be a new entry point.
Further know markets are very risky, also below 20K could bring BTC back to old levels.
This view means more that this could be a point.. with time we will get confirmed.
trading markets at this moment could be risky with no plan.
The above text is not advice.