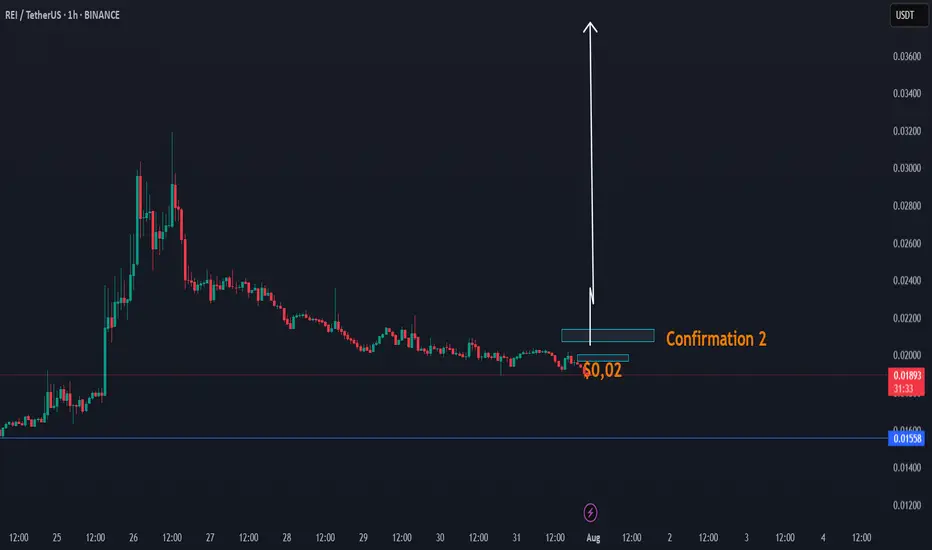
DAY UPDATE REI/USDT THE INCREASE CANDLE OF UP $0,03 - $0,05REI is an interesting coin since the update of Q4
We have seen that this coin was able to increase to $0,031 and until here $0,018 zone, a return to where we are now. There is a high chance that this coin can recover next 24H if this coin is able to confirm the confirmation $0,02 - $0,021
This coin, as before, was targeted at $ 0.02 and had low volume. We expect that if it comes back to $ 0.02, it will be confirmation of the volume, which can take the trend with a candle to up $0,03
REI CONFIRMATIONS ZONE
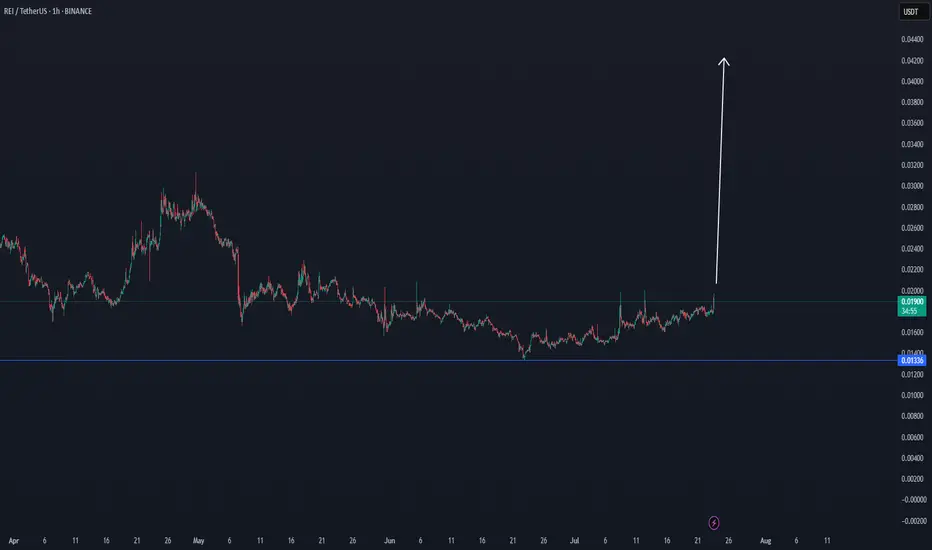
Higher time frame
When you look normally at this coin, then this coin is in a trend line of breakdown. This can change with the next confirmations. The question is, are we going to see again $0,02 the next 24h? If yes high chance of a break.
We also have a cycle update 2025, check it here, expecting $0,90
REI
REI/USDT CYCLE UPDATE $0,90 by 2025 - Price prediction📈 REI/USDT CYCLE UPDATE – $0.90 by 2025
REI could break above its old ATH, targeting $0.90 in the upcoming cycle. Why?
Upcoming
✅ Ultra-fast blockchain (⏱️ 1.5s block time)
✅ Gas-free or near-zero fees – perfect for DeFi, NFTs & gaming
✅ EVM-compatible – easy migration for Ethereum dApps
✅ Low market cap → high upside potential
✅ Clean tokenomics with staking + resource model
✅ Built for speed, scale & adoption
DATA
Data shows that there is a structural trend going on, where this coin can break soon.
If the altcoin market heats up, REI has the fundamentals & tech edge to explode past previous highs. 🚀
🧠 Watch this one closely.
#REINetwork #Crypto #Altseason #EVM #PricePrediction #Web3
This is not trading advice, but a view from a side of study.

REI/USDT THE NEXT WHALE INCREASE COIN $0,04 TargetREI/USDT THE NEXT WHALE INCREASE COIN
This coin seems to have a powerful DCA effect, which can be confirmed in the coming time frames with a break.
When there is interest, and new confirmations, here below the update.
entering this coin only when there are more confirmations
The first confirmation is to get first out of this box
REIUSDT | Potential Support Zones Marked by Blue BoxesREIUSDT has been on my radar due to the volume and orderflow strength it’s shown recently. The blue boxes on the chart highlight areas where buyers have historically stepped in, making them prime zones to watch for a rebound.
Why These Levels Matter
• Blue boxes represent previous demand zones where price paused its decline and reversed.
• When price returns to these areas, the odds of a meaningful reaction increase significantly.
How to Play It
Wait for price to dip into a blue box
Look for a clean higher‑low on a lower timeframe (5‑ to 15‑minute chart)
Confirm with CDV divergence or an uptick in buying volume
Enter a long position only after these confirmations appear
Stay Flexible
I will not insist on any bullish view if price breaks below these zones without giving a proper low‑timeframe breakout back above. If instead we see a decisive break above with volume and a retest, I’ll switch bias and look for shorts at the next resistance.
These support levels aren’t random—they’re based on real market behavior. Let price prove itself first then act with confidence rather than chasing every move.
📌I keep my charts clean and simple because I believe clarity leads to better decisions.
📌My approach is built on years of experience and a solid track record. I don’t claim to know it all but I’m confident in my ability to spot high-probability setups.
📌If you would like to learn how to use the heatmap, cumulative volume delta and volume footprint techniques that I use below to determine very accurate demand regions, you can send me a private message. I help anyone who wants it completely free of charge.
🔑I have a long list of my proven technique below:
🎯 ZENUSDT.P: Patience & Profitability | %230 Reaction from the Sniper Entry
🐶 DOGEUSDT.P: Next Move
🎨 RENDERUSDT.P: Opportunity of the Month
💎 ETHUSDT.P: Where to Retrace
🟢 BNBUSDT.P: Potential Surge
📊 BTC Dominance: Reaction Zone
🌊 WAVESUSDT.P: Demand Zone Potential
🟣 UNIUSDT.P: Long-Term Trade
🔵 XRPUSDT.P: Entry Zones
🔗 LINKUSDT.P: Follow The River
📈 BTCUSDT.P: Two Key Demand Zones
🟩 POLUSDT: Bullish Momentum
🌟 PENDLEUSDT.P: Where Opportunity Meets Precision
🔥 BTCUSDT.P: Liquidation of Highly Leveraged Longs
🌊 SOLUSDT.P: SOL's Dip - Your Opportunity
🐸 1000PEPEUSDT.P: Prime Bounce Zone Unlocked
🚀 ETHUSDT.P: Set to Explode - Don't Miss This Game Changer
🤖 IQUSDT: Smart Plan
⚡️ PONDUSDT: A Trade Not Taken Is Better Than a Losing One
💼 STMXUSDT: 2 Buying Areas
🐢 TURBOUSDT: Buy Zones and Buyer Presence
🌍 ICPUSDT.P: Massive Upside Potential | Check the Trade Update For Seeing Results
🟠 IDEXUSDT: Spot Buy Area | %26 Profit if You Trade with MSB
📌 USUALUSDT: Buyers Are Active + %70 Profit in Total
🌟 FORTHUSDT: Sniper Entry +%26 Reaction
🐳 QKCUSDT: Sniper Entry +%57 Reaction
📊 BTC.D: Retest of Key Area Highly Likely
📊 XNOUSDT %80 Reaction with a Simple Blue Box!
📊 BELUSDT Amazing %120 Reaction!
📊 Simple Red Box, Extraordinary Results
I stopped adding to the list because it's kinda tiring to add 5-10 charts in every move but you can check my profile and see that it goes on..

REI Buy/Long Setup (1D)REI has hit a very significant support zone.
It is expected that the buy orders entering this symbol will be sufficient to create a bullish swing wave.
As long as the demand zone holds, the price can move toward the targets.
targets: 0.02482 _ 0.02948 _ 0.03402
A daily candle closing below the invalidation level would invalidate this analysis.
Do not enter the position without capital management and stop setting
Comment if you have any questions
thank you

Will REI Network (#REI) Hold Its Ground or Take a Plunge?Yello, Paradisers! Have you been keeping an eye on REINetwork (#REI)? Our latest analysis suggests a critical moment is approaching. Let’s dive into the details.
💎#REIUSDT has been trading within a falling wedge pattern on the 1D timeframe. We've previously observed a failed breakout, which reinforces a bearish bias. Currently, #REINetwork is retesting the falling wedge's lower support level, and there is a possibility that it might drop further.
💎The diminishing trading volume and the POC of VRVP acting as resistance increase the chances of a further drop. If #REI fails to hold the support at the falling wedge's lower boundary, it's likely to retest the Bullish Order Block (OB) around $0.447.
💎However, if AMEX:REI fails to hold at $0.447, the next support level to watch is at $0.325. This area is packed with liquidity and can create a good chance of a pullback if tested.
💎On the contrary, if the falling wedge's lower support level holds well, we could see the bulls taking control, leading to a bullish rally. The overall market sentiment and Bitcoin's movement will significantly influence #REI's price action, so keep a close eye on these factors.
Stay focused, patient, and disciplined, Paradisers.
MyCryptoParadise
iFeel the success🌴

REI / REIUSDTGood Luck >>
• Warning •
Any deal I share does not mean that I am forcing you to enter into it, you enter in with your full risk, because I'll not gain any profits with you in the end.
The risk management of the position must comply with the stop loss.
(I am not sharing financial or investment advice, you should do your own research for your money.)

New exit pumpWith most delistings, we have already observed the exit of the pump up to a significant overshoot of the level at which the news about delisting was released. Today I filled positions on the exit pump for drep and pnt. A pump is possible on the reversal of the current weekly candle, which will turn into a pullback on the monthly candle. In a less optimistic scenario, the rollback attempt will already be in a new monthly candle. The likely targets are retests of 0.250-275 for drep and 0.15-75 for pnt, which can bring up to 200%+. The drep team announced the burning of a significant part of the tokens, which is an additional reason for the pump.

#REI may move upGood structure, increasing volume and korean interest. #reinetwork
NOT FINANCIAL ADVICE.


Bullish on REIDYOR
Rei network is a EVM compatible public blockchain.
Still too early but
I’M BULLISH ON REI

REI Network Trades Above EMA100 (88.8% Target)REI Network (REIBTC) trades above EMA100 for the first time in over a month, showing upside potential.
Notice the 23-June and 7-July candles... High volume with a very strong RSI.
We also have the "same pattern" and that is a low 12-May followed by a higher low and then a strong bullish breakout.
Keep in mind that the big capitalization altcoins are doing low followed by lower low but the end result is still the same.
After the mid-June lower/higher low comes a bullish breakout...
Just like TVK and LOOM we saw just now (see Related ideas below) as well as dozens of other pair in the small cap. size block.
Namaste.

Ring Energy, Inc. (REI) bullish momentumWith the energy sector booming i`ve drawn a continuation candle pattern to what i consider to be REI`s price target, the $4.11 resistance.
Looking forward to read your opinion about it.

REI - Ring Energy, Inc - Looking to do Moonshots very soonTA on REI. This ticker is primed for massive upwards price movement. This is based off just the TA alone, and nothing else. It's respecting MAs as support and resistance. It also just hit it's reversal in November '20, from a long multi-year downtrend. It recently rejected at a historical resistance point and curling up to retest again. RSI is showing bullish sentiment, which is confirmed through price movement on the Daily and Weekly timeframes. I personally will be looking to play December call options on this one, to maximize return. I'm neither an investment or financial advisor, but this is how I'm going to approach this one. I hope to see some good returns for you all on this one. Happy Trading.

Long | REI | Swing TradeAMEX:REI
Possible Scenario: LONG
Evidence: Price Action
This is my idea and could be wrong 100%
* I feel this has too much potential, be cautious it has a gap 2 days ago. I put 30% of my money in it.


$BTC daily exhaustion point$BTC is showing signs of weakness today:
- Rising wedge breakdown
- RSI Oscillator divergence
- REI Oscillator Weakness
- Sequential 13 Exhaustion point
Positive signs:
Elliott Wave indicator is showing we are likely in a Wave 4 Consolidation before another leg up.
The first area of support is between 10.600 and 11.000USD which is the most likely one for a Wave 4.
It could also coincide with a RSI pullback to the 40-50% zone helping the indicator to cool down.
A stronger correction is also possible but would turn BTC in a negative bias if RSI also turns negative.
A Daily Close below 9.200 USD would mean a Bearish scenario.
Best!
MATHR3E

REI REIT index is identical to 2008, impending drop comingIf you take a look at the behaviour of the REI index before, during, and after the 2008 recession and present day. The REIT is in blue, the S&P500 is in red.
Before
REI index is outpacing the S&P500
During
REI index is converging with the S&P500
the indices both fell together with the REI falling more aggressively
After
REI index recovers quicker and begins to outpace the S&P500 again
We are in the during phase.

TSX: REI-UN LongThe goal of this trade is to catch a bounce from support around $26.40 with a stop loss just below support at $26.00
Aiming for a 1:2 risk reward ratio, but will likely take profit around $27.00 for just over a 1:1 risk reward ratio.
