USDJPY - Now or Never!Hello TradingView Family / Fellow Traders. This is Richard, also known as theSignalyst.
📈USDJPY has been overall bullish trading within the rising channel marked in blue and it is currently retesting the upper bound of the channel acting as an over-bought zone.
Moreover, the green zone is a strong weekly resistance.
📚 As per my trading style:
As #USDJPY is around the red circle zone, I will be looking for bearish reversal setups (like a double top pattern, trendline break , and so on...)
📚 Always follow your trading plan regarding entry, risk management, and trade management.
Good luck!
All Strategies Are Good; If Managed Properly!
~Rich
Disclosure: I am part of Trade Nation's Influencer program and receive a monthly fee for using their TradingView charts in my analysis.
Rejection

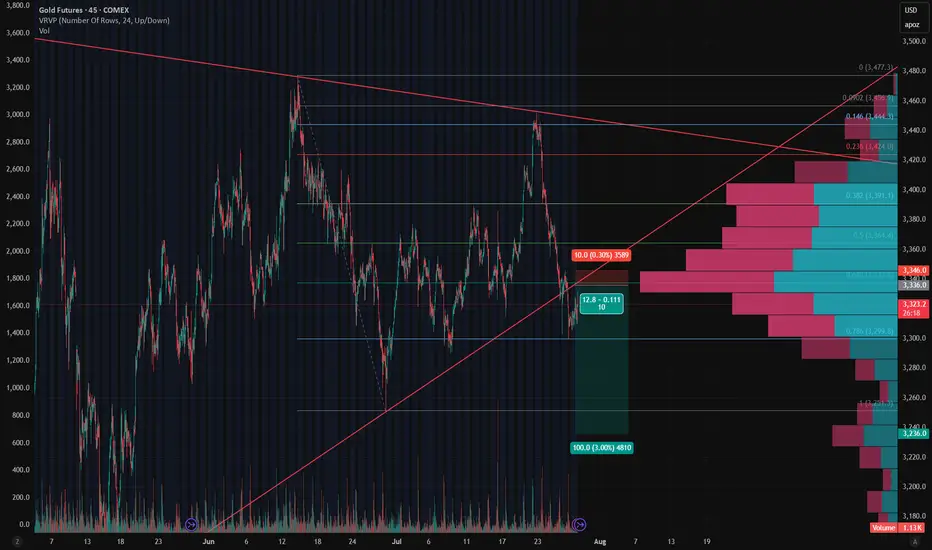
Gold - Short Setup Off Major Trendline Rejection📉 Gold - Short Setup Off Major Trendline Rejection
Gold has broken down through the rising trendline and is now retesting it — the moment of truth! 🧐
🔻 Short Entry: 3,336
🎯 Target: 3,236 (Fib 1.0 + HVN gap fill)
🛑 Stop: 3,346 (Above trendline retest)
⚖️ Risk/Reward: ~1:10
📊 Bonus: High volume node above adds resistance. Bearish volume profile structure confirms the breakdown bias.
Watching for volume to pick up on the move down. Let's see if GC bleeds into August. 🩸📆
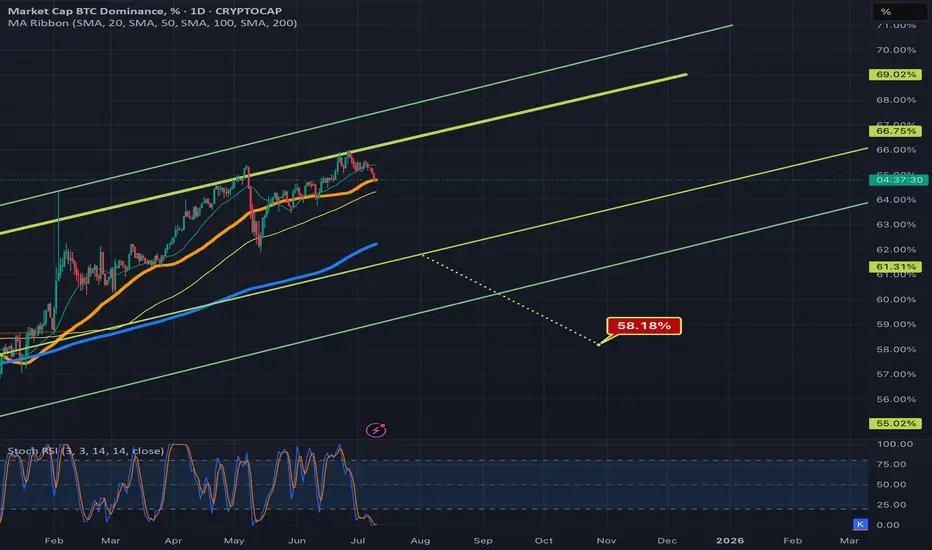
Bitcoin dominance chart ready to dump?Bitcoin dominance aka the btc.d chart has been in these 2 rising channels now for a long long tie, after ust recently being rejected down fro the top trendline of the neon yellow channel, there seems to be an opportunity here for it to potentially head down to retest the bottom trendline of that channel as well. If this occurs this could lead to an altcoin season. Price is right now combating the 50ma(in orange) and trying to maintain it as support. If this moving average flips to solidified resistance that greatly increases the chances of price going down to retest that bottom yellow trendline. Being that both of these channels are rising channels probability favors price action eventually breaking down from them instead of up so I have arbitrarily placed the measure move break down target of the yellow channel in a random spot below roughly where price could break down from the channel were it to be rejected strongly enough here by the 50ma. It’s retested this bottom trendline multiple times in the past and has always found away to avoid the breakdown thus far though so a breakdown there is definitely not guaranteed if it does retest the trendline, but even heading back down to retest the trendline in the first place may provide enough momentum for an alt season *not financial advice*
XAUUSD 4H – Full Technical & Fundamental Deep Dive🔷 Chart Structure & Trendlines
Since early June, gold has formed a clean descending channel on the 4‑hour chart. Each bounce and rejection has respected these channel edges, which reflect consistent lower highs and lower lows.
A long-term ascending trendline (from late March lows) was recently broken. This broken support has now flipped into resistance, and price is currently retesting it.
The intersection of the descending channel’s top, the trendline resistance, and the 200 EMA creates a major triple-confluence zone—a classic area of institutional interest.
🔷200 EMA
The 200 EMA on the 4H chart is acting as dynamic overhead resistance, which price is currently testing.
Historically, during bearish regime, retests of the 200 EMA from below often trigger strong rejections.
If price breaks above and holds, it would mark a significant shift in market sentiment. If rejected, it adds weight to the bearish trend.
🔷Fair Value Gap (FVG) & Supply Order Blocks
A Fair Value Gap (vicinity of $3,340–3,350) remains structurally unfilled from the previous breakdown.
Price is now re-entering that FVG region—an area often used by smart money to target liquidity and trap retail traders.
This is a logical zone for sell orders, as price frequently reacts where gaps exist.
🔷Volume Profile: High/Low Volume Nodes
A High-Volume Node (HVN) sits around $3,360, where most sustained trading has occurred. This acts as a strong resistance/distribution area.
The current zone ($3,330–3,340) is a low-volume pocket, meaning moves through here can be fast, but rejections are still frequently seen.
Below, there's another HVN around $3,280–3,290—a logical demand area and intermediate target for retracement.
🔷Fundamental Perspective – This Week to Friday
🔸 U.S. Fed Outlook & Dollar Dynamics
U.S. dollar is weak, with growing speculation on imminent Fed rate cuts, partly due to pressure from political sources
Fed remains cautious—no July cut likely, more probable in September
Persistent volatility in Fed messaging means gold remains in play as a hedge.
🔸 Geopolitical & Macro Drivers
Geopolitical tensions (Middle East, trade) continue to add safe-haven support
Central banks, especially Australia, are upping gold purchases—may add structural support
🔸 Market Sentiment & Investment Flows
ETF inflows remain robust—global central bank demand offsetting retail weakness
Some macro research houses expect sideways action into early July, with range likely between $3,200–3,350
🔸 Risks Ahead of Friday
Watch for U.S. jobs data, Fed speakers, and geopolitical headlines—any surprise could spark sharp moves.
If Fed hints at delays in rate cuts or geopolitical risk cools, gold could see a rapid reactive drop.
🔷🤔 Possible Scenarios into Friday
✅ Bearish Rejection
Price fails to clear $3,340–$3,360 zone.
A strong rejection candle retests $3,280–$3,290.
Could accelerate down to $3,240 if momentum picks up.
⚠️ Bullish Breakout
Clean, high-volume break above 200 EMA and $3,360 HVN.
Likely continuation to $3,380–3,400, especially if supported by fundamentals (e.g., inflation, Fed dovish pivot).
🔷My Personal Bias into Friday
Slight bearish lean due to triple resistance confluence.
Fundamentals are mixed: Fed caution supports gold structurally but no immediate catalyst.
I will monitor price action closely: a sharp rejection off the 200 EMA area would confirm suspicion; but a clean breakout would require reassessment.

USDCHF - Bearish => Bullish => Now Bearish?Hello TradingView Family / Fellow Traders. This is Richard, also known as theSignalyst.
📈USDCHF has been overall bearish trading within the falling channel marked in orange. And it is currently retesting the upper bound of the channel.
Moreover, the green zone is a strong resistance.
🏹 Thus, the highlighted red circle is a strong area to look for sell setups as it is the intersection of the upper orange trendline and resistance.
📚 As per my trading style:
As #USDCHF approaches the red circle zone, I will be looking for bearish reversal setups (like a double top pattern, trendline break , and so on...)
📚 Always follow your trading plan regarding entry, risk management, and trade management.
Good luck!
All Strategies Are Good; If Managed Properly!
~Rich
Disclosure: I am part of Trade Nation's Influencer program and receive a monthly fee for using their TradingView charts in my analysis.

$NVDA 6/27 exp week; $150 calls. Quick ChartHello. Market is moving up off the “news” of “ceasefire” from Trump. Take what is given I suppose. NASDAQ:NVDA could see a beautiful upside towards the psych level of $150 in just one session (Tuesday, 6/24) which is just a “small” move of 3%. Could break out of its rising wedge. This name has been lackluster as of late (kinda sorta). $150 calls will be entered at open (6/24) and my first target will be $148.98. There are multiple rejections at these levels. Good luck!
WSL

EURJPY - Over-Bought Big Time!Hello TradingView Family / Fellow Traders. This is Richard, also known as theSignalyst.
📈EURJPY has been overall bullish trading within the rising channel marked in blue. However, it is currently retesting the upper bound of the channel.
Moreover, the green zone is a major weekly supply.
🏹 Thus, the highlighted red circle is a strong area to look for sell setups as it is the intersection of the upper blue trendline and weekly supply.
📚 As per my trading style:
As #EURJPY approaches the red circle zone, I will be looking for bearish reversal setups (like a double top pattern, trendline break , and so on...)
📚 Always follow your trading plan regarding entry, risk management, and trade management.
Good luck!
All Strategies Are Good; If Managed Properly!
~Rich
Disclosure: I am part of Trade Nation's Influencer program and receive a monthly fee for using their TradingView charts in my analysis.

DXY Market Outlook: Eyes on 99.392Hello Traders,
DXY found buyers at the 97.921 level we tracked last week and managed to close daily candles above this level. We can now refer to this area as a rejection block (D + RB). This week, the block was retested and encountered rejection from buyers.
With this buyer reaction, our target is the peak level of the consolidation that brought the price here (99.392).
There's a minor level to watch along the way: 98.586. However, considering the key level where the price reacted and the weekly chart showing no major obstacles ahead, we believe that targeting the peak of the consolidation that initiated the last decline (99.392) is the more suitable approach.
Taking news data into account—and more importantly, geopolitical factors and unexpected developments—we still acknowledge the possibility of the price sweeping the low again. However, we don’t expect this to invalidate the overall scenario. With news catalysts, we anticipate the price reaching the target within the week.
Until the next update, wish you many pips!

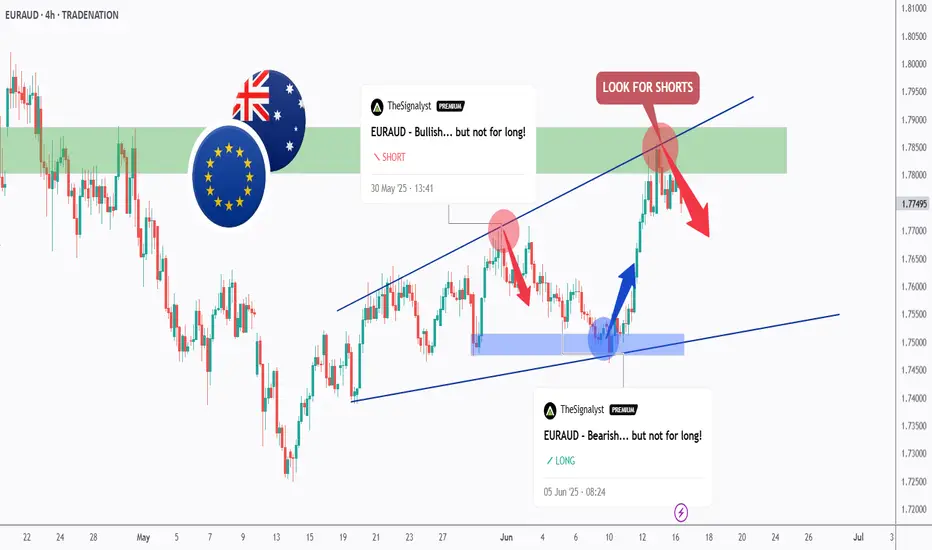
We Are Milking EURAUD... Again!Hello TradingView Family / Fellow Traders. This is Richard, also known as theSignalyst.
As per our two EURAUD analysis, we looked for shorts around the green structure and longs around the blue demand.
What's next?
📈EURAUD has been trading within the rising broadening wedge marked in blue, and it is currently rejecting the upper bound of the wedge which we consider an over-bought zone.
Moreover, the green zone is a strong structure and resistance.
🏹 Thus, the latest highlighted red circle is a strong area to look for sell setups as it is the intersection of the upper blue trendline and resistance.
📚 As per my trading style:
As #EURAUD is around the red circle zone, I will be looking for bearish reversal setups (like a double top pattern, trendline break , and so on...)
📚 Always follow your trading plan regarding entry, risk management, and trade management.
Good luck!
All Strategies Are Good; If Managed Properly!
~Rich
Disclosure: I am part of Trade Nation's Influencer program and receive a monthly fee for using their TradingView charts in my analysis.
NZDCHF - The Bears Are Back!Hello TradingView Family / Fellow Traders. This is Richard, also known as theSignalyst.
📈NZDCHF has been overall bearish trading within the falling channel marked in red, and it is currently retesting the upper bound of the channel.
Moreover, the green zone is a strong resistance.
🏹 Thus, the highlighted red circle is a strong area to look for sell setups as it is the intersection of the upper red trendline and resistance.
📚 As per my trading style:
As #NZDCHF approaches the red circle zone, I will be looking for bearish reversal setups (like a double top pattern, trendline break , and so on...)
📚 Always follow your trading plan regarding entry, risk management, and trade management.
Good luck!
All Strategies Are Good; If Managed Properly!
~Rich
Disclosure: I am part of Trade Nation's Influencer program and receive a monthly fee for using their TradingView charts in my analysis.

EURUSD - Getting Over-Bought?Hello TradingView Family / Fellow Traders. This is Richard, also known as theSignalyst.
📈EURUSD has been overall bullish trading within the rising channels marked in red and blue. However, it is currently retesting the upper bound of the channels.
Moreover, the orange zone is a major daily high.
🏹 Thus, the highlighted red circle is a strong area to look for sell setups as it is the intersection of the upper blue/red trendlines and daily high.
📚 As per my trading style:
As #EURUSD approaches the red circle zone, I will be looking for bearish reversal setups (like a double top pattern, trendline break , and so on...)
📚 Always follow your trading plan regarding entry, risk management, and trade management.
Good luck!
All Strategies Are Good; If Managed Properly!
~Rich
Disclosure: I am part of Trade Nation's Influencer program and receive a monthly fee for using their TradingView charts in my analysis.

USDCHF - Now Bullish!Hello TradingView Family / Fellow Traders. This is Richard, also known as theSignalyst.
As per our last USDCHF analysis, attached on the chart, it rejected the upper bound of the orange channel and traded lower.
What's next?
📈USDCHF is now retesting the lower bound of the channel.
Moreover, the blue line is a strong weekly low.
🏹 Thus, the highlighted blue circle is a strong area to look for buy setups as it is the intersection of the lower orange trendline and weekly low.
📚 As per my trading style:
As #USDCHF is around the blue circle zone, I will be looking for bullish reversal setups (like a double bottom pattern, trendline break , and so on...)
📚 Always follow your trading plan regarding entry, risk management, and trade management.
Good luck!
All Strategies Are Good; If Managed Properly!
~Rich
Disclosure: I am part of Trade Nation's Influencer program and receive a monthly fee for using their TradingView charts in my analysis.

EURJPY - Already Over-Bought!Hello TradingView Family / Fellow Traders. This is Richard, also known as theSignalyst.
📈EURJPY has been overall bullish trading within the rising wedge pattern marked in blue. However, it is currently retesting the upper bound of the wedge.
Moreover, the green zone is a major weekly high.
🏹 Thus, the highlighted red circle is a strong area to look for sell setups as it is the intersection of the upper blue trendline and weekly high.
📚 As per my trading style:
As #EURJPY approaches the red circle zone, I will be looking for bearish reversal setups (like a double top pattern, trendline break , and so on...)
📚 Always follow your trading plan regarding entry, risk management, and trade management.
Good luck!
All Strategies Are Good; If Managed Properly!
~Rich
Disclosure: I am part of Trade Nation's Influencer program and receive a monthly fee for using their TradingView charts in my analysis.

RITESRITES showing good strength in recent session. And currently trading near strong hurdle. It has a strong resistance near 310-15 levels and rejected many times earlier. So if now closing above 315 may start new momentum rally in the counter which may continue for next 20-22% upwards. On lower side 270 seems very good support But closing above 315 is very crucial. I would avoid before that but surely keep a closer watch on it.

Potential reversalAs always we must look for channels in which price is moving on a bigger timeframe, this one is in 4h candles giving a good medium term channel which it has respected at least 2 times before, so my idea is to wait for a breakout and retest or a reasonable rejection at this point positioning trades following price as we allways say.... don't go against the trend!

BTCUSDT – Bear Flag Breakdown Imminent?Price is forming a textbook bear flag following the sharp drop from ~108.8K.
The structure shows rising lows in a tight channel, typically a pause before further downside.
📉 Bear Flag Anatomy:
Breakdown support: ~104,000
Measured move target: 98,810
RSI: 49.94 — hovering just below neutral, watch for dip <40 for breakdown confirmation.
Volume: Still low — waiting for a spike to confirm supply pressure.
🧨 Trigger Conditions:
4H close below flag support
RSI < 40
Volume spike above 20-bar average (~1.96M)
🎯 Short Plan:
Entry: Rejection from the fib golden pocket or flag support breakdown
TP: 98,800 (pattern target, confluence with prior support)
🔍 If confirmed, this breakdown could mark the start of a Phase E markdown in Wyckoff terms.
💬 Let me know your thoughts below — are you shorting this flag or expecting a fakeout?
#BTC #Bitcoin #CryptoTrading #BearFlag #ShortSetup #Wyckoff #PriceAction #4HChart

BTC Dominance Rejected Perfectly at 65.48%CRYPTOCAP:BTC.D
Hi everyone,
In my previous idea, I highlighted the 65.48% level as a key resistance — and today, we’ve seen a sharp and clean rejection right from that zone. The reaction aligns perfectly with the levels and path I mapped out earlier, reinforcing the idea that BTC Dominance may be topping out.
This update confirms the original thesis. No need to overcomplicate — the plan is in motion, and unless the structure changes significantly, the outlook remains the same.
Best regards,
Stealth

Pull back SPYBought some puts for 04/29 strike 439. Too much resistance above, looks like is going to be a rejection. Tight SL at 550.

USDJPY Setup: SHORT on 200 EMA Rejection📉 Best Risk/Reward Setup: SHORT on 200 EMA Rejection
🔻 Entry: Sell in the 148.50 - 148.80 zone after rejecting the 200 EMA (⚪)
🎯 Take-Profit (TP1): 146.50 (RRR: 5:1)
🎯 Take-Profit (TP2): 145.00 (RRR: 9:1)
🛑 Stop-Loss (SL): 149.20
📊 Market Overview & Bias
🟥 Bearish Outlook (Macro Trend - Daily & 4H)
✅ USD/JPY remains in a clear downtrend, trading below the 200 EMA (⚪).
✅ Price has consistently rejected the 100 EMA (🟡) as resistance.
✅ Lower highs and lower lows are forming on the daily & 4H charts.
✅ If 146.50 breaks, next downside targets are 145.00 and 143.50.
🟩 Short-Term Bullish Retracement (1H & 30M)
🔹 USD/JPY has found temporary support at 146.50.
🔹 RSI shows bullish divergence, suggesting a possible short-term bounce.
🔹 If price breaks 148.00, we could see a move toward 149.00 – but this remains a counter-trend move within a larger downtrend.
📉 Why This Trade?
🔻 Major resistance at the 200 EMA (⚪) and previous swing highs.
🔻 The macro trend is bearish, so selling rallies is safer than counter-trend longs.
🔻 RSI may enter the overbought zone, signaling a sell opportunity.
🔻 If price struggles at 148.50, expect another bearish impulse.
⚠️ Trading carries a high level of risk, and past performance is not indicative of future results. Always manage your risk carefully and never trade with money you cannot afford to lose. This is for educational purposes only and not financial advice.
💬 Do you think USD/JPY will respect the 200 EMA or break through? Drop your thoughts below! 👇🔥

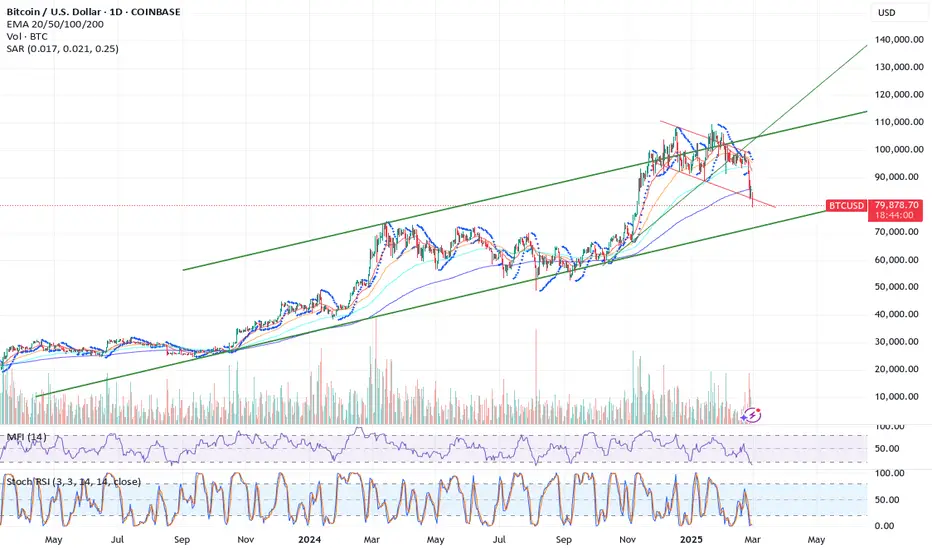
BTC to $72k-$73k to test major supportWe tried to break out of this long term channel and we were rejected like a nerd on prom day. We were tracking a short/medium term descending channel and now we have broken out of that and fast heading for bottom of overarching ascending channel. another really bit of ominous sign is we lost our 200 day moving average, this also puts us at threat of a death cross over the next month or so. Also note the rest of the crypto market for the most part, looks worse than BTC, many are at multi year lows, many have broken their multi-year ascension, few charts look appealing in crypto right now... But we are still inside that long term ascending channel and therefore, still in a bullish trend overall but a lot of things are piling up against it.
So we will look to catch support at around $72- FWB:73K and then hopefully climb back up this channel. If we break the bottom of this two year ascending channel the lows could be a lot lower. The only thing that makes this a little shaky right now is that Ethereum just broke its two year ascending pattern, could it be a sign of whats to come for BTC?
Stay vigilant, personally I would not consider a long before we test that bottom of channel, and even there I would urge tight stop losses for those trying to take advantage of the situation. That also stands for any crypto, never trade any alts and such without also watching BTC, when BTC is unhappy, generally the rest of the market is even more unhappy.
As always, my posts are informational, DYOR.
NZDUSD SELL SETUPOANDA:NZDUSD My overall bias on NAZDUSD is bearish, 4H structure is bearish with it making a retest at the Daily AOI (Area of Interest) and rejecting with a bearish engulfing variation patterning which was my confirmation to go short on NZDUSD

EURAUD - Doing It Again...Hello TradingView Family / Fellow Traders. This is Richard, also known as theSignalyst.
📈EURAUD has been bearish trading within the falling channel in red.
Currently, EURAUD is approaching the lower bound of the channel.
Moreover, the zone marked in blue is a strong support.
🏹 Thus, the highlighted blue circle is a strong area to look for buy setups as it is the intersection of the support zone and lower trendline acting as non-horizontal support.
📚 As per my trading style:
As #EURAUD approaches the blue circle, I will be looking for bullish reversal setups (like a double bottom pattern, trendline break , and so on...)
📚 Always follow your trading plan regarding entry, risk management, and trade management.
Good luck!
All Strategies Are Good; If Managed Properly!
~Rich

Bitcoin rejected the $58k levelBitcoin was rejected from the $58k level yesterday. Right now, I could see a move higher, but until the trend has changed, we will continue to make lower lows. One level to keep an eye on is still the low at $54.5k.
