High confluence of intraday supportsThe stock after reaching it's new highs made a correction. Now It shows a bearish rejection in a zone with confluence of supports (61.8 Fibo, Trend line, Support traced by the previous test high), If the price increases it's bullish momentum, it may resumes its bullish bias
Rejection

USDJPY - Potential Bearish Reversal!Hello everyone, if you like the idea, do not forget to support with a like and follow.
USDJPY is sitting around a daily resistance in blue so we will be looking for sell setups.
on H4: USDJPY is forming a wedge pattern in red but the lower trendline is not valid yet. So we will be waiting for a third swing to form around it to consider it our trigger swing (projection in purple)
Trigger => Waiting for that third swing (gray zone) to form then sell on its break downward.
Until the sell is activated, USDJPY would be overall bullish and can still trade higher.
Good luck!
All Strategies Are Good; If Managed Properly!
~Rich

SUPER DUPER STRONG SUPPORTIT has taken a support of 200 ema
it also take support on trendline
it has taken a support on fibonacci 0.61% level

Fibonacci Example $FSRAfter a perfect bounce off the descending demand line, which happened to be in confluence with a historical support level, we saw a nice move on $FSR. Price then retraced, and we got a perfect double bottom on the 0.618 fibonacci retracement level (often dubbed the "golden level").

US30 has been a steady uptrend, insight on scenarios to expect.This Indices has been on a steady uptrend, we have seen a clear break-out, retest and continuation. From the chart we have identified that the price is currently trading in a channel up, a successful to buy to the upper trend-line acting as a RESISTANCE if we can see a rejection with spinning top and or a Bearish Engulfing at this trend-line acting as RESISTANCE area, there is possibility of selling to the SUPPORT AREA @ 35769.7


GBPAUD - Purple War Zones!Hello everyone, if you like the idea, do not forget to support with a like and follow.
GBPAUD is overall bearish trading inside the red channel , and it is currently approaching the lower red trendline and blue support.
As per my trading style/plan;
Here are the two strong zones where I will be looking for high probability buy setups:
I call them War Zones, (highlighted in Purple circles)
Zone 1: (around 1.865)
This highlighted purple circle is a strong area to look for sell setups as it is the intersection of the green resistance and upper red trendline. (acting as non-horizontal resistance)
Zone 2: (around 1.83)
This highlighted purple circle is a strong area to look for buy setups as it is the intersection of the blue support and lower red trendline. (acting as non-horizontal support)
As per my trading style:
As GBPAUD approaches one of the purple circles, I will be looking for reversal setups (like a double bottom /top pattern, trendline break , and so on...)
Always follow your trading plan regarding entry, risk management, and trade management.
Good luck!
All Strategies Are Good; If Managed Properly!
~Rich

IDEA - Potential Bullish Reversal!Hello everyone, if you like the idea, do not forget to support with a like and follow.
IDEA is approaching a support zone so we will be looking for buy setups on lower timeframes.
on H4: IDEA is forming a channel in blue but the upper trendline is not valid yet, so we are waiting for a new swing high to form around it to consider it our trigger swing. (projection in purple)
Trigger => Waiting for that swing to form and then buy after a momentum candle close above it (gray zone)
Meanwhile, until the buy is activated, IDEA would be overall bearish can still trade lower inside the channel and test 0.10 before going up.
Good luck!
All Strategies Are Good; If Managed Properly!
~Rich

EURCHF - Wait For The Trigger!Hello everyone, if you like the idea, do not forget to support with a like and follow.
EURCHF is sitting around a daily support zone so we will be looking for buy setups on lower timeframes.
on H4 / H1: EURCHF formed an inverse head and shoulders pattern but it is not ready to go yet.
Before we buy, we want the buyers to take over again.
Trigger => Waiting for a momentum candle close above the gray neckline to buy.
Meanwhile, until the buy is activated , EURCHF would be overall bearish can still trade lower inside the green support.
In this case, we will be looking for new buy setups to form as long as price doesn't break the zone downward.
Good luck!
All Strategies Are Good; If Managed Properly!
~Rich

1810 Wkly Outlook, GOLD still bearish to us to 1680Hello traders,
This is not a set up plan. Wkly outlook, gold is till my option to sell.
The channel is broken on 4h chart, ABC wave could finish A at the green dash support line.
B is where we should wait for signal to sell.
Good luck on this plan to follow wkly trend that still bearish to us.
LESS IS MORE!

CADJPY - My Trading Plan in 4 mins!Hello everyone, if you like the idea, do not forget to support with a like and follow.
Here is the top-down analysis for CADJPY, feel free to request any pair/instrument or ask any questions in the comment section below.
Best of luck!

CADJPY - Wait For The Trigger!Hello everyone, if you like the idea, do not forget to support with a like and follow.
CADJPY is sitting around a daily resistance in red so we will be looking for sell setups.
on M30: CADJPY is forming a double top pattern but the setup is not ready to go yet.
Before we sell, we need the bears to take control.
Trigger => Waiting for a momentum candle close below the gray neckline to sell.
Until the sell is activated, CADJPY would be overall bullish and can still trade higher.
Good luck!
All Strategies Are Good; If Managed Properly!
~Rich

Two BTC scenarios for near future: rejection or breakthroughI am bullish on BTC, but on a very short timeframe there is a scenario for bearishness.
This idea displays the movement of BTC in a parallel channel, in two possible scenarios.
Scenario 1: we get rejected at a critical zone of resistance around 58,500, at which point we move downwards for a final correction before bouncing up again to break ATH within channel.
Scenario 2: we break out of the channel and break the critical resistance at 58,500 and move towards ATH.

AUD / NZD BUY Disclaimer: Any of the content presented on my page showing my analysis of the market is just that, an analysis which means this is my personal opinion of where the price is going to go. Do not by any means take this simple analysis for a reason to enter a trade, I am not presenting these analyses as a form of signals, simply a way to get feedback and opinions from others on how my trades look. Take this trade at your own risk, but know forex is a risky market that you can make a lot of money but can lose that money or even more just as fast, enter these markets with your own risk and good luck with your trading :).
Daily Analysis:
As shown below price has fallen into a pretty steep downtrend in the previous few weeks, with a push to the bottom it found a hard time breaking past the 1.0300 area and showed rejection to that area and pushed back up. I noticed that price had started to form somewhat of a uptrend and has even bounced off of some support which you can see more clearly on the hourly time frame proved down below. For me to enter this trade I am going to need a close above recent highs and a very bullish candle, at that point I would only be ever risking one percent of my total capital.
Hourly Analysis:
Price has already shown support off the areas marked down below and you can see a little more clear that it had multiple candles of rejection before moving to the upside and continuing on in the up trend. I think a close above the red zone could be a good entry for a long position and could end up in a good risk to reward trade. This could still be a risky trade due to the recent down trend, if you want more confirmation you can wait for price to reach that next black lone marking the next zone on this pair.
When I enter any trade I will risk one percent of my total capital to keep my losses to a minimum but to also but my strategy to work in the big picture. If you have a trade with a one to five risk to reward, you can cover five if not more losing trades with a single big winner. Keep an eye on your risk management and do not get cocky and put too much at risk on a single trade. Hope your trading weeks goes well and if you have any questions on my strategy just comment down below and I can put together a full on list of my rules and how I enter a trade.
Thanks again,
KeySlot

DOT RUNNING! - UpdateDot has broken past the local golden pocket and the final major local resistance, and is currently pressed against the top of the major golden pocket,. which tracks back from the May - July dip.
Chart Patterns:
Dot rejected the bearish head and shoulders pattern that I had previously predicted on Sept 30th.
The Head and Shoulders pattern from September could be looked at as a symmetrical triangle with a target price the length of the tail (around $44)
The technical indicators shown:
MACD - Has turned up and is bullish green, which signals to me that DOT will break farther upwards.
RSI - Shows bullish RSI divergence moving forward. Note, I have the bearish RSI Divergence marked from April - MAY which signaled the major dump. The bullish RSI divergence SHOULD be the same, but opposite, strength as what we had in May.
Fix Range Volume indicator: Shows we have broken past the volume resistance.
ITG Scalper - Shows a buy signal from about a week ago.
My strategy:
First off, I would like to note that DOT in my opinion has been manipulated HEAVILY in the last few months and should be a top 5 project.
I closed position between 38 and 36, and started looking for a buy position when DOT bounced off of the $26 mark. I entered around the $28 mark and currently holding that position.
If we bounce off of the golden pocket with force, I will close position and look to reenter around 30, or on the break upward past the golden pocket.
If we break past the top of the golden pocket, my targets are: $44, $50 (this is ATH), $62.
Currently looking for a price target at the end of the bull run $100 by December, $250 if extended.
This is not Financial Advice.

Time For A Pull Back?Hi all,
We had a great breakout above the down trend and the neck line together, showing major sign of strength, however got rejected from the dangerous neck line. It's good that it was surpassed and now it's weakened.
Downside target of a retracement and a retest of the down trend line happens to intersect with Fibonacci 0.382 at 49.600. If that is lost, we have 47.660 also coincides with Point of control and 45k as the last retracement levels. If 45k is lost, then it's game over :)
Upside target, 60k waits as a weekly and physiological target.
We should wait until support or resistance levels of the current sideways trading range is broken and verify the direction with a swing failure.
Note that there are many bull and bear traps now, so don't FOMO into anything, set your alerts and wait for confirmation before taking action.
But hey, what do i know :)
Trade safe!

GRT - The Most Detailed Trading Plan! 7 mins video!Hello everyone, if you like the idea, do not forget to support with a like and follow.
Here is the top-down analysis for GRT, feel free to request any pair/instrument or ask any questions in the comment section below.
Best of luck!

IS THE DUMP COMING? OR NEW HIGHS? SHIBA INU ANALYSIS!Shiba keep pumping in the last few days.
Will it keep making new highs? or is the dump coming?
Shiba just touched a rejection, and created bearish head and shoulders (15/30m chart).
(And seems also start of Wrising wedge.)
On indicators you can see bearish divergence and triangle in RSI, and flag in MACD.
PLEASE DO NOT TAKE DECISIONS for Long or Short from my analysis!
The market isn't clear right now!
For the pattrens traders, BE AWARE to take short under the H&S. in the 2nd last times Shiba created bearish patterns and it still created new highs!
(To see more clearly the double top and the head and shoulders go to15m/30m chart.)
I am neutral untill the market won't breake the rejection or break the HL.
Follow me to be keep updated for Shiba and crypto!
I am not responsible for your money!

EURCAD - Potential Bullish Reversal!Hello everyone, if you like the idea, do not forget to support with a like and follow.
EURCAD is sitting around a support zone so we will be looking for buy setups on lower timeframes.
on M30: EURCAD is forming a trendline but it is not valid yet, so we are waiting for a new swing high to form around it to consider it our trigger swing. (projection in purple)
Trigger => Waiting for that swing to form and then buy after a momentum candle close above it (gray zone)
Meanwhile, until the buy is activated, EURCAD would be overall bearish can still trade lower.
Good luck!
All Strategies Are Good; If Managed Properly!
~Rich

Butterfly Almost Complete Butterfly completes on the 200EMA, strong support and and order block, I'm going to wait for price to reach this level and wait for the reaction but this is looking like a 100% short, especially looking at the HTF PA! Then targets would be the D point of the Crab which also land down in a strong support zone in January before more rejection!

BTC - You Decide => We Follow!BITCOIN broke the red channel and traded higher! Now What?
Scenario 1: Short-Term Reversal
BTC rejects the 50k resistance.
In this case, we will be looking for buy setups as it approaches the 40k support.
Scenario 2: Bullish Continuation - Breakout
BTC breaks above the 50k resistance.
In this case, the 50k resistance would become support, and we will be looking for buy setups on its retest.
Which Scenario do you think is more likely to happen? and Why?
Good luck!
All Strategies Are Good; If Managed Properly!
~Rich

BTT - Potential Bullish Reversal!Hello everyone, if you like the idea, do not forget to support with a like and follow.
BTT is approaching a support area so we will be looking for buy setups on lower timeframes.
on H4: BTT is forming a wedge pattern in red but the upper trendline is not valid yet, so we are waiting for a new swing high to form around it to consider it our trigger swing. (projection in purple)
Trigger => Waiting for that swing to form and then buy after a momentum candle close above it (gray zone)
Meanwhile, until the buy is activated, BTT would be overall bearish can still trade lower.
Good luck!
All Strategies Are Good; If Managed Properly!
~Rich

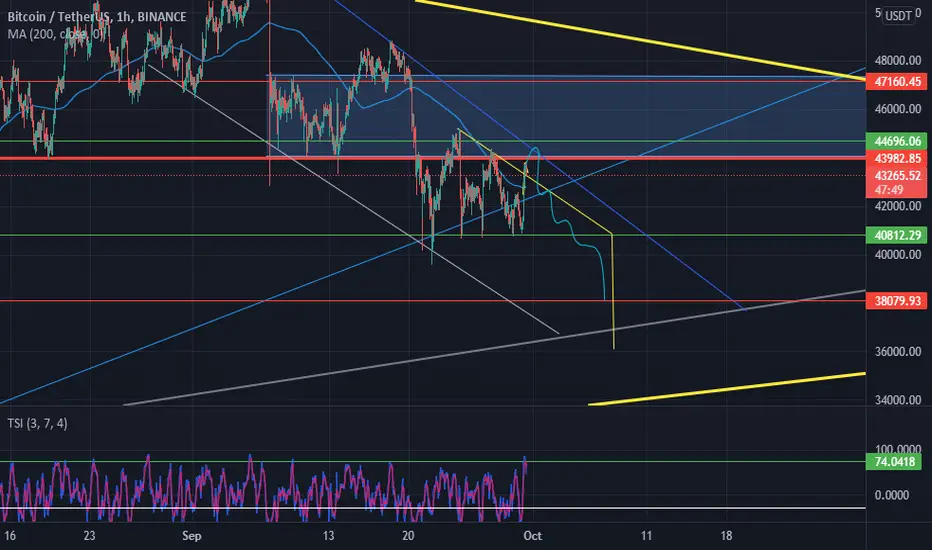
BTC can have bad dump...Here BTC have resistance on 43.700 and nearly rejected it and if have a fully reject , BTC will have bad dump to 41.000 and next 38.000 ...!
So wait for new update and short BTC !
what do you think ?