BTC Dominance Update - Alt season confirmed ?#BTC.D #Analysis
Description
---------------------------------------------------------------
+ Bitcoin dominance (BTC.D) has surged to a local high amid a sharp decline in altcoins, driven by recent recession fears. This rise in dominance has brought BTC.D close to a significant resistance level, a key area to watch for the potential start of an alt season.
+ The current BTC dominance is hovering around 57%, near a major resistance line. Historically, a rejection at this level has been crucial for the onset of alt season, where altcoins outperform Bitcoin.
+ Looking at past trends, alt season has typically followed a rejection of BTC dominance from this resistance. If history repeats itself, a pullback from this level could signal the beginning of a strong altcoin rally.
+ Should BTC dominance begin to decline, the next significant support level is around 40%. A move towards this support could trigger a substantial shift in market dynamics, favoring altcoins.
+ A downward trend in BTC dominance from current levels would likely fuel a major alt season, as capital flows out of Bitcoin and into altcoins. This scenario could present significant opportunities for traders focusing on the altcoin market.
Conclusion:
BTC dominance is at a critical juncture, with its proximity to a key resistance level potentially setting the stage for the next alt season. A rejection at this resistance could lead to a decline in dominance towards the 40% support, igniting a robust rally in altcoins.
---------------------------------------------------------------
Enhance, Trade, Grow
---------------------------------------------------------------
Feel free to share your thoughts and insights.
Don't forget to like and follow us for more trading ideas and discussions.
Best Regards,
VectorAlgo
Rejection

USDCHF: Multiple Rejections, Strong Bullish Leg ExpectedPrice has recently rejected support on multiple occasions, and a double bottom pattern appears to be emerging on the daily (D) timeframe. Additionally, multiple rejections on the 4-hour (4H) timeframe further strengthen our bullish bias. I expect the price to continue in a strong upward trajectory.
**Rationale:**
~ Breakout of Descending Channel (D)
~ Retest of Support (D)
~ Break of Uptrend line (D)
~ Double Bottom Pattern (D)
~ Retest of Support (4H)
~ Rejection Candlesticks (4H)
**Disclaimer:**
My trading ideas are market predictions and therefore should be viewed as such. As an intraday trader (scalper), I use my observations to identify potential trade opportunities on the higher time frames. I then aim to pinpoint key entry points on the lower time frames. Entries should always be verified by additional confirmations.
---
#scalping
#intraday

TESLA PULLBACK Then Moon Mission!After a rejection from the weekly and daily levels, a pull back to $235 (Daily Level) or $202 (Demand Zone) is likely before higher prices.
Calculate Your Risk/Reward so you don't lose more than 1% of your account per trade.
Every day the charts provide new information. You have to adjust or get REKT.
Love it or hate it, hit that thumbs up and share your thoughts below!
This is not financial advice. This is for educational purposes only.

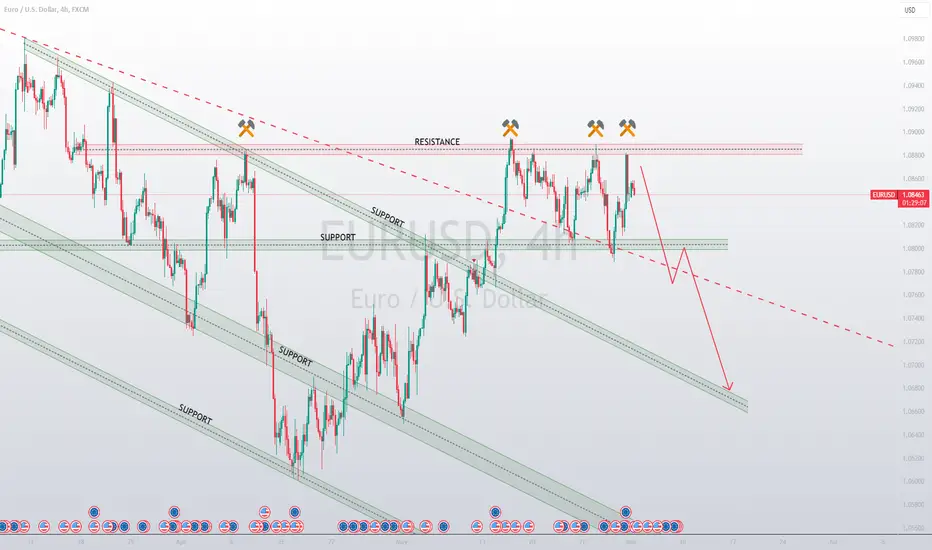
Sell EURUSDThe EURUSD pair has rejected the resistance zone at least four times and is now indicating a potential reversal to the downside. The price action on the EURUSD chart is showing signs of exhaustion as it struggles to break above the resistance zone. Traders are closely monitoring the key support levels for any potential breakdown, which could lead to a shift in market sentiment towards a bearish outlook.
DISCLAIMER
The signals provided by LeoDante_FX are for informational purposes only and do not constitute investment advice. We do not guarantee the accuracy, completeness, or timeliness of the signals, and we are not responsible for any losses or damages arising from the use of our signals.
USDCHF at Support LevelThis currency pair is at a support level. Prices had rejected that zone several times.
Although the structure looks like a head and shoulder pattern, the support level hasn't been broken yet therefore an opportunity to buy is the best choice.
The profit target should be the first resistance level.
DISCLAIMER
The signals provided by LeoFX are for informational purposes only and do not constitute investment advice. We do not guarantee the accuracy, completeness, or timeliness of the signals, and we are not responsible for any losses or damages arising from the use of our signals.

BITCOIN in a range.The price of Bitcoin has been moving in sideways for some time now. Any time the price moves into the 70,000 range the bears step in and push the price lower.
I think it will be the same this time.
Look for opportunities to sell into the 60,000 level.

XAUUSDXAUUSD is about to entered in strong resistance zone.
Price is been on strong bullish run from last few days but now has entered into bears territory, will the bears get active active and send price back to 2370 region ?

EURNZDEURNZD is in strong bearish trend.
As the market is consistently printing new LLs and LHs.
currently the market is retracing a bit after last LL, which is 50% Fib retracement level and local support as well. if the market successfully sustain this selling confluence the next leg lower could go for new LL.
What you guys think of this idea?

ES Futures Double Top Rejection- 3 Failed tests on 4h timeframe
- Price breakdown (hourly bear flag)
- Price targets: 5226.75, 5153.75, trailing stop
- Stop Loss: 5350 (break into ATHs)

NZDUSD sell setupNZDUSD is in a downward trend channel. This suggests that the New Zealand dollar is weaker than the US dollar. Price has recently showed some rejection at the top of the channel therefore we are looking to sell. The Take Profits target should be 0.58807 .We will set our Stop Loss at 0.60400 to manage risk in case the price reverses. It is important to closely monitor the trade and adjust the Stop Loss as needed to protect profits. Trading in the direction of the trend channel can help increase the probability of a successful trade.

🌟 Gala's Cryptic Dance: Unveiling Hidden Paths! 🌀🎮 Gala, the gaming-focused blockchain platform, faces resistance at 7 cents, prompting a reassessment of its near-term outlook. 🛑 This analysis explores potential support and bounce levels on the 4-hour timeframe, guiding traders through key price dynamics.
Introduction:
Gala's recent rejection at 7 cents signals a temporary pause in its upward momentum. 📉 Traders are now eyeing crucial support and bounce levels to navigate Gala's price action effectively.
Resistance at 7 Cents:
The rejection at 7 cents suggests strong selling pressure, hindering Gala's ascent. 📉 Sellers aiming to secure profits or establish short positions likely contributed to this pullback.
Support Target at 0.04956:
Attention shifts to a critical support target at 0.04956, where buying interest may converge. 🎯 Gala must find support at this level to resume its upward trajectory effectively.
Potential Bounce at 0.05920:
Traders should monitor the possibility of a bounce at 0.05920, offering a temporary support zone. ⏫ A bounce here could reignite bullish momentum, setting the stage for a retest of resistance levels.
Conclusion:
Gala's price movements hinge on navigating key support and resistance levels effectively. 🔄 With a support target at 0.04956 and a potential bounce at 0.05920, traders can strategically plan their entries and exits amidst changing market conditions. 📈 By remaining adaptable and responsive, traders can seize opportunities in Gala's dynamic price action. 🚀

BTC - Correction Phase Started 📉📈Hello TradingView Family / Fellow Traders. This is Richard, also known as theSignalyst.
📈 After breaking below $70,000 , BTC started the bearish correction phase.
As long as the $70,000 resistance holds, we anticipate a movement towards the lower bound of the red wedge pattern.
Moreover, the $60,000 - $62,000 range is a massive support zone.
🏹 Thus, the highlighted red circle is a strong area to look for buy setups as it is the intersection of the blue support and lower red trendline.
📚 As per my trading style:
As #BTC approaches the red circle zone, I will be looking for bullish reversal setups (like a double bottom pattern, trendline break , and so on...)
📚 Always follow your trading plan regarding entry, risk management, and trade management.
Good luck!
All Strategies Are Good; If Managed Properly!
~Rich

LEVER - Expect Short opportunity ?#LEVER #Analysis
Description
---------------------------------------------------------------
+ I usually don't share short signals when the market is bullish but this is an exception.
+ As you can see in the chart, this is the third time price is getting rejected in the resistance, this is showing clear bearish trend for the LEVER
+ I'm planning to enter a small short position with a low capital at the current price.
+ Don't risk more than 0.2% of the capital
---------------------------------------------------------------
VectorAlgo Trade Details
------------------------------
Entry Price: 0.002569
Stop Loss: 0.003160
------------------------------
Target 1: 0.002268
Target 2: 0.001990
Target 3: 0.001717
Target 4: 0.001328
------------------------------
Timeframe: 1D
Capital: 1% of trading capital
Leverage: 5x
---------------------------------------------------------------
Enhance, Trade, Grow
---------------------------------------------------------------
Feel free to share your thoughts and insights.
Don't forget to like and follow us for more trading ideas and discussions.
Best Regards,
VectorAlgo

GOOGL - More room to the downside! Easy short to look out for!We will need to see tapering under our magenta buying channel which failed to pick up price. And if we see that throughout the day today, I will look for either a rejection from our strong selling green (on the daily) or our more tapered selling teal (which is strong selling on the weekly).
Keep an eye out for these and join my livestream at market open to see how I look for and take my trades.
Happy Trading :)

ETH - 4500 Soon 📈 If...Hello TradingView Family and Fellow Traders,
This is Richard, also known as theSignalyst.
📈 ETH has shown an overall bullish trend, trading within the rising broadening wedge pattern highlighted in red.
It's evident that ETH has been respecting significant round numbers, particularly the 500 marks.
Following its breakthrough above 3500, ETH traded higher to find resistance around 4000.
📈 To maintain control and drive prices higher towards 4500, the bulls require a daily candle close above 4000.
📉 In parallel, ETH retests the lower bound of the wedge pattern, we will be seeking trend-following buy setups on lower timeframes.
📚 Always adhere to your trading plan, especially regarding entry points, risk management, and trade execution.
Wishing you all the best of luck!
Remember, All Strategies Are Effective When Properly Managed!
~Rich

BTC - Tell me what is next ? Breakout OR Rejection ? #BTC/USDT #Analysis
Description
---------------------------------------------------------------
+ As depicted in the chart, BTC is currently at a crucial juncture, trading near the all-time high (ATH) range on the monthly chart.
+ This pivotal moment will determine Bitcoin's trajectory, as a breakout could propel it to new ATH levels, aligning with expectations and historical Bitcoin halving cycles.
+ In the event of a rejection, the next support level is anticipated around the 47K range. However, the possibility of a breach below this support, leading to a target of 30K, seems less likely.
+ Personally, I maintain an optimistic outlook on a price breakout. I anticipate Bitcoin to consolidate near the ATH range, paving the way for a smooth ascent once the ATH barrier is breached.
---------------------------------------------------------------
Enhance, Trade, Grow
---------------------------------------------------------------
Feel free to share your thoughts and insights.
Don't forget to like and follow us for more trading ideas and discussions.
Best Regards,
VectorAlgo

MSFT - Strong chance of a rejection and move downI will be looking out today for a rejection from our strong orange selling channel to add to our right shoulder liquidity (within the larger daily H&S) - this will then trigger all the left shoulder liquidity and allow for a move down to minimum $401 in the coming days and I see even $392 (green channel support) in the coming weeks.
Let me know what you think - of course, if yellow continuation is able to break us out of orange and teal selling today then we have a chance at a retest and break of blue buy-side tapering. However it looks like the bears have been preparing for this larger drop (and the bulls on the other side could use more liquidity for the break of this strong channel).

Rejection or Breakout for OP/USDT ? BINANCE:OPUSDT (4H CHART) Technical Analysis Update
OP is currently trading at $ and currently price is at the resistance line
We can expect price to either breakout from the resistance or get rejected from the resistance. We will enter trade based on whether price will get rejected or not.
LONG Trade Details (only after confirmed Breakout)
Entry level: $ 4.023
Stop loss level: $ 3.818
Target 1: $ 4.122
Target 2: $ 4.217
Target 3: $ 4.429
SHORT Trade Details (only after confirmed Rejection
Entry level: $ 3.818
Stop loss level: $ 3.978
Target 1: $3.723
Target 2: $3.623
Target 3: $3.458
Max Leverage: 5x
Stay tuned for updates on breakout or rejection.
Don't forget to keep stop loss.
Follow Our TradingView Account for More Technical Analysis Updates, | Like, Share and Comment Your thoughts.
Cheers
GreenCrypto

I'm bearish on GOLD#GOLD Analysis
Description
---------------------------------------------------------------
+ As you can see in the chart, GOLD price got rejected at the resistance line once.
+ Now the price is heading back to the resistance line again.
+ I'm expecting the price to get rejected again at the resistance. if the price gets rejected again then we have a good chance for a short trade.
+ I'm planning to enter the short trade after clear rejection.
---------------------------------------------------------------
VectorAlgo Trade Details
------------------------------
Entry Price: 2016.44
Stop Loss:2024.40
------------------------------
Target 1: 2011.89
Target 2:2003.57
Target 3:1995.06
Target 4: 1984.37
------------------------------
Timeframe: 1H
Capital: 1-2% of trading capital
---------------------------------------------------------------
Enhance, Trade, Grow
---------------------------------------------------------------
Agree or Disagree with the ideas ? lets discuss in the comments.
Like and follow us for more ideas.
Regards
VectorAlgo

SEI - Trading The Box 📦Hello TradingView Family / Fellow Traders. This is Richard, also known as theSignalyst.
📦 SEI has been trading inside a narrow range between 0.55 and 0.85.
🏹It is currently approaching the lower bound of the range , so we will be looking for buy setups on lower timeframes.
📈 For the bulls to take over, we need a break above the last major high marked in red. In this case a movement till the upper bound of the range would be expected.
📚 Always follow your trading plan regarding entry, risk management, and trade management.
Good luck!
All Strategies Are Good; If Managed Properly!
~Rich

Bitcoin(BTC): Rejected $45K Zone!!!We got what we came for!! We have a very nice rejection near the $45K zone, which shows demand for further movement to lower zoes.
Remember, the longer the tree grows, the harder it falls. We are still way too expanded and overbought on BTC, so keep your eyes open for potential further movement to lower zones!
The start looks promising, but we gotta be careful for any short-squeeze!
Swallow Team

NZDUSD - Top-Down Analysis 📹 From Weekly To H1Hello TradingView Family / Fellow Traders. This is Richard, also known as theSignalyst.
📈 Here is a detailed update top-down analysis for #NZDUSD.
Which scenario do you think is more likely to happen? and Why?
📚 Always follow your trading plan regarding entry, risk management, and trade management.
Good Luck!.
All Strategies Are Good; If Managed Properly!
~Rich

GBPNZDGBPNZD is trading in descending channel and printing consistent LLs LHs. Recently the price is broken the important support zone and now retesting the broken level, which is also the 50% Fib retracement level.
If the sell momentum continues the next target could be 2.0200
What you guys think of this idea?
