ASIA - NZDUSD - Break Out, Break Back In/618 - DepletionTIMING: Asia
LEVEL: Weekly, 618
SETUP: BOBBI, 618
ENTRY: Depletion/Rejection, Momentum
Rejection

ASIA - USDJPY - B&R - RejectionTIMING: ASIA
LEVEL: Breakout, Round Numbers (145.50)
SETUP: Break & Retest
ENTRY: Rejection

ASIA - USDCHF - BREAK & RETEST - REJECTIONTIMING: ASIA
LEVELS: Round numbers (0.8800)
SETUP: B&R
ENTRY: REJECTION

AUDNZD - Trading The Wedge 🌙 AgainHello TradingView Family / Fellow Traders. This is Richard, also known as theSignalyst.
As per my last AUDNZD analysis, we have been looking for sell setups around the green resistance zone.
AUDNZD traded lower and it is currently hovering around a robust demand zone.
Moreover, it is approaching the lower red trendline.
🏹 So the highlighted red circle is a strong area to look for buy setups as it is the intersection of the blue demand and red trendline acting as a non-horizontal support.
As per my trading style:
As AUDNZD approaches the red circle zone, I will be looking for bullish reversal setups (like a double bottom pattern, trendline break , and so on...)
📚 Always follow your trading plan regarding entry, risk management, and trade management.
Good luck!
All Strategies Are Good; If Managed Properly!
~Rich

Possible rejectionPair just hit a two years old resistance. I'm opening a small short position and I will add if price action confirms the rejection: a double top or some other bearish pattern on lower timeframes. SL above the next resistance. This could be the beginning of a bearish triangle if the pair breaks down the 0.94 support. But let's see how it goes first.

UJ: “Break Out, Break Back In” on “Rejection” Entry (21/100)System has identified a “BOBBI” playbook setup and a potential “momentum” shift market entry during the first hour of the ASIA 12-Candle Window.
RISK: 1R
TARGET: 4R
***DISCLAIMER***
This is a new system based strategy being live tested for the purpose of gathering data. The system generates between 3-6 signals per session upon detecting a qualifying setup and entry signal. Currently being tested only in ASIA and only using USD/JPY pair. The win rate and expectancy are unknown. Please do not take these trades.

Bitcoin (Short in at local top) #NFA Declining VOL on TREND- up
W/ touching Resistance followed by lower highs.
#NFA INDEX:BTCUSD

📈 AMD back @ flag's top trend. Watch for breakout/ rejectionJust a recap of this trade so far:
Posted this @ 108 calling for a bearish rejection.
After it failed to bounce from 101-103, I was certain it'd head over to 95-98, or the bottom TL at most.
When we hit the bottom TL, I called for a buy signal @ 95.
Will tag all these for proof.
Now we are at the top TL, which is the ultimate PT from 95. We hit this in 2 days. +10% in 2 days. That's right.
When you wait for swings to come to you, you will make the most money.
Here's the alert @ 95-96:
We waited a week or two for this perfect bounce. That's the best way to swing.
One way to swing is to buy, buy more, buy more, and buy some more. Another way, is to wait for the right moment and wait for the trade to come to you. If you miss it, you miss it. All good, there's tons of trades on the market.
NASDAQ:AMD NASDAQ:QQQ AMEX:SPY NASDAQ:TSLA NASDAQ:NVDA

GBPJPY will backup, and give us buy signalHey there traders,
Last day GBPJPY fall from 181.3 at 02:00pm (UTC)
It was a sudden fall. No one expect that, that means market will take backup of this fall.....
that could be an awesome buy signal......
Follow us for trading idea's
Be happy......

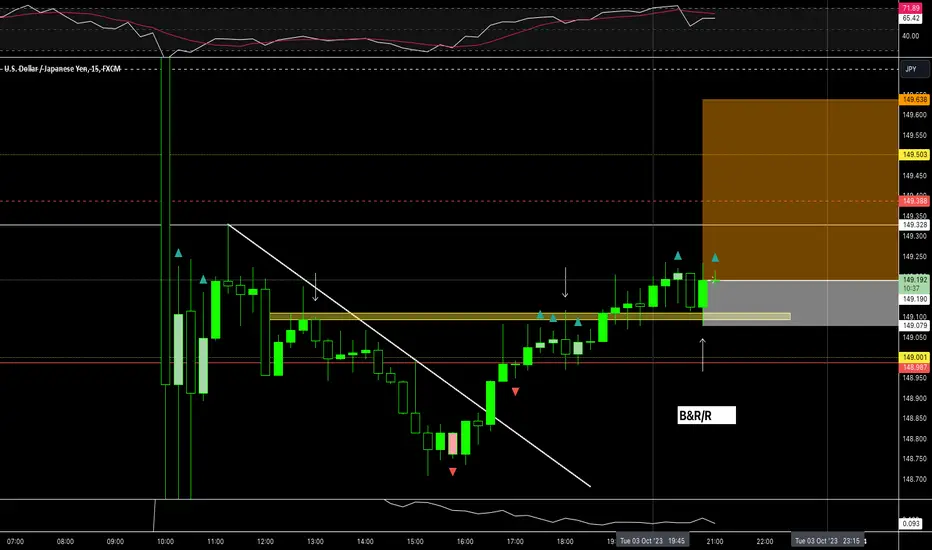
UJ: “Break & Retest” Setup on “Momentum” Entry (12/100)System has identified a “B&R” playbook setup and a “rejection” market entry during the second hour of the ASIA 12-Candle Window.
RISK: 1R
TARGET: 4R
***DISCLAIMER***
This is a new system based strategy being live tested for the purpose of gathering data. The system generates between 3-6 signals per session upon detecting a qualifying setup and entry signal. Currently being tested only in ASIA and only using USD/JPY pair. The win rate and expectancy are unknown. Please do not take these trades.
UJ: “Break Out, Break Back In” Setup on “Momentum” Entry (4/100)System has identified a “BOBBI” playbook setup and a potential “rejection” sell stop entry during the second hour of the ASIA 12-Candle Window.
RISK: 1R
TARGET: 4R
***DISCLAIMER***
This is a new system based strategy being live tested for the purpose of gathering data. The system generates between 3-6 signals per session upon detecting a qualifying setup and entry signal. Currently being tested only in ASIA and only using USD/JPY pair. The win rate and expectancy are unknown. Please do not take these trades.

TRX 8% Drop Likely!When taking a look at the legendary TRX, we can see that it is showing signs of weakness after failing to trade above the recent high 3 times in a rom. If price continues down, I would expect a 8% drop to the golden pocket which lines up with the horizontal support .
Every day the charts provide new information. You have to adjust or get REKT.
Love it or hate it, hit that thumbs up and share your thoughts below!
Don't trade with what you're not willing to lose. Calculate Your Risk/Reward!
This is not financial advice. This is for educational purposes only.

STMX, rejected the trendline BINANCE:STMXUSDT , rejected the main trendline on 1D view
STMX couldnt break the trendline. Lower support is 0.5 - 0.52, that should be the epic buy zone for next breakout. Keep eyes on it.
Enjoy!!
Follow me for more chart analysis.
Patience is the key to success.
DYOR

EURGBPIs EURGBP exhausting at highs?
As the price is been on high bull run but now it seems like price is lacking bullish momentum after reaching at daily time frame resistance level, suggesting the sell pressure is about to start.
If the bears took control , the 1st target could be 0.8600.
What you guys think of it ?

USDCHF - Looking For Sell Setups ↘️Hello TradingView Family / Fellow Traders. This is Richard, also known as theSignalyst.
USDCHF has been overall bullish trading inside the rising channel in red, however it is currently approaching around the upper trendline.
Moreover, the zone 0.9 is a strong supply.
🏹 So the highlighted red circle is a strong area to look for sell setups as it is the intersection of the blue supply and upper red trendline acting as a non-horizontal resistance.
As per my trading style:
As USDCHF approaches the orange circle zone, I will be looking for bearish reversal setups (like a double top pattern, trendline break , and so on...)
📚 Always follow your trading plan regarding entry, risk management, and trade management.
Good luck!
All Strategies Are Good; If Managed Properly!
~Rich

BTC - Top Down Analysis 📹 From Weekly To H1Hello TradingView Family / Fellow Traders. This is Richard, also known as theSignalyst.
📈 Here is a detailed update top-down analysis for #BTC.
Which scenario do you think is more likely to happen? and Why?
📚 Always follow your trading plan regarding entry, risk management, and trade management.
Good Luck!.
All Strategies Are Good; If Managed Properly!
~Rich

FInally gold will buy According to the price action and the price patterns ,finally gold will buy .gold created a triple bottom and it will made a huge rejection to the upside till 1935 .
if the gold breaks 1935 then the target is 1945 /50 range.on other hand if gold breaks bellow 1915 it will lead gold to move to the hell(1881).
But pattern structure will not able to do that.i settled my stops below 1915 with final tp 1935 .
(this is a not a financial advice.just my idea.please consider that)

The most common malpractice in all of Trading: Back-testingGiven ANY in- or out-of-sample time series, including purely random, synthetic data, anyone can generate (inflate) ANY Sharpe Ratio by repeatedly applying different trading or investment strategies to the same time series sample!
By definition, purely random data has no discernible structure. Consequently, no method can exist to predict such a sequence - I.e., Sharpe Ratio = 0 must hold in all instances.
Yet, ... See main graph!
In the past It has been shown just how easy it is to generate Sharpe Ratios of 4, 5 or even >6, on any data, including on purely random, synthetic time series data when in fact, the only possible value in those instances should be S.R. = 0.
As a matter of fact, this misleading (self-defeatists?) practice is so common and wide spread in finance and trading that the American Statistical Association considers it "unethical" (American Statistical Association ). (More importantly, it is a remarkably expensive way to fool oneself.)
The above stems from applying the same rejection threshold for the null hypothesis under multiple testing will grossly underestimate the probability of obtaining a false positive.
Unlike in the "other sciences", there is no "replication crisis" in finance or trading, simply because such checks don't even exist there - since those would be impossible to carry out. (Is that why the only two kinds of academic papers which never get revised or retracted are written in the fields of Finance and Theology?)
The bottom line;
In the common case of testing a trading or investment system, given a set of out-of-sample time series, one MUST increase the rejection threshold for the null hypothesis in proportion to the number of times ("peeks") such tests are carried out! (Good luck fooling yourself that way!)
Anything less is just simple curve-fitting!
For more in-depth explorations:
Marcos López de Prado, Michael J. Lewis
codemacher.com

CHFJPY - Wait For The Bears ↘️Hello TradingView Family / Fellow Traders. This is Richard, also known as theSignalyst.
on H4: Left Chart
As per my last analysis (attached on the chart), CHFJPY rejected our 158.5 support and traded higher.
Now CHFJPY is sitting around a strong supply zone so we will be looking for sell setups on lower timeframes.
on M30: Right Chart
CHFJPY is forming a potential double top pattern but it is not ready to go yet.
For the bears to take over, we need a momentum candle close below the gray neckline.
Meanwhile, until the sell is activated, CHFJPY would be overall bullish and can still trade higher.
📚 Always follow your trading plan regarding entry, risk management, and trade management.
Good luck!
All Strategies Are Good; If Managed Properly!
~Rich

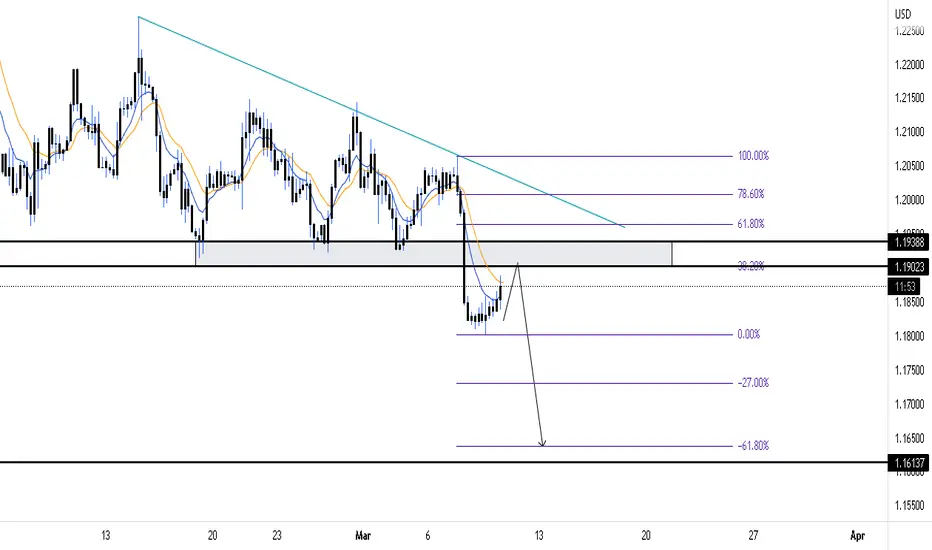
GBPUSD SHORTGBPUSD looking to go short after it rejects a broken support turned into resistance and 38.20% FIB level.
XAUUSDFrom last 2 weeks gold is been on enormous bullish trend. Currently PM is trading at strong supply zone. If this time gold rejected from supply it will head much more to downside.
what you guys think of it ?

AAVE will continue his falling?!BITGET:AAVEUSDT touched the Lower High's trendline and immediately went back down for a -4,56% (respect the +11% that was made before).
This means that BITGET:AAVEUSDT rejected the trendline and went back.
This could indicate that BITGET:AAVEUSDT could go short again for some time, in the extreme case it could touch again the blue support.
Or BITGET:AAVEUSDT could retest the trendline and even break it and go up to +100$ or even more.

GBPAUD I Short term move downward Welcome back! Let me know your thoughts in the comments!
** GBPAUD Analysis - Listen to video!
We recommend that you keep this pair on your watchlist and enter when the entry criteria of your strategy is met.
Please support this idea with a LIKE and COMMENT if you find it useful and Click "Follow" on our profile if you'd like these trade ideas delivered straight to your email in the future.
Thanks for your continued support!
