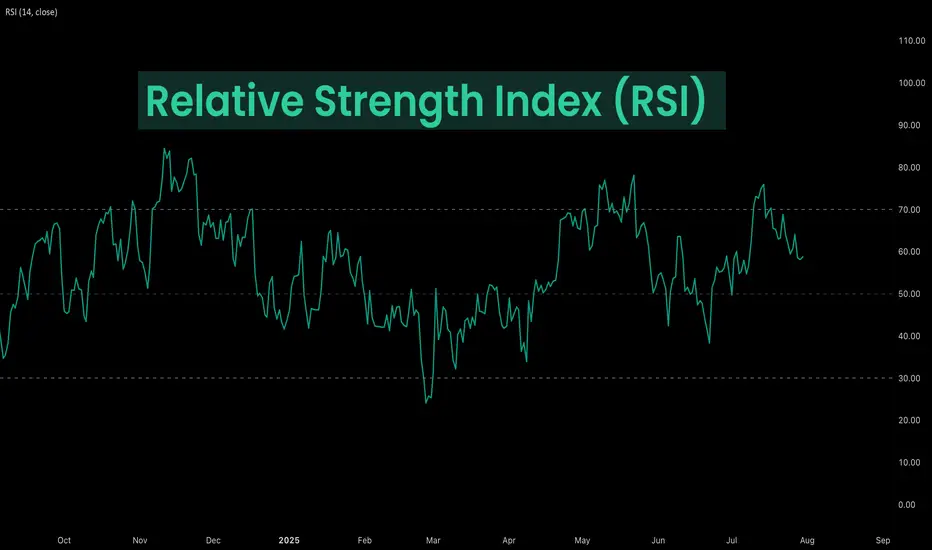
Deep Dive Into Relative Strength Index (RSI)The Relative Strength Index (RSI) is a momentum oscillator developed by J. Welles Wilder Jr. that measures the speed and magnitude of price changes.
Introduction
In the world of trading, timing is everything — and few indicators have stood the test of time like the Relative Strength Index (RSI). Introduced by J. Welles Wilder in 1978, the RSI is a momentum oscillator that helps traders evaluate the strength and speed of price movements. Whether you're trading stocks, forex, or crypto, understanding how RSI is calculated and how to interpret its signals can give you a critical edge.
In this article, we’ll break down exactly how the RSI works, explore its formula, and dive into practical ways you can incorporate it into your trading strategies. From spotting potential reversals to identifying overbought and oversold conditions, the RSI remains a cornerstone of technical analysis — but only if you know how to use it properly.
Let’s explore the mechanics and the mindset behind this powerful indicator.
What Is RSI and How Is It Calculated?
The Relative Strength Index (RSI) is a momentum oscillator that measures the speed and change of price movements over a defined period. It outputs a value between 0 and 100, which helps traders determine whether an asset is overbought or oversold.
The default RSI setting uses a 14-period lookback window and is calculated with the following steps:
🔷Calculate the average gain and loss over the last 14 periods:
Average Gain = Sum of all gains over the past 14 periods / 14
Average Loss = Sum of all losses over the past 14 periods / 14
🔷Compute the Relative Strength (RS):
RS = Average Gain / Average Loss
🔷Apply the RSI formula:
RSI=100−(100/(1+RS))
The result is a single number between 0 and 100 that indicates the asset's momentum.
How to Use RSI in Trading Strategies
⚡️Overbought and Oversold Conditions Strategy
RSI > 70 typically signals that an asset may be overbought and due for a pullback.
RSI < 30 suggests the asset might be oversold, potentially primed for a bounce.
However, these levels aren’t absolute sell or buy signals. In strong trends, RSI can stay overbought or oversold for extended periods.
📈Long Trading Strategy Example:
1. Identify the major trend, to find the long trades it shall be uptrend. On the screen below you can see 1D time frame for BITMART:BTCUSDT.P .
2. Move to lower time frame (in our case 4h) and find the moment when RSI falls below 30. This is our oversold condition and we are going to look for long trade.
3. Find the local support zone and open long trade.
4. Take profit when price reaches resistance level next to the previous swing high
5. Don’t forget to put initial stop loss when enter position. The best stop loss which will give you 3:1 risk to reward ratio.
📉Short Trading Strategy Example
1. Identify the major trend, to find the short trades it shall be downtrend. On the screen below you can see 1D time frame for BITMART:ETHUSDT.P .
2. Move to lower time frame (in our case 4h) and find the moment when RSI grows above 70. This is our overbought condition and we are going to look for short trade.
3. Find the local resistance zone and open short trade.
4. Take profit when price reaches support level next to the previous swing low
5. Don’t forget to put initial stop loss when enter position. The best stop loss which will give you 3:1 risk to reward ratio.
⚡️RSI Breakout Strategy
RSI is breaking through 60 indicating bullish momentum shift if the long-term trend is bullish can be the potential long signal
RSI is breaking down 40 indicating bearish momentum shift if the long-term trend is bearish can be the potential short signal
This strategy works great only on the trending market, don’t use it on the range bounded market to avoid whiplashes.
📈Long trading strategy example:
1. Make sure that long-term trend is bullish. Use 200 period EMA as its approximation. If price remains above it we can look for potential long trade setup.
2. If RSI crossed above the level 60 open long trade.
3. Put the initial stop-loss under the signal candle’s low.
4. Take profit when price reached 3:1 risk-to-reward ratio.
📉Short trading strategy example
1. Make sure that long-term trend is bearish. Use 200 period EMA as it’s approximation. If price remains below it we can look for potential short trade setup.
2. If RSI crossed below the level 40 open short trade.
3. Put the initial stop-loss above the signal candle’s high.
4. Take profit when price reached 3:1 risk-to-reward ratio. In our case we received very fast and profitable trade
⚡️RSI Divergence Strategy
RSI can be used also as a trend reversal indicator if we are looking for divergences. This is very reliable sign of current trend weakness and great opportunity open trade against the trend. Usually it’s not recommended, but in case if divergence can be applicable.
Bullish divergence is the situation when price created the lower low, while RSI made the lower low. Usually, it indicates that current downtrend is weakening and we can look for long trades
Bearish divergence is the situation when price created the higher high, while RSI made the lower high. Usually, it indicates that current uptrend is weakening and we can look for short trades
😎Important hint: it’s rarely covered in textbooks about technical analysis, but in our opinion it’s better to used divergences when RSI was able to cross level 50 between two lows/highs.
📈Long trading strategy example
1. Find at the chart situation, when the price made the lower low
2. At the same time RSI shall set the higher low
3. RSI shall break level 50 between these lows indicating shift to the bullish momentum
4. If price failed to set the clean breakdown open long trade on the candle which set the lower low. Put stop loss under it’s low
5. Take profit at 3:1 RR. When you master this concept, you will be able to have much more RR trades, even 10:1. This is possible because when trend finish you have the highest potential upside
📉Short trading strategy example
1. Find at the chart situation, when the price made the higher high
2. At the same time RSI shall set the lower high
3. RSI shall break level 50 between these highs indicating shift to the bearish momentum
4. If price failed to set the clean breakout open short trade on the candle which set the higher high. Put stop loss above it’s high
5. Take profit at 3:1 RR. When you master this concept, you will be able to have much more RR trades, even 10:1. This is possible because when trend finish you have the highest potential upside
Conclusion
The Relative Strength Index (RSI) remains one of the most powerful and flexible tools in a trader’s technical arsenal — but its real value lies in how you use it.
We’ve explored three key RSI strategies:
✅ Overbought/Oversold setups offer simple entry signals in ranging markets, where price tends to revert to the mean.
✅ Breakout strategies unlock RSI’s momentum-tracking potential, helping you ride strong directional moves with confidence.
✅ Divergence detection reveals hidden shifts in market sentiment, giving you an early warning of possible reversals or trend continuations.
Each approach has its strengths — and its risks — but together, they offer a complete framework for using RSI across different market conditions
🔑 Key Takeaways:
RSI is not just a “buy low, sell high” tool — it’s a multi-dimensional indicator that adapts to trends, momentum, and market structure.
The best RSI signals come from confluence: combining RSI with price action, support/resistance, volume, or trend filters like moving averages.
Patience and discipline are essential — RSI signals are only effective when paired with proper risk management and confirmation.
By mastering RSI beyond the basics, you'll be better equipped to make timely, confident, and informed trading decisions — whether you're entering a pullback, chasing a breakout, or spotting the early signs of reversal.
Relativestrength
AGL (Long) - Bucking the overall market trendAs I was scrolling through many many charts, I realized its very difficult these days to find a stock that trades on its own accord, without copying the (very volatile) path of the overall market. But I managed to find one which showed almost no correlation to the recent frenzy - NYSE:AGL
Fundamentals
The underlying fundamentals of NYSE:AGL are difficul t to say the least, though getting better - hence the recent bump in the share price on the back of a few upgrades from analysts
With a P/S of 0.4 we can confidently say the valuation is low, but we can't really blame the investors for taking the share price down - despite an amazing growth rate (from 4.3bn in 2023 to 6bn in 2024), the firm is unable to keep its costs and cash position in check
With 6bn in revenue , the firm wasn't able to turn a positive gross profit(!)
So, I wouldn't look at it yet as a long-term play, though if the firm can put its finances in order, it could be a large player in the definitely-not-getting-smaller space of senior healthcare
But the short-term momentum is intruiging
Technicals
First thing to note is that fascinating bifurcation from the broader market (see the relative strength indicator on the weekly); NYSE:AGL was nicely treading 6% higher today while AMEX:SPY was bleeding 7% - I appreciate stocks like that during these volatile days
Plus,it has momentum - a couple of upgrade sent the stock surging and there is a gap to fill, which I would like to take advantage off
Other than that, it doesn't really scream buy, so I am not going to sell it as a high-conviction play (no usual accumulation patterns :/) - I am currently looking at it as a diversification play with a momentum tailwind
Trade
I bought it on the recent pop higher and plan to hold until it breaks the little bottom it created after it surged (red line)
I don't plan to marry the stock for longer, I will give it one chance and if it breaks, then I retreat - potential holding time is about a month , or about 5 U-turns in the US tariff policy
The stock can be still entered with the same stop/loss but a slightly worse risk/reward
Follow me for more analysis & Feel free to ask any questions you have, I am happy to help
If you like my content, Please leave a like, comment or a donation, it motivates me to keep producing ideas, thank you :)

How to Use RSI for Buy & Sell Signals! The Relative Strength Index (RSI) is a momentum indicator that helps traders identify overbought and oversold market conditions. It ranges from 0 to 100, with two key levels:
✅ RSI < 30 → Oversold: The asset is potentially undervalued, indicating a buying opportunity.
🚨 RSI > 70 → Overbought: The asset is potentially overvalued, signaling a potential sell-off.
How to trade it?
- When RSI drops below 30 and then moves back up, it suggests a bullish reversal (see green arrows).
- When RSI goes above 70 and then turns down, it signals a potential downtrend (see red arrows).
How long should you hold your position?
A great tip is to stay in the trade until RSI approaches the opposite extreme. For example:
- If you enter when RSI is below 30, hold until it nears 60-70 for an optimal exit.
- If you sell when RSI is above 70, you can hold a short until it drops near 40-30.
In the chart, you can see how the RSI accurately predicted major turning points in the market!
⚠️ Pro Tip: RSI works best when combined with other indicators like volume or moving averages to confirm signals!

JUPUSDT Swing Long IdeaJupiter is the second largest DEX on Solana and its price has been ranging for almost 1 year.
If all of crypto is getting ready to bounce JUP looks primed to breakout of the range,
RSI is crossing above the RSI MA and midpoint,
MFI is crossing above the midpoint,
JUP has outperformed TOTAL according to MA Based relative performance,
We recently saw the largest ever volume and volume MA.
All of this makes me think JUP wants to breakout from this range soon, hopefully TOTAL and BTC will allow that to happen.

Firstsource solution 1 day chart suggesting bullish breakoutFirstsource sloution is looking in the uptrend .
Trendline is forming from 300 price levels to 360 . suggesting uptrend
Volume is Supporting in this uptrend .
RSI momentum is showing with breakout today. Signaling bullish momentum.
If price closed above 388 on daily chart further bullish Moment can be expected .
If price closed below 355 which is previous swing low on daily chart further bearish Moment can be expected .

TG Therapeutics forming 3rd baseIs a company that develops and commercializes novel treatments for B-cell diseases
The stock initiated a bull trend at the end of 2023 after a breakaway gap and has gained +90% during 2024 and gave 2 opportunities to buy on breakouts
Now is forming a 3rd base and may give another opportunity to enter, all this while relative to its sector AMEX:XLV is making new highs
According to IBD is not among the industry leaders, but it has a 96 Relative Strength Rating against the SP:SPX

BDL - On the Recovery ModeCurrently we can see many of stocks which had substantially come down from their highs are in the recovery mode. We will be covering some of these in the coming few days. We will start with the first one which is Bharat Dynamics Ltd.
The stock saw a bearish down move of more than 15% and ended up below the 200 DMA. Now it looks like it is on the recovery mode. It has crossed above the 200 DMA and the short-term moving averages. Also, it has broken the supply line as well. We can see good volume support coming in. All key parameters like the relative strength, money flow, buying pressure and the volume adjusted momentum all seem to be favouring the up move. The stocks saw a quick up move, then it saw a small consolidation and has started resuming the up move. We can see a break of structure on the daily time frame. Now the stock is making a higher high and higher low structure and is likely to continue the up move. We could see a substantial up move and the stock could test the previous high of 1770. Of course, the overall market situation should also support the move. However, the downside is now capped and we can see more upside only.

HUDCO - On the recovery Path ? The next recovery stock which we are going to look at is HUDCO or the Housing and Urban Development Corporation Limited. The stock saw a drop or reversal of 15% and was pushed below the 200 DMA and from there it has been recovering. As you can see now, it is above the 200 DMA and also the short-term moving averages. It has started making a higher high on the daily. It is also making a higher high on the weekly as well. All the supporting key parameters are all positive, the relative strength, the money flow, buying pressure, all are quite positive and is supporting further up move. We can see good increase in the delivery volumes indicating committed buying. So, the stock could test the previous high of 350 levels. Of course, it is not going to be a quick up move, it is going to be a grinding up move, but definitely it is likely to move up. The risk reward ratio also is looking quite good at this moment. So, this is a stock to be watched.

BTC Trading in Price Discovery Zones (Price analysis)Bitcoin in Price Discovery: Understanding and Trading in Uncharted Territory
When Bitcoin or any asset reaches an all-time high (ATH), it enters a phase known as price discovery. In this phase, the market operates without historical price references, navigating uncharted territory to determine fair value. For traders and investors, this presents both an opportunity and a challenge. Employing techniques like Elliott Wave Theory and analyzing price and volume dynamics can help strategize trades during this unique phase.
What is Price Discovery?
Price discovery occurs when an asset ventures into price levels it has never reached before—most often at its ATH. Without prior data for resistance or support, the market relies on demand, supply, and speculation to set new price benchmarks. Understanding how price reacts in this phase requires both macro and micro analysis.
Elliott Wave Theory in Price Discovery
Elliott Wave Theory offers a framework for understanding market psychology and price movements. In the context of price discovery, the B Wave of an Elliott Wave formation plays a pivotal role:
Identifying the B Wave and Pullback Zones
The B Wave represents a pullback into a range after an impulsive move upward (Wave A).
Mark the peak of the impulsive move (A) and the bottom of the pullback (B).
Project this range forward in time to identify potential support zones.
Support Zones in Price Discovery
The previous high (Wave A peak) forms the top of the support zone.
The B Wave low forms the bottom of the support zone.
Once the price pulls back into this zone, it signals a potential retest of the support, offering opportunities for reentry into the trend.
Drilling Down: Smaller Timeframes for Confirmation
When Bitcoin retests these support zones, zoom into smaller timeframes to assess price reaction and volume behavior. Look for:
Bullish Change in the State of Delivery: This includes higher highs and higher lows, increased buying volume, and bullish candlestick patterns such as engulfing candles or hammer formations.
Volume Confirmation: Strong volume on upward moves and decreasing volume during pullbacks indicate sustained bullish momentum.
At these support zones, the price is likely to resume its bullish trend if the market shows these signs of strength.
Managing Risk in Price Discovery Zones
Despite bullish setups, price discovery is volatile, and false breakouts can occur. To safeguard trades:
Watch for Fair Value Gaps (FVGs)
Look for large, unfilled price gaps from prior resistance areas.
These gaps might signal areas where the price could retrace deeper before confirming support.
Adjust Entries and Stop Losses
If price breaks below the initial support zone (top of Wave A), it may retest the bottom of the B Wave for further consolidation.
Set stop losses below the bottom of the B Wave to protect against unexpected reversals.
Evaluate Volume-Driven Moves
Weak volume during a retest could indicate insufficient demand to support the price, suggesting a deeper pullback or reversal is more likely.
--------------------------
Price discovery is one of the most exciting and rewarding phases for traders who know how to approach it. By using Elliott Wave Theory, you can pinpoint key support zones, especially around the B Wave pullbacks, and then confirm your setups by analyzing price action and volume.
The key here is patience and precision. Let the price come to those critical zones you’ve marked, watch how it reacts, and make your move confidently. Stay flexible, though—price discovery is unpredictable, and managing your risk is crucial if you want to make the most out of this high-potential phase in Bitcoin’s journey.

BLS INTL SERVICES - Ready for a short term Up MoveThe stock had undergone a big correction even before the recent small cap index correction. The stock fell almost 28% from 475 to 340. It was pushed below the 200 DMA, from where it has been recovering. Even during the recent correction in the small cap index, the stock was in fact showing lot of strength and the relative strength compared to the small cap index is positive now. It is also making higher highs in the daily frame while it is still continuing to make the higher highs and higher lows in the weekly time frame as well. Now, it has also crossed above the short-term moving averages and the previous daily pivot. So, the stock looks likely to test 475 levels. So, I am looking at 15% returns in the short term from the stock. Of course, one has to always keep in mind the overall market weakness.

BOMBAY DYEING - Ready to Move to the Next OrbitThe stock after facing price rejection in the range of 224 to 241 was pushed down to the 50 DMA. It moved almost sideways in the last three months. Recently we saw some interest coming back into the stock with the relative strength and the money flow turning positive and the volume was also increasing. The stock remained very strong during the recent weakness we saw in the overall market. Now finally it has crossed above the price rejection zone with good volume support. The delivery volumes saw substantial increase recently. All other parameters like the buying pressure, volume adjusted momentums, absolute momentum everything seem to be favouring further up move. Looks like the stock is ready to move to the top into the next orbit.

EUR/JPY: Tight range when other EUR-pairs are weak. HmmmDo you trade
A) Before the breakout for a better price OR
B) After the breakout for confirmation ?
We usually prefer B)
But it helps to think through some scenarios that could happen beforehand
Looking at EUR/JPY - see how it is trading in a tight range?
Well other EUR pairs like EUR/USD have been falling. That shows relative strength .
Or put another way - the yen is relatively weak.
The price could just break straight to the topside - or it could first try to break lower in a fakeout - before breaking to the topisde.
If the latter does happen - it will be one of those occations we could trade before the =breakout ;)
What do you think happens?
Maybe the trend turns lower - and neither scenario above is right - could easily be.

TDPOWER SYSTEMS - Likely to resume the Up Trend?The stock was in an uptrend and met with some price rejection in the range of 436 to 451, then it was pushed down to below 50 DMA. Then we saw some strength coming back below the 50 DMA and then today we saw an “Effort to move up” bar. Now the price is at the supply line and once the supply line is broken then we can see the stock testing the previous rejection zone and with some momentum it could take out the Price Rejection Zone and move up. Now the buying pressure and the money flow are positive while the relative strength is on the verge of turning positive. There is some good volume support as well. We also could see some committed buying coming in terms of delivery volumes. So, looks like the momentum is building up and this should see a stock being pushed up to test the rejection zone and further up. In other words the stock look likely to resume the Up Trend.

Swing Trade Set UPA simple, Swing Trade Set UP. Often it is simple trade setup that make lots of money. This is one such set up. Here trend is captured with alignment of MA's . 3 MAs are plotted EMA-10, EAM-21 and SMA 50. To pick the trend, first condition is EMA-10 > EMA-21 > SMA 50. Second condition is price above all these MAs. In the chart it is marked wherever this occurred.
Now to make entry you have to wait till the stock out performs the Index. It can be captured through plotting a indicator named RS or Relative strength. use Bench mark index as #NIFTY50 or #CNX500.
You can see that there are areas where MAs aligned but RS was negative and trend failed. But when all these aligned price moved up nicely. You can exit the trade on deceive break of EMA 21 or SMA 50.
Try this on many charts and lean the nuance before making actual trade.

Infrastructure surgingUS Infrastrucutre AMEX:IFRA has been leading the global industry NASDAQ:IGF since it peaked in April of 2022
But, since this august global diversification has been outperforming american companies
Sometimes is good to look outside the US market

Cup and Handle - Tata ConsumerCup and Handle Observed in Tata Consumer. Once can enter on Trendline Breakout

"IDFC" longing to take lead!"IDFC" is showing immense strength on the hourly Time Frame. Forming patterns of price accumulation since past two days. The counter has great risk - reward ratio! If the Banking sector supports, IDFC could be one of the leading counters.
#SniperTrade #Momentum #Options #CapitalMarkets #harshal95 #StockMarket

RADICO - In to the next orbit ?The stock has been moving almost sideways with a upward bias for the last eight months. However, recently you can see that in the weekly it has been making a higher, high and higher lows. Now the stock has successfully moved out of this sideways range and also it has crossed above the supply line in the top. The move was with very high volumes. You can see a positive money flow in the weekly. On the daily you can see that the relative strength, absolute strength and the money flow has been positive. So, it looks like that stock is now ready to go into the next orbit. However, the ultra-high volume calls for some caution. So, one has to wait till the stock crosses above 1973 which is a high of the “BC” like bar of the last day. Relative strength turning positive on the weekly will add to the conviction.

UPL - Finally out of the woods?The stock had been in a downtrend for more than 15 months, losing almost 45% in value. In the last three months it was seeing some recovery and finally now it seems to be out of the woods. We can see the stock is making a higher high and higher low on the weekly and we can see a change of character in the weekly as well. Now finally the stock is decisively going above the 200 DMA and also the short-term moving averages. The relative strength and the money flow is also positive. Even the buying pressure and the absolute strength are also positive. It is showing a positive momentum as well. We can now confirm that the stock is finally ready to move up further and eventually the stock should be testing 800 levels.

ADFFOODS - CUP FORMATIONCup formation seen in ADFFOODS.
Entry - 262
SL - 10%
TGT - 345
REASONS:
1. RS > 50
2. RS - POSITIVE

SYNGENE - Gearing up for higher MoveThe stock after nearly 10 months of consolidation had come out of the consolidation zone and now it is attempting to take out the previous supply zone as well. As we can see in the weekly chart, the relative strength and the money flow index are positive. In the daily chart as well, you can find the relative strength, the buying pressure are all positive. However, the money flow has not picked up. Given these conditions, once the money flow also picks up, the stock is likely to go up higher after breaking out of the price rejection zone or the supply zone. A positive close above 858 level, will add to the conviction.

INOXWIND potential breakout 6 months long base
Out of the base pullback entry
Low risk entry point
High relative strength

MINDA CORP - Gearing up for More Upside ?After almost two months of side ways move the stock is on the verge of taking out the previous Price Rejection Zone. My checklist all ticked right
Relative Strength
Buying Pressure
Increased volume
Money Flow
Absolute Momentum
Increased Delivery volumes
There is a high probability of the stock moving into the next Higher trajectory. A positive close above 527 will add more conviction.
