EUR/USD Maintains Steady Upward Trend Amid Softening USDEUR/USD maintains an upward channel oscillating around the 1.0700 level. The weakening strength of the USD is gradually paving the way for a gentle rise in this currency pair.
From a technical standpoint, we observe that EUR/USD continues to hold above the simple moving averages (SMA), while the relative strength index (RSI) remains around the 60 mark, indicating stability in the upward trend.
Expectations for further price increases in this pair will encounter a resistance level at 1.0714, potentially shaping the trajectory of its future upward movement.
Relative Strength Index (RSI)

Gold Stability Amidst Rising US YieldsGold remains stable amidst a downward trend, given the backdrop of rising US yields. Reduced tensions in the Middle East contribute to market stability, albeit dampening the demand for gold.
Looking at the one-hour chart, it's evident that gold's potential for price appreciation is still constrained. The Relative Strength Index (RSI) has solidified around the 40 mark, indicating a significant decline in upward momentum within the downtrend. Furthermore, the formation of a triple top pattern along with substantial price declines also signals a clear phase of market weakness.

Symmetrical Triangle Breakout - NETWEB📊 Script: NETWEB
📊 Sector: IT - Software
📊 Industry: Computers - Software - Medium / Small
Key highlights: 💡⚡
📈 Script is giving Symmetrical Triangle Breakout on 18th April but there was no rally todays candle is giving breakout of that little consolidation so we may see some good rally.
📈 Script is trading at upper band of BB.
📈 MACD & Double Moving Averages are giving crossover .
📈 Right now RSI is around 61.
📈 One can go for Swing Trade.
⏱️ C.M.P 📑💰- 1730
🟢 Target 🎯🏆 - 1890
⚠️ Stoploss ☠️🚫 - 1664
⚠️ Important: Always maintain your Risk & Reward Ratio.
✅Like and follow to never miss a new idea!✅
Disclaimer: I am not SEBI Registered Advisor. My posts are purely for training and educational purposes.
Eat🍜 Sleep😴 TradingView📈 Repeat 🔁
Happy learning with trading. Cheers!🥂

Crossover Trade - TEXRAIL📊 Script: TEXRAIL
📊 Sector: Capital Goods-Non Electrical Equipment
📊 Industry: Engineering
Key highlights: 💡⚡
📈 Script is trading at upper band of BB.
📈 MACD is giving crossover .
📈 Double Moving Averages are giving crossover.
📈 Right now RSI is around 57.
📈 One can go for Swing Trade.
⏱️ C.M.P 📑💰- 178
🟢 Target 🎯🏆 - 197
⚠️ Stoploss ☠️🚫 - 170
⚠️ Important: Always maintain your Risk & Reward Ratio.
✅Like and follow to never miss a new idea!✅
Disclaimer: I am not SEBI Registered Advisor. My posts are purely for training and educational purposes.
Eat🍜 Sleep😴 TradingView📈 Repeat 🔁

Market Caution And Challenges EUR/USDThe EUR/USD market is stabilizing around the 1.0700 level after a positive day on Tuesday. However, PMI data from the US dampened the value of the US dollar that day, pushing up the EUR/USD price.
At the beginning of Wednesday, the market showed more caution and supported the USD, posing challenges to the rise of EUR/USD.
However, despite the market's caution, technical indicators like SMA and RSI indicate that the upward trend is still maintained. The Relative Strength Index (RSI) remains above 50, indicating the strength of the current upward trend. Expectations are for the EUR/USD to continue stabilizing and potentially increasing in the near future.

EUR/USD Holds Steady at 1.0700 Level with Positive IFO DataIn the European trading session on Wednesday, the EUR/USD pair continued to close steadily around the 1.0700 level. Positive sentiment from Germany's IFO psychological data helped stabilize the Euro.
On the 4-hour chart, despite recent price declines, the Simple Moving Average SMA 20 remains above the SMA 50 after completing a bullish crossover on Tuesday. Additionally, the Relative Strength Index (RSI) consistently stays above 50.

AUD/USD Rises on Hotter than Expected AU InflationAUD/USD rises today as inflation data from Australia came in higher than anticipated. March CPI accelerated for the first the first time in months (+3.5% y/y), Q1 rose 1% q/q (from +0.6% prior) and on a yearly basis it came in at 3.6%, which was above forecast.
The Reserve Bank of Australia has refrained from raising rates for the past three meetings and has hinted at peak rates, but has not ruled out further hikes and seems far from cuts. Its US peer on the other hand, has pointed to multiple rate cuts this year, despite adopting a conservative approach.
The hotter than expected inflation report makes an RBA pivot less likely and boosts AUD/USD further. It had already made a strong start to the week, since the contraction in US manufacturing activity offered a sign of weakness for the US economy that could help the Fed lower interest rates. The pair tries to take out the EMA200 that could pause the bearish bias and give it the opportunity to challenge the March highs (06668).
However, the immediate upside appears unfriendly, with multiple roadblocks and the Relative Strength Index points to overbought conditions. Furthermore, the recent hawkish repricing around the Fed’s policy path will likely continue to weigh on the pair, while Australia’s Q1 y/y inflation showed further moderation.
As such, AUD/USD is likely to face renewed pressure that can lead to new 2024 lows (0.6362), although sustained weakness towards and beyond 0.6269 does not look easy.
Stratos Markets Limited (www.fxcm.com):
CFDs are complex instruments and come with a high risk of losing money rapidly due to leverage. 68% of retail investor accounts lose money when trading CFDs with this provider. You should consider whether you understand how CFDs work and whether you can afford to take the high risk of losing your money.
Stratos Europe Ltd (trading as “FXCM” or “FXCM EU”), previously FXCM EU Ltd (www.fxcm.com):
CFDs are complex instruments and come with a high risk of losing money rapidly due to leverage. 73% of retail investor accounts lose money when trading CFDs with this provider. You should consider whether you understand how CFDs work and whether you can afford to take the high risk of losing your money.
Stratos Trading Pty. Limited (www.fxcm.com):
Trading FX/CFDs carries significant risks. FXCM AU (AFSL 309763). Please read the Financial Services Guide, Product Disclosure Statement, Target Market Determination and Terms of Business at www.fxcm.com
Stratos Global LLC (www.fxcm.com):
Losses can exceed deposits.
Any opinions, news, research, analyses, prices, other information, or links to third-party sites contained on this video are provided on an "as-is" basis, as general market commentary and do not constitute investment advice. The market commentary has not been prepared in accordance with legal requirements designed to promote the independence of investment research, and it is therefore not subject to any prohibition on dealing ahead of dissemination. Although this commentary is not produced by an independent source, FXCM takes all sufficient steps to eliminate or prevent any conflicts of interests arising out of the production and dissemination of this communication. The employees of FXCM commit to acting in the clients' best interests and represent their views without misleading, deceiving, or otherwise impairing the clients' ability to make informed investment decisions. For more information about the FXCM's internal organizational and administrative arrangements for the prevention of conflicts, please refer to the Firms' Managing Conflicts Policy. Please ensure that you read and understand our Full Disclaimer and Liability provision concerning the foregoing Information, which can be accessed via FXCM`s website:
Stratos Markets Limited clients please see: www.fxcm.com
Stratos Europe Ltd clients please see: www.fxcm.com
Stratos Trading Pty. Limited clients please see: www.fxcm.com
Stratos Global LLC clients please see: www.fxcm.com
Past Performance is not an indicator of future results.

Crossover Trade - SOLARA📊 Script: SOLARA
📊 Sector: Pharmaceuticals
📊 Industry: Pharmaceuticals - Indian - Bulk Drugs
Key highlights: 💡⚡
📈 Script is trading at upper band of BB and giving breakout of it.
📈 Already Crossover in Double Moving Averages and MACD.
📈 Right now RSI is around 61.
📈 One can go for Swing Trade.
⏱️ C.M.P 📑💰- 440
🟢 Target 🎯🏆 - 474
⚠️ Stoploss ☠️🚫 - 425
⚠️ Important: Always maintain your Risk & Reward Ratio.
✅Like and follow to never miss a new idea!✅
Disclaimer: I am not SEBI Registered Advisor. My posts are purely for training and educational purposes.
Eat🍜 Sleep😴 TradingView📈 Repeat 🔁
Happy learning with trading. Cheers!🥂

Technical Analysis: EUR/USD Shows Signs of Short-Term Recovery EUR/USD has experienced a significant momentum shift, surging above the 1.0650 level at the start of the European trading session. The short-term technical outlook for this currency pair indicates a gathering momentum for recovery.
On the 4-hour chart, we observe the price closing above both the 20-period and 50-period Simple Moving Averages (SMAs), along with the Relative Strength Index (RSI) surpassing the 60 mark. This reflects a positive shift in the short-term outlook for EUR/USD.
However, the price is still maintaining its downward trend, and sustaining above the SMAs may only represent a temporary phase. It is conceivable that the price will continue to test and trade below these SMA levels in the near future.

Gold Market Analysis: Gold Continues Downward Trend Gold extended its downward momentum at the start of Tuesday's Asian trading session, dropping to 2,300, down more than 2% from Monday. The decline seemed somewhat contained due to speculation that major central banks would cut interest rates later this year.
From a technical standpoint, this sharp decline has brought gold prices to touch the simple moving averages (SMA), along with the Relative Strength Index (RSI) hovering around oversold territory, nearing the 28 mark.
However, as the downward momentum of gold prices has reached a significant level, there are indications of a correction. It is anticipated that gold prices will continue to touch the SMA 20 level before witnessing a recovery from the sharp decline.

📈Technical Analysis: AVAX for Potential Trading Opportunities🚀📈 Comprehensive Analysis of AVAX: Daily Market Insights 📈
☀️In today's analysis, we embark on a journey into the intricacies of Avalanche (AVAX) trading, exploring potential avenues for profit amid evolving market conditions. As we delve deeper into the dynamics of AVAX, we uncover compelling insights that could shape your trading decisions.
🔍Zooming into the 4-hour timeframe, AVAX witnessed a noteworthy retracement following its ascent to the $63.78 mark, experiencing a 50% pullback. However, the retracement lacked significant bearish momentum, hinting at underlying strength within the market. This suggests the potential for a bullish continuation, with a promising trigger emerging on the horizon.
📉Amid recent market volatility, AVAX found reliable support around the $33.13 level, followed by a rebound and subsequent retracement to the 0.382 Fibonacci level. Despite minor fluctuations, the prevailing sentiment leans towards optimism, as sellers struggle to exert sustained downward pressure. This sets the stage for potential long positions, contingent upon buyer confirmation.
📊While current volume levels remain subdued, reflecting typical weekend trading patterns, there's a modest uptick compared to previous sessions. However, volume alone fails to decisively affirm the direction of the trend. Meanwhile, RSI presents a noteworthy signal around the 65.43 mark, indicating the potential for overextension and signaling bullish momentum if surpassed.
💡For traders eyeing short-term opportunities, consider a long entry upon breaching the $39.28 threshold, coinciding with the 0.5 Fibonacci level and offering confirmation of bullish momentum. Patience is key as volume dynamics unfold, potentially affirming buyer conviction. Additionally, monitor for a potential short entry below $33.13, particularly as the SMA99 converges with candlesticks, hinting at potential bearish momentum.
📝As we navigate the complexities of the AVAX market, it's imperative to remain vigilant, adapting your strategy in response to evolving market dynamics. The current landscape presents an array of opportunities for astute traders to capitalize on potential price movements. Stay tuned for ongoing updates and insights as we continue to dissect the intricacies of AVAX trading.
🧠💼It's important to acknowledge the inherent risks in futures trading, with the potential for margin calls if risk management is neglected. Always adhere to strict capital management principles and utilize stop-loss orders, ensuring that the initial target offers a risk-to-reward ratio of 2

Gold Market Volatility:Gold Prices Extend Significant DropYesterday, the gold market experienced significant volatility, with prices falling below $2,400 and continuing to decline below $2,300 during Tuesday's Asian trading session. This decline was triggered by escalating tensions between Israel and Iran. Market participants are betting that the ECB will cut interest rates in June, with three rate cuts expected throughout the year.
Technically, gold prices show signs of correction towards the Simple Moving Average SMA 20 around the 0.5-0.618 Fibonacci level. However, gold prices are currently supported by downward trend technical indicators, with prices trading below the SMA and the Relative Strength Index (RSI) in oversold territory, indicating strong downward momentum.

Technical Analysis: USD/JPY Increase Price OutlookThe Japanese Yen is currently receiving support from government intervention, but differing expectations from the Bank of Japan (BoJ) and the Federal Reserve (Fed), along with reduced tensions in the Middle East, have diminished JPY's role as a safe haven asset.
From a technical standpoint, indicators continue to signal an upward trend. The Relative Strength Index (RSI) is above 60 and prices are trading above simple moving averages (SMA), indicating stability and growth potential for the Japanese Yen in the market.

Market Analysis: Political Tensions Propel Upward TrendOverall, the market has witnessed the continuation of an upward trend as political tensions in the Middle East show no signs of abating entirely.
From a technical standpoint, the Relative Strength Index (RSI) is currently in overbought territory. This is seen as a signal that the market may undergo a short-term recovery before resuming a strong upward trajectory.

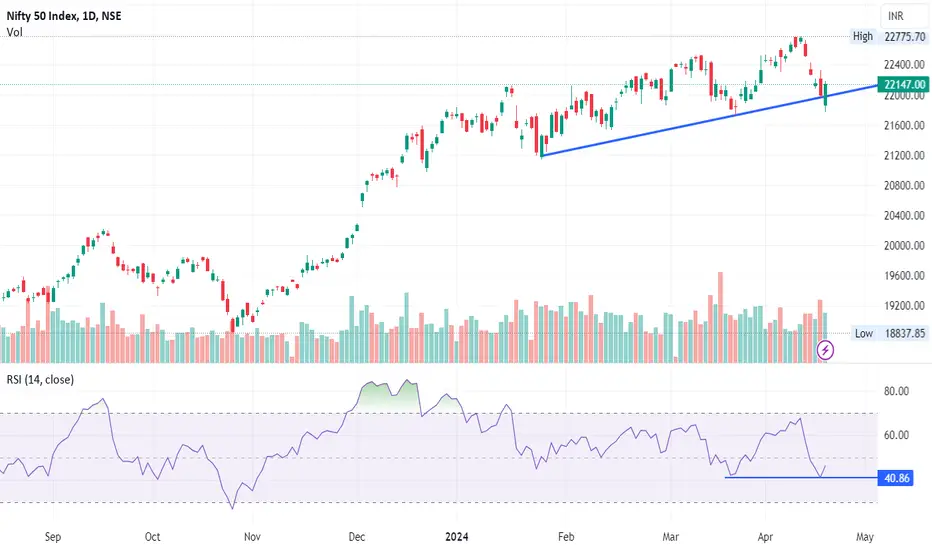
NIFTY DAILY - 19/4/2024Nifty opens gap down almost -150 points but into second half bulls were back into the market and made days high that is 22179.
(which means nifty recover 150 points from bottom and another rally of 150 points which means total nifty recovered by 300 points).
Nifty has formed a big green body candle with long lower shadow and upper shadow, which indicates buyer were buying from day ends.
Index is able to give closing above trendline.
Nifty is taking support around 40 RSI level.
Nifty reclaim 22000 level and able to break the resistance level which was 22152 so further resistance can be 22276 with support of 221936 level.
Today’s Advance Decline ratio of NIFTY50
Advance - 30
Decline - 19
Unchanged - 1
FII Buy + 129.39 crores
DII Sell – 52.50 crores.
⚠️ Important: Always maintain your Risk & Reward Ratio.
✅Like and follow to never miss a new idea!✅
Disclaimer: I am not SEBI Registered Advisor. My posts are purely for training and educational purposes.
Eat🍜 Sleep😴 TradingView📈 Repeat 🔁
Happy learning with trading. Cheers!🥂
📈SAND Futures: Short-Term Trading Analysis⚡️🔍Exploring SAND, a metaverse venture with long-term potential, we shift our lens to short-term trading prospects within SAND futures, scrutinizing a 4-hour timeframe.
📈Beginning with candlestick analysis, SAND witnessed a notable decline post-breaking the 0.5629 support, settling near 0.382, thereby forming a consolidation zone between 0 and 0.382. The duration of this range remains uncertain.
💥RSI, after touching a support level at 13, now stabilizes around 50, signaling a reset amid price stabilization. Await RSI's confirmation as it forms a new structure. Meanwhile, volume diminishes post-reaching the 0.4050 floor, synchronizing with the consolidation phase, implying reduced activity during price correction.
📉For potential short positions, monitor a breach below 0.4050, presenting potential entry points, with an initial target set at 0.3647. Conversely, exercise patience for long positions, awaiting confirmation near 0.4710 or a bullish move followed by a correction.
📝Stay vigilant as SAND's short-term trajectory unfolds, capitalizing on emerging opportunities while navigating market dynamics.
🧠💼It's important to acknowledge the inherent risks in futures trading, with the potential for margin calls if risk management is neglected. Always adhere to strict capital management principles and utilize stop-loss orders, ensuring that the initial target offers a risk-to-reward ratio of 2

Technical Analysis Signals Strong Growth for USD/JPYUSD/JPY is currently maintaining stability around 154.50 amidst unpredictable market fluctuations. According to Reuters, the currency pair reversed losses after a high-ranking official from Iran stated that there is no immediate plan for retaliation against Israel's missile attack on Iran. This has reduced the likelihood of escalating tensions in the Middle East.
Based on technical analysis, the Relative Strength Index (RSI) is trading above 60, indicating signs of strong upward momentum in prices. This reflects optimism and bolstered buying activity in the market, potentially driving USD/JPY prices even higher in the near future.

GBP/USD Recovery, Expected to Extend the Upward MomentumGBP/USD is rebounding towards the 1.2450 level in early Europe on Friday, after testing the 1.2400 mark.
Looking at the chart, we can see an upward trend being established, with prices surpassing the simple moving averages (SMA), indicating the strength of the recovery. Additionally, the Relative Strength Index (RSI) is trading above the 50 level and is expected to reach 60, showing that the growth is being fueled and could develop strongly in the near future.

Chart Analysis: GBP/USD DowntrendGBP/USD is rebounding towards the level of 1.2450 in early Europe on Friday, after testing the level of 1.2400. The GBP/USD pair still maintains its weakness due to the deepening geopolitical tensions, particularly following Israel's attack on Iran.
Looking at the chart, we can see that the price is still maintaining below the SMA line, despite the recovery effort, it faces resistance near the SMA 20 line. Furthermore, the Relative Strength Index (RSI) is trading below the 50 level, signaling that the price may continue its downward trend.

🔥 Bitcoin: Waiting For The Ultimate Trigger To BuyIn this analysis we're going to discuss a very simple trading strategy that will suit your long-term portfolio: buying into extreme weakness.
As seen on the chart, Bitcoin has only been oversold on the daily RSI on three occassions over the past 1.5 years. Every single time this occured it proved to be an extremely profitable entry point.
With Bitcoin seeing quite a sell-off and the halving coming up, I'm going to wait patiently for the RSI to hit daily oversold. I imagine another few red days and the RSI should be <30.
Have some funds ready, because this entry might be the last time you can buy BTC during weakness for a long time.

Potential Sharp Decline Looms for EUR/USD as USD StrengthensThe significant recovery of the US Dollar (USD) has interrupted the EUR/USD's rebound process after it reached a peak around 1.0690 on Thursday. This currency pair declined below the 1.0640 level in Friday's Asian trading session.
Based on technical analysis, the technical indicators are supporting the downward trend. The price of this pair is gradually recovering; however, it is still constrained by the SMA line. Additionally, the Relative Strength Index (RSI) is trading around the 40 level. If the price drops to this level, there is a possibility of a sharp decline.

Gold Surges Past $2,400 After Israel-Iran EscalationThe price of gold has undergone a new wave of increase, surpassing the $2,400 mark in the Asian trading session on Friday following Israel's retaliatory attack on Iran.
Based on technical analysis, we observe that the upward momentum of gold continues after crossing the SMA 20 line. The Relative Strength Index (RSI) trading above the 60 level indicates that the upward trend is developing strongly and may persist in the future.

Gold Shows Signs of Recovery, Targets $2,400 MarkGold experienced a volatile session on Wednesday, dropping to $2,354 in the US trading session. Despite the price decrease, there are signs of a mild recovery. Expectations are high for gold to surpass the $2,400 mark.
Based on technical analysis, the price is gradually recovering and heading upwards. If the price continues to rise and surpasses the 60 level, it could be predicted that the price will reach the psychological threshold of $2,400 and continue its upward momentum to the previously established peak of $2,431.
