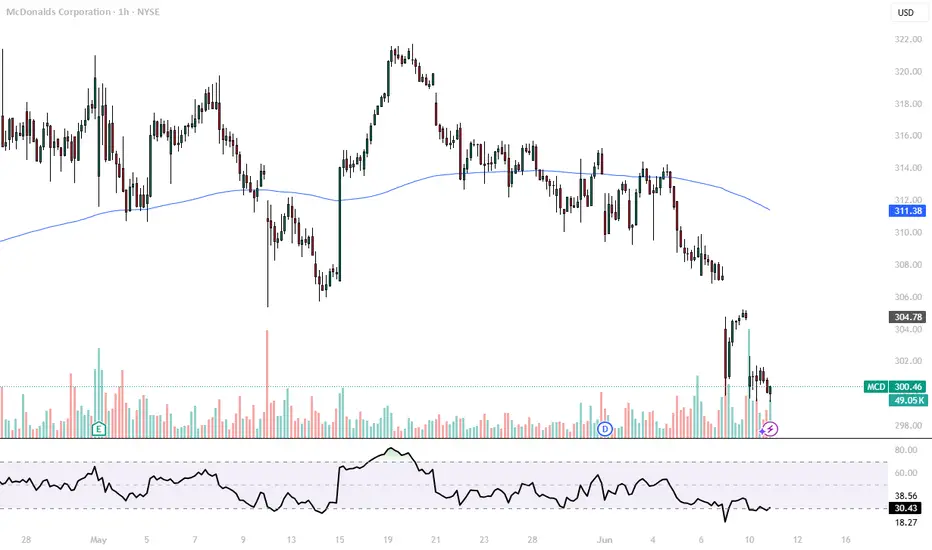
McDonald 1H Long PositionMy self-built strategy has sent me a signal for a long position. I bought a tranche of NYSE:MCD long and will be targeting the upper gaps as my profit targets. The first station will be around $306, and the second target lies between $318 and $319. Currently, the 1H chart is forming a nice divergence and had a huge volume spike, and my strategy indicates a high probability setup for this chart.
Given the current market volatility, I’ll be keeping a close eye on my open position to be able to react quickly if needed.
Relative Strength Index (RSI)
UCAD Bulls Look for 3rd Test After Sept. '24 Highs TouchOANDA:USDCAD Bulls were able to find support at the Sept. 2024 Highs after having traveled down a Falling Support for the past 2 months!
Now we see Bulls pushing price higher creating a Rising Support with 2 tests having been successful and currently coming down for a 3rd test!
Now Price has already broken a Previous Level of Structure which was a Past Resistance on June 4th. This level also lands right at the 34 EMA and based on the Bollinger Bands, this test will also be a Mean Reversion where Price after having traveled in one direction will revert back to the mean of the Bollinger Bands for Continuation, which in this case will be Bullish!
After the 2nd Test of the Rising Support, we can see a Massive amount of Volume enters.
Price also is trading Above the 50 on the RSI and is currently coming down to test that level.
I am looking for Price to test the 1.3683 area and if Price shows support for a 3rd Test, this will be a great opportunity for Long Positions!
Fundamentally, USD will be bombarded heavy news being CPI numbers with analysts forecasting a .2% Increase in Inflation! Also PPI, Unemployment Claims and Prelim UoM Consumer Sentiment & Inflation Expectations.

$TOTAL Crypto Market Cap Meltdown As suspected, a head and shoulders pattern has formed on the CRYPTOCAP:TOTAL Crypto Market Cap.
We could see a big relief rally with the golden cross happening today, but i expect the market to sell off to 2.85T before seeing any real signs of reversal.
RSI also shows more downside ahead on the Daily.

EURUSD Sell SetupEURUSD – Institutional Short Setup 🔻
Timeframe: 1H
Date: June 3, 2025
Strategy: OdinVerse HP – Bank Entry Trap + Supply Stack Breakdown
🧠 Smart Money Logic
🔍 Key Zone Details
🔴 Upper Bank Sell Entry (1.14539 – 1.14337) Final liquidity sweep into major HTF supply – fakeout push before drop.
🔴 Lower Bank Sell Entry (1.14210 – 1.14127) True institutional entry zone. Price retested this zone before rejection.
🔻 Current Reaction Zone Price is rejecting the lower zone with bearish follow-through and structure shift.
🔑 Key Confluences
Fakeout Above Trendline → Trap breakouts at the top of rising wedge.
Double Bank Sell Zones → Clear signs of institutional order stacking.
Market Structure Shift → Clean BOS (break of structure) after retest of lower zone.
Mitigation Complete → Last bullish OB fully mitigated, turning supply active.
Daily EQM Sweep → Targeting imbalance & unfilled FVGs below (1.1285 to 1.1200).
🎯 Targets
🎯 TP Levels Zone/Logic
1.13884 Prior demand base / FVG top
1.12854 Major imbalance completion
1.12545 – 1.1200 Liquidity grab + OB tap zone
⚔️ Execution Plan
In Position? Hold – structure confirms clean sell trap.
Missed Entry? Wait for M5–M15 OB retest or mitigation around 1.1415.
Reversal Risk? Only invalid if 1.1454 breaks with close above.
🔥 OdinVerse Grade: A+ Setup
✔ HTF Supply Confluence
✔ Dual Bank Entry Zones
✔ Structure Shift
✔ Clean Downside Liquidity Targets

$HOOD great product but short term pull back here $58-$60Hello, I have multiple time frames up here: Daily, Weekly, and Monthly. I love Robinhood NASDAQ:HOOD as a broker, product and revolutionary company in the financial space. This is a great long term hold equity wise in my opinion but right now I am looking to short this name for a necessary pullback into $58-$60. It's overbought on the big time frames as you can see highlighted, it is possible it can break out of course but I believe with declining weekly volume this name will resort to some pullback. Also, Bitcoin can have some downside as well which will bring this name down with it. This ticker is volatile and can move 5-8% in either direction in just one session. I am looking for $60p about 3 weeks out, 6/20 date.
WSL

As ECB Ready's "Final Cut", EJ "Begins Reversal"OANDA:EURJPY has began to potentially form a very strong Triple Reversal Pattern, The Head and Shoulders @ the Resistance Level lasted visited May 14th.
I say "potentially" because the "Right Shoulder" or recent Lower High has been created but we still wait for the final decline to the "Neckline" or Support Area formed by the Lows separating the "Head" from the "Shoulders" or Higher High from the Lower Highs in the pattern!
Signs of Potential Head & Shoulders:
1) Left Shoulder is an Oversold High
2) A Higher High is created at a level of Resistance
3) The Head not only has the Most Volume concentrated in the Pattern, but is also the start of the RSI Divergence from Price
4) Right Shoulder is formed and unable to surpass the Left Shoulder
..Bringing us to a very important tell..
5) Volume Decreases and logs a 3rd Divergent High in the RSI @ the creation of the Right Shoulder
Now we must WAIT for CONFIRMATION of the Pattern!
This will come when Price:
1) Declines to the Neckline
&
2) Makes Successful Breakout
Once the Head & Shoulders is Confirmed and Breakout is Validated:
- This could deliver great Short opportunities as a Head and Shoulders Breakout and Retest at the Neckline being the Last Line of Defense for the Bulls if Bears can push Price through and pick up Volume!
Fundamentally, BOJ Governor Kazuo Ueda will be speaking on Tuesday, June 3rd where we could see volatility come in for JPY.
The ECB is expected to cut rates by 25 bps from 2.4% to 2.15% on Thursday, June 5th and this could be the Last Cut we see the ECB plan to make until they see downside growth risks make more cuts likely.

#BTCUSDT #4h (Bitget Futures) Ascending trendline breakdownCRYPTOCAP:BTC lost 50MA that may act as resistance now, retracement down to 200MA support seems next.
⚡️⚡️ #BTC/USDT ⚡️⚡️
Exchanges: Bitget Futures
Signal Type: Regular (Short)
Leverage: Isolated (19.0X)
Amount: 5.0%
Current Price:
107480.5
Entry Zone:
108234.7 - 109274.5
Take-Profit Targets:
1) 106010.9
2) 103944.6
3) 101878.3
Stop Targets:
1) 111050.5
Published By: @Zblaba
CRYPTOCAP:BTC BITGET:BTCUSDT.P #4h #Bitcoin #PoW bitcoin.org
Risk/Reward= 1:1.2 | 1:2.1 | 1:3.0
Expected Profit= +47.9% | +84.0% | +120.1%
Possible Loss= -40.1%
Estimated Gaintime= 1-2 weeks

EU Prints Three Black Crows!FX:EURUSD has printed a strong Triple Candlestick Pattern called Three Black Crows after having made a 50% Retracement of the failed Higher High @ 1.1407.
This 50% Retracement found price testing a Previous Low and Resistance Zone where price now has broken a Previous Level of Structure being Support and is now on its way up to Retest this Break!
If Price is able to Retrace back to the Level of Structure @ ( 1.1336 - 1.1340 ) and shows signs of Resistance, this could deliver Short opportunities to take Price down to the Next Levels of Support @ 1.131 & 1.126!

BTC hits ATH – But this hidden signal could ruin the rally!Bitcoin (BTC) has been in a steady and impressive uptrend over the past two months, with nearly seven consecutive weekly green candles forming on the chart. This sustained bullish momentum signals strong buying pressure and growing confidence among market participants. Such a consistent rally is rare and often indicates a broader shift in sentiment, suggesting that Bitcoin may be entering a new phase in its market cycle.
Price discovery
Recently, BTC broke through its previous all-time high (ATH) of 110K on the lower timeframes, a significant technical development. This breakout means BTC is now trading in price discovery territory, where there is no historical resistance to guide price action. While this opens the door for further gains, traders should remain cautious. Upcoming daily and weekly candle closes will be critical in determining whether this breakout is sustainable. For the move to be confirmed, Bitcoin needs to close multiple weekly candles above the previous ATH. If instead, the price falls back below the ATH on either this weekly close or the next, it could introduce downward pressure and potentially signal a failed breakout.
As we navigate this pivotal moment, it's crucial not to get swept up in the euphoria. While the price action is undoubtedly bullish, certain technical indicators warrant close monitoring to avoid complacency. In particular, the weekly Stochastic RSI and the weekly RSI are now at levels that deserve attention.
Stochastic RSI
The weekly Stochastic RSI is entering overbought territory, even before this week’s candle has closed. This suggests strong bullish momentum is currently driving the market. However, history shows that when the Stochastic RSI enters the overbought zone, it often marks areas where it was wise to take partial profits. If the blue and orange lines on the Stochastic RSI begin to cross back below the 80 level, it could indicate a weakening of momentum and the possibility of a short-term correction. That scenario becomes more likely if Bitcoin fails to continue making higher highs in the weeks ahead.
Relative Strenght Index (RSI)
Meanwhile, the Relative Strength Index (RSI) is approaching a critical resistance trendline. In previous market highs, we’ve seen the RSI top out at 89, followed by a high of 80 despite new highs in BTC’s price, a classic case of bearish divergence. If Bitcoin fails to push significantly higher in the coming weeks and the RSI does not break above the 80 level, we could be looking at a potential triple bearish divergence. This would be a strong warning signal that momentum is waning, and it could lead to a broader correction.
For this reason, it is crucial that Bitcoin continues to push upward with conviction. The RSI must break through its historical trendline and post a new high above 80 in order to invalidate the threat of bearish divergence. Should the market fail to do so and instead roll over, we may experience increased volatility and downside pressure as we move into the summer months.
Conclusion
In conclusion, while Bitcoin is exhibiting powerful bullish behavior and appears poised for further gains, the sustainability of this rally hinges on continued momentum and strong technical follow-through. Specifically, Bitcoin must maintain closes above its previous all-time high, avoid a bearish cross on the Stochastic RSI, and see the RSI break above its recent highs to neutralize the threat of bearish divergence. If these conditions are not met and momentum fades, the market may face a period of consolidation or correction in the near term. Staying vigilant and objectively monitoring these indicators will be essential for navigating what comes next.
Thanks for your support.
- Make sure to follow me so you don't miss out on the next analysis!
- Drop a like and leave a comment!

NZDUSD Bearish Setup🔍 Market Structure Analysis
WSD Zone Rejection (Top):
Price tapped a wick-based supply & demand (WSD) zone at the top around 0.59486.
That zone also aligns with the previous liquidity grab + mitigation of the OB.
Price is now rejecting that area — forming a lower high (LH) inside the zone → classic sign of distribution.
Rising Channel Break:
Price was rising inside the red ascending channel.
Currently showing bearish intent, with multiple internal BOS (breaks of structure).
If price closes below the channel, that confirms bearish expansion.
Downtrend from Premium Zone:
We're clearly in premium pricing, where institutions prefer to offload longs.
This area also completes a liquidity sweep of prior highs inside the WSD zone.
🧠 Trade Logic (Sell Setup)
🔺 Entry Zone: Inside or after rejection of WSD at 0.59486.
🛑 Stop Loss: Just above the WSD zone and local high.
🎯 Take Profits:
TP1: 0.58669 → Local support + lower WSD zone (reaction zone).
TP2: 0.58398 → Previous liquidity pool and external low.
🧾 R:R = Clean 1:4.5+, textbook SMC setup.
📌 Confluences for Bearish Bias
✅ Multiple WSD zones tested with bearish rejection.
✅ Rising channel inside premium is breaking.
✅ Mitigation + BOS on smaller TF.
✅ News candle marked by blue vertical line may act as final volatility spike before continuation.
✅ Price is near VWAP/50% equilibrium → Ideal for smart money to expand to downside.
🧯 Invalidation Conditions
❌ If price closes above 0.59486, we reassess the bias.
❌ A re-entry into the upper WSD with strong bullish volume invalidates the current bearish flow.
🔮 Forecast Summary
This is a classic distribution setup with liquidity engineered into a WSD zone, now showing early mitigation and markdown signs. Unless major manipulation occurs, expect price to expand toward the 0.58398 low in the next 24–48 hours.

EURUSD Bearish Setup📌 Market Structure & Setup Summary
Major Supply Zone Rejection (Red Zone at Top):
Price tapped into higher timeframe supply zone at 1.13755 (red box).
This was a buy-side liquidity grab just above the previous high → textbook distribution zone.
Now price is respecting that zone and rejecting it with bearish momentum.
Bearish Rising Channel Broken:
Red trendlines show a rising wedge → often leads to a bearish breakout.
Price is currently breaking out of that wedge to the downside.
Premium Pricing Confirmed:
Price was pushed into the premium zone (above equilibrium), inducing buy orders → now being reversed.
🔄 Trade Plan (Short Bias)
✅ Entry: Activated inside the red supply zone after confirming wick rejections and structure shift.
🛑 Stop Loss: Above the red supply zone (above 1.13755).
🎯 Targets:
TP1 → 1.12545: Structure support and breaker block.
TP2 → 1.11663: Previous demand zone and trendline intersection.
TP3 (Optional) → 1.11002 – 1.10610: External liquidity + trendline + FVG zone.
📉 RR Ratio: Estimated 1:4 to 1:5+ if TP2/TP3 hits.
⚠️ Key Confluences
🔹 Bearish break of rising wedge = structural shift.
🔹 Rejection wick inside red supply + BOS.
🔹 TP zones aligned with previous OB, breaker blocks, and liquidity pools.
🔹 News/volatility likely during the double blue vertical lines, so expect reaction spikes.
🚫 Invalidation Criteria
If price closes above 1.13755, the idea is invalid.
Watch for manipulation or false breakouts during high-impact news.
🔮 Market Forecast
If current rejection holds, expecting price to seek sell-side liquidity from 1.12545, then 1.11663, and possibly lower. This is a classic distribution > BOS > retrace > expansion sequence.

GBPUSD Bearish Setup📌 Current Market Structure
Liquidity Sweep + Rejection in Premium Zone:
Price tapped into the major supply zone (red box) sitting above the last high.
Liquidity above previous highs was swept, and now price is rejecting → a classic buy-side liquidity grab setup.
Bearish Rising Wedge Structure Broken:
Price broke the inner rising wedge (red trendlines) to the downside and is now retesting the supply zone.
Breakdown aligns with a potential reversal entry or at least a bearish pullback.
Higher Timeframe Supply Zone:
The red zone coincides with the 1.34782 resistance, which price failed to break cleanly above.
This zone holds institutional footprints → possible smart money distribution.
🧠 Trade Idea (Bearish Bias Confirmed)
✅ Entry: Already activated inside the red supply zone.
📍 Stop Loss: Just above the red box (around 1.3480).
🎯 Target Zones:
TP1: 1.33281 → minor demand zone and previous consolidation.
TP2: 1.32870 → previous BOS retest zone.
TP3: 1.32543 → deep demand zone and trendline intersection.
TP4: 1.31759–1.31554 → external liquidity resting below structure (long-term target).
🔻 Risk-to-Reward: Excellent potential up to 1:5+ RR if TP4 hits.
🔄 Reversal Signals Confirmation
Watch for:
Bearish engulfing candles with rising volume inside the red zone (VSA style).
Displacement candle or M5–M15 BOS confirming internal structure shift.
⚠️ Invalidation Zone
If price closes a 1H candle above 1.3480, setup is invalidated.
Watch out for possible manipulation during the vertical blue lines (likely high-impact news).
🔮 Forecast:
Expecting a mid- to long-term retracement or reversal back to the 1.31700s – 1.32800s region, based on the current rejection from premium supply and completion of a liquidity sweep.

$SOL About to Outperform $ETHToday looks like a good day to flip your CRYPTOCAP:ETH for CRYPTOCAP:SOL 😎
Flirting with the 200DMA,
RSI has bottomed,
feels good man 🐸

ALT COIN SEASON IS JUST WEEKS AWAY, HOPE YOU HAVE YOUR BAGS FULLHey Traders,
We’ve been watching this Bitcoin Dominance (BTC.D) chart closely — and it’s heating up again!
For those unfamiliar, BTC Dominance tracks the percentage of total crypto market cap that belongs to Bitcoin. When BTC.D rises, it typically means altcoins are underperforming compared to BTC — either due to their market caps falling, or BTC’s increasing. When it drops, altcoins are gaining ground.
While this chart won’t tell you whether markets go up or down, it’s critical for spotting where to diversify and when. It’s a must-have tool in your crypto trading utility belt.
⸻
Why This Chart Matters Now:
We’re nearing the top resistance trendline of a long-term triangle formation that dates all the way back to 2017. This line has rejected BTC.D multiple times in the past — and we’re back to test it again, hovering between 63% and 66% dominance.
Each of these rejections previously led to a drop in BTC Dominance — which triggered powerful altcoin seasons.
⸻
Key Bearish Signals:
• Bearish Divergence on the MACD
• MAJOR Bearish Divergence on the RSI
(Just like before previous alt seasons!)
• TOTAL2 (the white line representing all altcoins) looks poised to spike if history repeats.
Altseason Clue: When BTC.D forms bearish divergences on these indicators, it’s often followed by a surge in altcoin market cap — a key early signal we may be close to another one.
⸻
BUT… This Isn’t 2021 Anymore:
Let’s be real — the market has changed. Solana-based launchpads like Pump.fun and Jupiter DEX have revolutionized how easily tokens are created and traded. That’s new capital flow and speculative behavior we didn’t see last cycle.
Plus, the geopolitical landscape is shifting fast. With President Donald J. Trump calling for crypto regulation frameworks within 180 days, we may soon see an influx of institutional money — but it could come with strings attached.
⸻
Final Thoughts:
A breakdown in BTC.D could mean a major rotation into alts — but don’t bet the farm.
Markets could still dump. We may even skip altseason altogether this cycle.
However, this chart gives you a crucial edge — so use it wisely. Know your tools. Zoom out. Plan ahead.
As always — stay sharp, stay safe, and stay profitable out there.
— Savvy

Bitcoin's Weekly MACD & RSI —Back To Basics (Part 1)We looked at Bitcoin on the weekly timeframe and mentioned the rare Michael Saylor 4 weeks green bullish signal. But what about the MACD and RSI? What are these indicators currently saying?
Let's dive deep into these two and see what we can find.
First, Bitcoin's weekly RSI.
1) Here we have first what is called a hidden bullish divergence. The RSI hit a lower low in March 2025 compared to September 2024, but Bitcoin is currently trading within a strong higher low (March/April 2025 vs September 2024). This is an interesting signal.
2) The same RSI support that was activated in September 2023 and September 2024 worked in March 2025. Once this level was activated—blue dotted line on the chart—the RSI started to move upward.
Each time this support is activated Bitcoin goes on a major bullish wave. In September 2023 Bitcoin started a major rise from 20 something toward 70K+. In September 2024 Bitcoin started a major advance from 60 something toward 110K.
3) A triple bottom. Another signal related to this same support level is a triple bottom. It was challenged three times and holds. In 2025, this support zone was pierced briefly and then the RSI started growing. This makes the reversal signal an even stronger one.
Bitcoin doubled in 2024 from this RSI support and more than triple in 2023. So this time around we can count on a double minimum but can be a triple or more. If it increases each time, first a double, then a triple and then a quadruple.
The next signal is Bitcoin's weekly RSI broken downtrend and bullish reading:
1) The downtrend has been broken on the RSI, pretty simple. Here depicted with blue lines. Needless to say, when the downtrend breaks the RSI moves up. A strong RSI is bullish for Bitcoin and this takes us to #2.
2) The RSI has a strong reading at 59. Bullish is above 50 and there is also a bullish cross, when the RSI moved above the RSI based MA (moving average).
The weekly RSI reveals Bitcoin's eternal bullish bias. Over time this indicator becomes overbought but never oversold. Interesting isn't it? It shows that market participants are ready to buy beyond what is reasonable but not willing to sell that much.
As it happened back in late September 2024, the RSI doesn't have to move straight up, there are ups and down within a rise, please keep that in mind. The RSI doesn't necessarily reflect what Bitcoin is doing or will do, it only supports a broader bias, trend or cycle, in this case the bullish case.
Next comes the MACD (Moving Average Convergence Divergence).
This is pretty interesting as well and the first signal is a higher low in April 2025 vs September 2024, a standard bullish signal:
Revealing Bitcoin's eternal bullish bias, the MACD starts to recover without reaching the bearish zone. The bearish zone is when the MACD moves below zero, here the recovery is happening above.
The fact that the bullish cross on the MACD, when the MACD line crosses upward the signal line, is not yet in means that this bullish cycle is still early.
When the MACD line (blue) starts to curve on the weekly timeframe after making a long-term low, as it is now, the market turns bullish and there is no going back.
I will go deeper on the MACD in part 2 of this publication.
If you enjoy it and like it boost it to give me feedback. The more feedback, the deeper the next analysis will be.
Thanks a lot for reading, your support is truly appreciated.
I'll see you next time.
Namaste.

Fall Down to $70 ApproachingWith the RSI above average since mid-April 2025, the trend has been steadily rising up to $82 per share even breaking the highs from late February and March.
Price projected onto both (A and B) Inside pitchforks is well above the median line. In the pitchfork A the price is even directly touching the upper parallel line.
Reversal near the highest achieved price this year on 21st February is probable
Based on these indications, we can expect a fall to around $70 somewhere in the middle of May.
Key details:
RSI over "overbought" level
Price in both Inside pitchforks near the upper parallel line
Longer uptrend = breakdown necessary

GBPJPY bearish move🔹 Pair / TF | GBP/JPY, 1 h → 15 m |
| 🔹 Bias | Bearish (selling the break of support) |
1. 📊 Key Levels
Level Price Role
R1 191.721 Major resistance (green)
Broken Support 190.65 (black line) Minor support → now resistance
R4 189.828 Next minor support
R2 189.355 Next major support
2. 🚨 Trigger
Price closes below the 190.65 support (black line) on 1 h, AND
200-hour MA (red) has just been rejected—sellers stepping in.
This decisive break flips 190.65 into new resistance.
3. ✅ Confirmation
RFI oscillator on 15 m dips below its rising trendline and fails to reclaim it.
Momentum is clearly bearish—no divergence or oversold reversal signal.
4. 🎯 Entry & Stops
| 🔶 Entry Zone | 0.19060–0.19050 (just below 190.65) | | 🔴 Stop-Loss | 0.19180 (above R1 at 191.72) ≈ 120 pips |
Place a Sell-Stop at 0.19055 (mid-zone).
Risk: 1–2% of account on ~120-pip SL.
5. 🎯 Profit Targets
Target Level Pips RRR
T1 R4 189.828 ~82 pips 1 : 0.7
T2 R2 189.355 ~125 pips 1 : 1
Scale out:
Exit ½ at T1.
Let the rest run to T2.
6. ⚙️ Trade Management
Move SL to breakeven once +40 pips in profit.
Monitor RFI on 15 m:
If RFI spikes above its trendline before T1, close remaining.
Adjust if you see large wicks or volume spikes into support zones.
7. 🔑 Rationale
Support→Resistance flip at 190.65 gives a logical entry & SL.
200-hour MA rejection confirms sellers overpowering buyers.
RFI confirms sustained bearish momentum.
High RRR (>1 : 1) ensures edge even with a moderate win-rate.
⚡ Highlight:
This is a bank-order-flow style fade—selling the break of minor support after a MA confluence test, riding momentum into larger support zones.

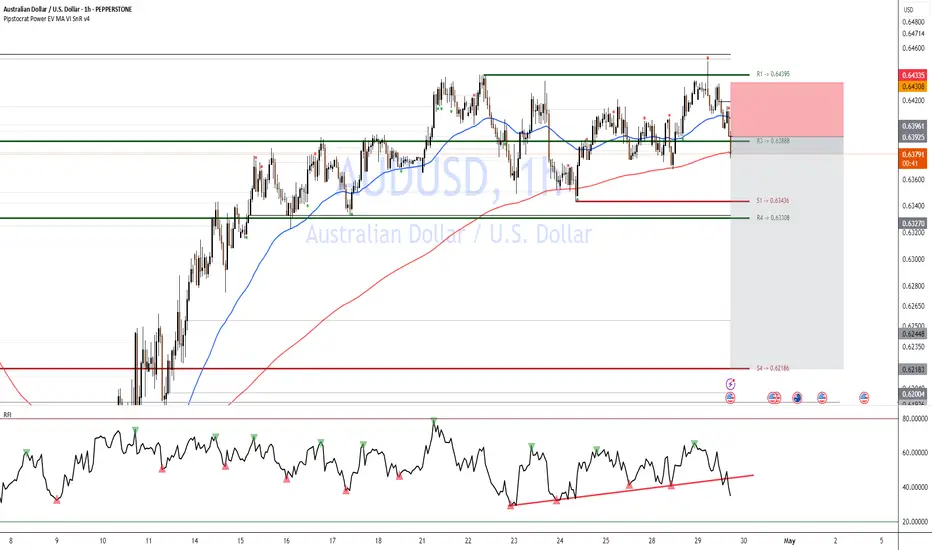
AUSSIE bearish move Short-setup: Breakdown of Support (AUD/USD)
Trigger: Price has decisively broken below R3 (0.63888) and the 200-hour MA (red) on the 1h chart.
Confirmation: RFI just dipped below its ascending trendline and failed to reclaim it—momentum is bearish.
Entry: Short at market 0.6385–0.6380 (just below R3).
Initial Stop: Above R1 (0.64395) ≈ 55 pips stop.
Targets:
T1: S1 (0.63436) (~40 pips → RRR ≈ 1 : 0.7)
T2: R4 (0.63308) (~55 pips → RRR ≈ 1 : 1)
⚡ Highlight: This is a bank-order-flow style fade—selling the break of minor support after a test of the 200-hour MA confluence.
🔑 Rationale
Support→Resistance flip at R3 gives logical entry & SL.
200-hour MA rejection confirms sellers overpowering buyers.
RFI confirms sustained bearish momentum.
High RRR (>1:1) ensures edge even with moderate win-rate.
Nifty 24170-24360 range breakout to provide an directional move.Trend: Moderately bullish.
Trigger point: 24,360 breakout.
Above 24,360: Strong bullish breakout into a fresh zone.
Below 24,170: Caution advised — bias would weaken.
Volatility: Dropping — favoring smoother, more controlled moves rather than choppy swings.
Momentum: Building but needs further confirmation from RSI 21-SMA reversal.

BTC Potential Breakout, Daily DivergenceBTC on the daily has the opportunity to expand way upwards over the next month - a divergence on the daily evidently takes longer to play out but RSI could easily reach 80 off the back of the structure.
I have been shorting, confidently, for a good few weeks now, with longs in between, but I'm starting to feel like I should flip long.
Solana is also trying to reclaim the daily/weekly range - things to think about for sure.
Good luck out there!

DXY Printing a Bullish Triangle??The DXY on the 1 Hr Chart is forming a potential continuation pattern, the Bullish Triangle!
Currently Price is testing the 99.6 - 99.8 Resistance Area and battling with the 200 EMA and 34 EMA Band. The reaction to this conjunction could be pivotal in who overcomes: Buyers or Sellers.
Now during the formation of the potential pattern, Price on the RSI has stayed relatively Above the 50 mark being Bullish Territory suggesting Buyers could win the Bull-Bear battle.
Until Price breaks either the Resistance Area or the Rising Support, we will not have a definitive direction in which USD will strengthen or weaken.
*Wait For The Break*
-If Price breaks the Resistance Area, USD will strength possibly heading to the 100.8 - 101 Area
-If Price breaks the Rising Support, USD will weaken possibly heading to the 98.5 - 98.3 Area
Fundamentally, it is said China and USA are possibly getting closer to potentially ending the Reciprocal Tariff War going on with both sides willing to negotiate.
With the USA being the #1 Consumer of Goods globally, other economies can not afford us to not buy their things so I continue to see the Tariff War more as a Strong-Arm for the USA to be able to negotiate better terms!
USD News:
JOLTS - Tuesday, Apr. 29th
GDP - Wednesday, Apr. 30th
Unemployment Claims / ISM Manu. PMI - Thursday, May 1st
Non-Farm Employment Change / Avg Hourly Earnings / Unemployment Rate - Friday, May 2nd
For all things Currency,
Keep it Current,
With Novi_Fibonacci

$BTC Bull Trap Clear As DayI’m probably the biggest 3-Year perma-bull on this app, and even I can tell this is most likely a bull trap.
This is either the beginning of the long awaited parabola, or else we’ll correct back down to at least the 200DMA in the next week, or the 50DMA within the next month.
Lack of volume on the move and RSI becoming overheated gives me feels for the latter
Remember, never trust a weekend pump 💯
Bookmark this.

$USDC | Altseason Incoming.....FinallyCRYPTOCAP:USDC Dominance looks to be Double Topped on the RSI side and per historic movements, this looks promising for the market.
I say, BRING ON THE ALTCOINS.