Dogecoin(DOGE): First Bounce After Nice Drop? We are back with Doge coin, which has a very nice rejection from the upper resistance zone as of now, leading the price towards a lower support of $0.09113.
With that being said, we see that the price has had a volumetric bullish movement, which can lead the price back to the upper resistance zone. We are looking closely for market price movement, and once we see the price back near the upper resistance, we will be shorting it again with a much bigger size!
Relative Strength Index (RSI)

Bitcoin(BTC): Do Not Miss That DROP! Bitcoin is showing some weakness at the start of the day, with the price heading back towards the $40K zone.
As our major target are those lower zones (in order to grab all the liquidity there), we are also looking at a potential re-test to the $45,000 zone before that final major drop! Eyes open for sure and not rushing much into "FOMO" mode of missing that potential nice drop!

🔥 QI Huge Risk Reward Signal: RSI Reversal PlayQI has been one of the major movers of the last two weeks. Two hours ago, the RSI has hit oversold on the hourly for the first time since several weeks.
This signal is based on the idea that bulls will be hopping back into this token and push it upwards. Furthermore, the oversold RSI has occurred at the support level, further reinforcing the reversal narrative.
Stop under the oversold-RSI-low. Target at the recent top. This allows us to create an amazing trade with a huge potential pay out.

BTC : RSI Macro-TREND Market Hack 😎Hi Traders, Investors and Speculators of Charts📈📉
As I've said before, I love the logarithmic view of BTC. It gives a clearer indication of price increases alongside growth. Although inflation and value factors aren't physically calculated into the price, seeing the upwards curve makes more sense from a "holistic view" that would include things such as growth and inflation.
A logarithmic chart view displays price changes as a percentage of the previous price. This means that equal vertical distances on the chart represent equal percentage changes, regardless of the absolute price level.
This is in contrast to a regular chart view, which displays price changes on an arithmetic scale. This means that equal vertical distances on the chart represent equal absolute price changes.
With help of technical indicator RSI, we can use the macro logarithmic together with the RSI as a sort of "roadmap" to identify the current dominant macro trend .
If you found this content helpful, please remember to hit like and subscribe and never miss a moment in the markets.
_______________________
📢Follow us here on TradingView for daily updates📢
👍Hit like & Follow 👍
We thank you for your support !
CryptoCheck
COINBASE:BTCUSD

Monero(XMR): We Will Sell Soon! The XMR/USDT market is displaying some dramatic price action. The recent sharp decline suggests a significant urge for downward movement. Despite these bearish liquidity moves we are having on the market, the price of XMR has re-tested the major resistance (which once was broken and we had a nice fakeout).
If this retest turns out to be a fakeout, it indicates that sellers are still in control, and we could expect further downside towards the $157.51 support level. This bearish scenario aligns with the recent drop and will be further substantiated if the price fails to reclaim higher levels soon.

Cosmos(ATOM): Breakout + Re-TestWe're observing a significant development on the ATOM/USDT pair, as we've witnessed a robust breakout from the descending trendline that was previously restraining the bullish momentum. We see that this breakout could lead to a potential retest of the trendline, which, if successful, would confirm the shift to a bullish trend. Currently, our focus is on the $9.7 level.

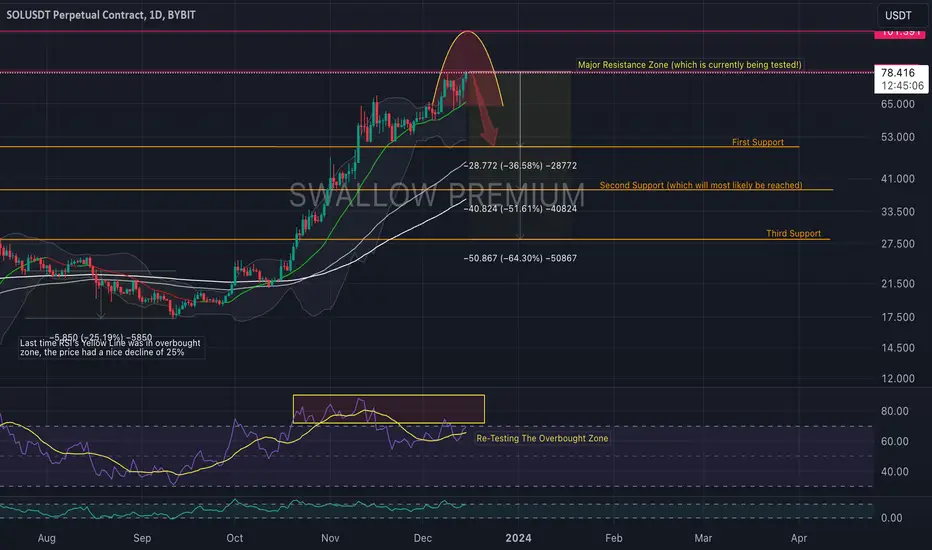
Solana(SOL): Major Resistance Is Approached!!!We see a good potential for retracement from the major resistance zone at approximately $79, which is currently being tested. The RSI is hovering near overbought territory, indicating potential for a price pullback.
So with that being said, we are aiming here for three major zones. We have displayed three key support levels: the first support at around $53, followed by a more substantial second support at $41—which appears likely to be tested—and a third support at $27.5.
China 50 opportunity to buyRSI very low
Market record low since March 2020
Fantastic opportunity to buy, TP 11700-11750 max - anything above this in my opinion is risky
This is not a trading advice. Always do your own analysis before entering the market.

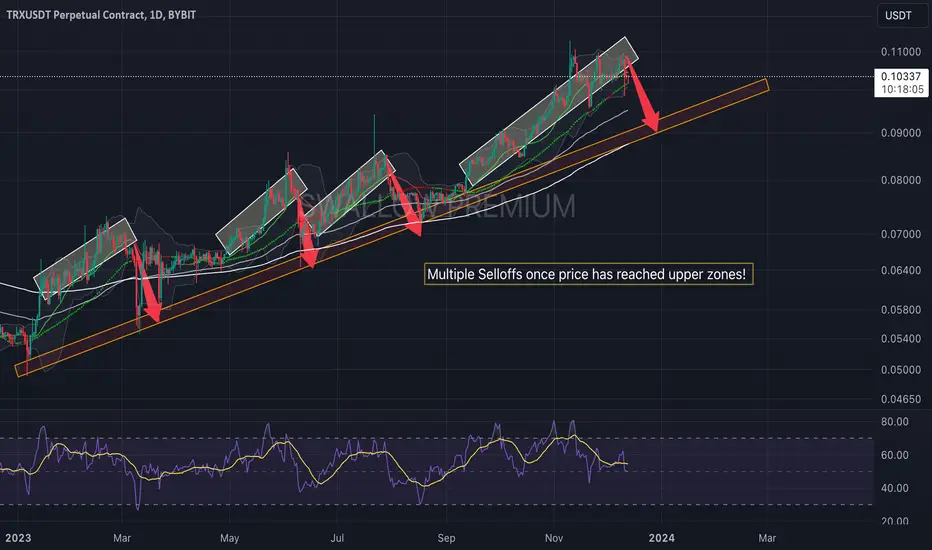
Tron(TRX): Similar Pattern = Drop IncomingTRX has caught our attention with a similar pattern to happen soon. First things first, the price of TRX has had an amazing bullish trend, moving and rebounding from it from time to time, but what is more interesting is how it is testing that zone.
A similar pattern might happen soon, so keep your eyes open for a potential downward movement towards that trend line!
Bitcoin(BTC): Will Go Towards $48K Zone Most LikelyThe second week is here, and we are still showing some strength in building up that overbought market and pushing the limits of Bitcoin.
Not only are we laving heavy masses of FVG zones down below to be grabbed, but we are also on the heatmap of Bitcoin, where the majority of traders have shifted to long positions, showing us a potential liquidation grab to happen sooner or later in lower zones!
With that being said, as we get closer to the April 2024 halving, two of the most reasonable movements can happen:
Plan A anticipates a bearish movement towards $26K zone while also filling all the FVG zones, where we will encounter nice support and a movement to potential new ATHs
Plan B It is similar to Plan A, but near support, we might see further weakness and a potential long squeeze to the lower zones before further movement to the upper zones.

Bitcoin(BTC): Waiting For 44,500 Zone To Be Reached! The fifth day of this week is showing us some further movements towards the upper resistance zone, while yesterday we also had a nice liquidity movement to the lower zones (liquidation hunting).
We are still waiting for this zone to be reached on BTC before any significant movement to lower zones (potentially reclaiming many unfilled gaps down there!).

Bitcoin(BTC): Pumped 6% - Near our ResistanceFourth Day: Price has had a nice bounce from near the FVG zone (at $40K), where so far we have had a nice 6% market price movement!
This being said, we are getting closer and closer to our major target of $44,500, which should determine the next major movement. As you all remember, we are waiting for more bearish scenarios to occur near this zone, but let's see what we will get once we are near it!
Greed and Fear Index: Still Greedy and growing (72)

LiteCoin(LTC): Breakout Or A Nice Bounce??As LTC is trading inside the ascending channel, the price is moving slowly towards the lower line of this channel. From here we have two possible scenarios to play out:
Plan A: Upon reaching that trend line price will find a nice foundation and will have bounce to upper trend line!
Plan B: Price reaches the lower trend line and has a nice breakdown with a re-test, which should lower the price towards that support box area!

Solana(SOL): Potential Rejection To Come! Solana coin caught our attention where price has reached very strong resistance line, which has stopped for now that magnificent bullish run on SOL coin.
We are looking here for a further weakness to kick in and potentially break that middle line of Bollinger bands, which will result in further movement to higher zones! Our gameplan still stays intact until we are below that major resistance zone!

#ICP/USDT 2D (#BinanceFutures) Big falling wedge break & retestInternet Computer seems to have found bottom on historical demand zone, RSI entered oversold territory, recovery towards 100EMA would make sense.
⚡️⚡️ #ICP/USDT ⚡️⚡️
Exchanges: Binance Futures
Signal Type: Regular (Long)
Leverage: Isolated (1x)
Amount: 9.4%
Current Price:
3.804
Entry Targets:
1) 3.390
Take-Profit Targets:
1) 6.098
Stop Targets:
1) 2.305
Published By: @Zblaba
CRYPTOCAP:ICP #ICPUSDT #InternetComputer #Dfinity #Web3
Risk/Reward= 1:2.5
Expected Profit= +79.9%
Possible Loss= -32.0%
internetcomputer.org
dfinity.org

Bitcoin(BTC): Stuck Inside FVG - Major Drop Incoming!!!Third Day: After a nice drop we had on BTC, the price has not shown any significant support or volume near the current zone, where the price is stuck inside the FVG zone and gliding slightly above the middle line of the Bollinger Band.
Today we are going to have a very volatile day with all those news stories, which we think will push the price finally for one last attempt towards FWB:48K , where we want to see the start of that major drop that we have been waiting for.
We still have a lot of FVG zones to reclaim in the lower zones!

Cardano(ADA): Way Too Overbought - Time To Short?The current 4-hour ADAUSDT chart exhibits a notable retreat from recent highs, suggesting a cooling of bullish momentum. The price of ADA has formed a noticeable peak, leading to a substantial red candle that breaches the immediate support level. This shift implies a potential for continued bearish movement.
We are to monitor the Bollinger Bands closely; a sustained close below the middle band could signal further declines, potentially targeting the next significant support at $0.3827. The RSI shows no immediate signs of oversold conditions, which means we still have some room to fall

Ripple(XRP): Multiple Selloffs = Soon Drop?We've observed significant sell-offs, characterised by long wicks, which indicate selling pressure. The market appears to be bouncing, forming a series of broken zones, yet no significant movement to lower zones has happened!
As we navigate through this choppy terrain, we're keeping a close watch on the intersection of the Bollinger Bands' middle line and the major support trendline. A decisive break below this confluence has intensified selling momentum, pushing prices towards the lower Bollinger Band or beyond.
Our gameplan is to wait for some sort of re-test in the upper zones (closer back to the middle line of Bollinger bands). Once we are near that zone, we are going to look for a potential further downward movement, and we will catch it as well if we can.

#BTC/USDT 15m (ByBit) Symmetrical triangle breakdown and retestBitcoin is retesting local supply zone and printed a death cross + an evening star, looks ready for a retracement down on Low Time-Frame.
⚡️⚡️ #BTC/USDT ⚡️⚡️
Exchanges: ByBit USDT
Signal Type: Regular (Short)
Leverage: Isolated (35.0X)
Amount: 5.0%
Current Price:
43593.7
Entry Targets:
1) 43789.6
Take-Profit Targets:
1) 42287.0
Stop Targets:
1) 44291.3
Published By: @Zblaba
CRYPTOCAP:BTC BINANCE:BTCUSDT.P
Risk/Reward= 1:3.0
Expected Profit= +120.1%
Possible Loss= -40.1%
Estimated Gaintime= 1-2 days

Bitcoin(BTC): Liquidated Many Traders!! (Massive Drop) The first day of the week has started with a very sharp movement to lower zones, resulting in some nice liquidity hunting for millions of dollars.
With prices getting rejected from the upper zone, we started slowly moving toward FVG zones that have been waiting long enough for them to be reclaimed again.
With that being said, it is a little early to say if it was just a long squeeze or if we had an actual rejection from the upper zones, but what we are going to do is look for a potential re-test in the upper zones (near $43,800) with an overall aim to re-claim those FVG areas!
Swallow Team

MA my understanding
I know that the topic of moving averages has been fairly explained in crypto and other trading markets, and every trader has a good knowledge, and usage cases for them, but here I will share my own view of the moving averages, and how I use them for trading without relying on technical or educational sources by any means.
Starting with a recap on the main idea of moving averages, the moving part of the name indicates a change in the final results based on time period specified by the trader such as 5,10,15,21,31,50,100,150, 200, you name it, for the last x candles to consider while calculating the average of their cumulative x price divided by their number.
things you need to consider when using the moving average include:
1. Its an old and well known method to analyze price action
2. Many traders use it as a part of their trading strategy
3. It removes the noise from the price, and helps to identify trends sometimes
4. Traders rely on predefined moving averages lengths such as 21,30,50,100,150, and 200 so using these fixed values for your moving averages gives you better analysis of the market
now for the usage cases that work for me with MA:
1. Showing support and resistance
for new coins, I rely on the moving average to predict support and resistance
since new coins form new supports and new resistances alone the way, indicators cannot work, and identifying levels is almost impossible, thus many traders will rely on the sole usage of MA for their support and resistance.
2. Identifying trend change
some trends can be clearly seen or predicted by using MA crosses, such as the famous golden cross of the 50 and 200 MA, and smaller crosses including 21 crossing 50 to identify an uptrend, or vice versa.
3. Eliminating FOMO
if the price suddenly fluctuates up, and the moving average is still moving smoothly on the same level, jumping in the market will be considered pure FOMO. The moving average can support sudden jumping in prices by showing an increase overtime, while sudden jump in the price with a moving average moving horizontally indicates that price could fall fast since no preparation of the market is found.
Indicators are really helpful when relying on MA in TA, so here I will share indicators I use when considering MAs:
1. Cryptonite's EMA Field
I really on this indicator a lot since it provides the ability to use 9 different EMAs, customize their colors, see their crossing on chart, and receive alerts of crossing.
2. RSI oscillator by TradingView
RSI is surely a different topic, but using RSI with MA of the RSI to show bullish and bearish movements is extremely helpful when trading.
3. Volume oscillator by TradingView
this indicator shows the volume of the coin, which is also not our topic, but using the volume with its MA helps finding resistance points in the chart, and predicting where the price could possibly reach before starting a reversal.
Hope you all benefit from the explanation I provided, and always remember, never quite trading even if you are left with only $1, as there is always a brighter future in the market.

Litecoin(LTC): Below 200 EMA / Drop to Come? The LTC/USDT trading pair on the daily chart is hinting at a bearish outlook following a rejection from the 200-day Exponential Moving Average (EMA).
Currently, the price is under the 200 EMA—a bearish sign. We are watching this level closely, as maintaining below it could lead to further downward movement. The presence of long wicks on recent candlesticks suggests that while buyers are attempting to push the price up, sellers are ultimately overpowering them, leading to a close near the low of the day (and showing strength by doing it multiple times).
If this bearish pressure continues, we may expect to see the price decline further, potentially testing the next levels of support. As always, we should monitor for any bullish signs or a potential reversal, but as of now, the momentum is favouring the bears.

🔥 ADA's Best Possible Trade: Don't Miss The Entry! 🚨Last month I made an analysis on ADA and the huge parallel channel it has been trading in for almost 4 years at this point. In said analysis I wrote that my long-term target for ADA is placed at 35$ (or the top of the channel, whichever comes first).
The trade is playing out well. However, the 3-day RSI has hit a new record high of 90.37 at the moment of writing. Historically, this has signaled a local top was near.
I doubt that we're going to see 0.38 in the next correction. Still, a correction towards the 0.50$ is still possible after being so far extended.
Don't miss out on the correction. Prepare yourself for any near-term weakness in this token.
