AAVE/USDT: Approaching 200 EMAAAVE's price is going to face a struggle to maintain upward momentum as it tests key support levels. The 200 EMA is serving as a pivotal line, with potential for a breakdown. A decisive movement below this trend could signal a continuation of bearish sentiment, potentially targeting lower support zones. Conversely, if bulls regain control and we breach the highlighted green line, we could anticipate a rally towards the upper resistance. We should watch for either a confirmed breakdown below the 200 EMA or a strong push above current resistance levels to gauge the next move.
Relative Strength Index (RSI)

MASK/USDT: Re-Test Might Fail and Show Further Dump! We've been tracking the MASK coin closely and have noticed some interesting movements. The coin attempted a breakout which didn't hold, leading to a sharp decline towards a re-test zone. If this re-test fails to push through, we're likely to witness a further slide into the lower price regions, with the 200 EMA as our primary target. This area will be crucial to watch, as a solid close below could intensify the bearish trend.
We're on the lookout for potential short opportunities upon confirmation of these bearish signals."

Bitcoin (BTC): Breakout From Major Resistance of $40K ZoneThe new week has started with a magnificent breakout (breaking the $40K zone without any significant resistance).
During the Asian trading hours, Bitcoin has had a breakout from the $40K zone and is currently aiming for the $41.5K zone. As many (including us) waited for some major rejection to happen near $40K, it came to the conclusion that we needed to wait for at least London trading hours to open in order to see how it would be moving during that time there!
P.S. We are not passing completely on the idea of correction (which historically showed same setup as we are seeing right now and Resulted in a nice 60% downfall before the actual halving happened)
On a weekly timeframe, we want to see how the weekly candle will close this week, but the opening of the candle is rather bullish as of now. Eyes open for a potential fakeout of a long squeeze to happen!

Binance Coin(BNB): Dumping While Market is Pushing? 👀 The BNB/USDT pair on the daily chart shows a failed attempt to push higher, indicating a potential reversal. The market seems to be reacting to news about Binance's founder, which could be influencing trader sentiment. The Price is now staying below 100EMA, showing us the strong overweight of bearishness (thanks to that failed attempt to push)
The path ahead for BNB may be choppy, with potential downward movements, but we need to have strong support from where we could see some sort of bounce (or some kind of positive news that could push prices out of this downward movement).

BTC/USDT Short Trade Setup ⬇️Hello Everyone 🙋🏽♂️
RSI +Supply zone
🟠 EP 41817.27
🔴 SL 42415.36
🟢 TP1 41089.66 ⚠️( Close 33% of the trade and Set the SL on EP )⚠️
🟢 TP2 40375.82 ⚠️ ( Close 33% of the trade )⚠️
🟢 TP3 39553.73 🔥 ( Final result)🔥
We are not responsible of any losses for anyone, our trades are profitable more for long terms and we take losses as everyone,
manage your lot size as well and your SL and TP and my opinion is 0.01 lot for each 500 $.
Don't forget to hit the like bottom and write a comment to support us.
Follow us for more 🙋🏻♂️
Best Regard / EMA Trading .
Disclaimer:
----------------
It's not a financial advise, As everyone we take losses sometime but for long term trading we are profitable traders, so manage your account well with SL and TP and your lot size to keep your account safe and stay in the market

Solana (SOL): Middle Line Of Bollinger Bands (DROP?)Solana Coin has been on our radar for some time now, so here is a quick update on the current situation:
The focus is on the middle line of the Bollinger Bands; a breakdown here could be the start we've been waiting for. Such a move would provide the clarity needed to determine whether we’re heading towards a more substantial downtrend. We remain open-minded, ready to respond to a confirmed move to reclaim lower price zones, with eyes peeled for any shift in momentum that could signal an opportune moment to act.

Uniswap Coin (UNI): Might Drop Towards FVG Zones - (18% DROP)The middle line of the Bollinger Bands and recent lows serve as markers for the support zone, which puts traders on edge. A decisive break below this area, confirmed by a sustained move below the middle Bollinger Band, could lead to a test of the lower FVG zones.
We should watch for a retest of the support level; a failure to reclaim this zone may intensify selling pressure, propelling the price towards the lower FVG around $5.28. A break and retest scenario will be critical for confirming a bearish outlook and potentially offering a strategic entry for short positions. Conversely, a bounce from current levels could delay the bearish forecast, but the resistance zone overhead remains a significant barrier to any upward movements.

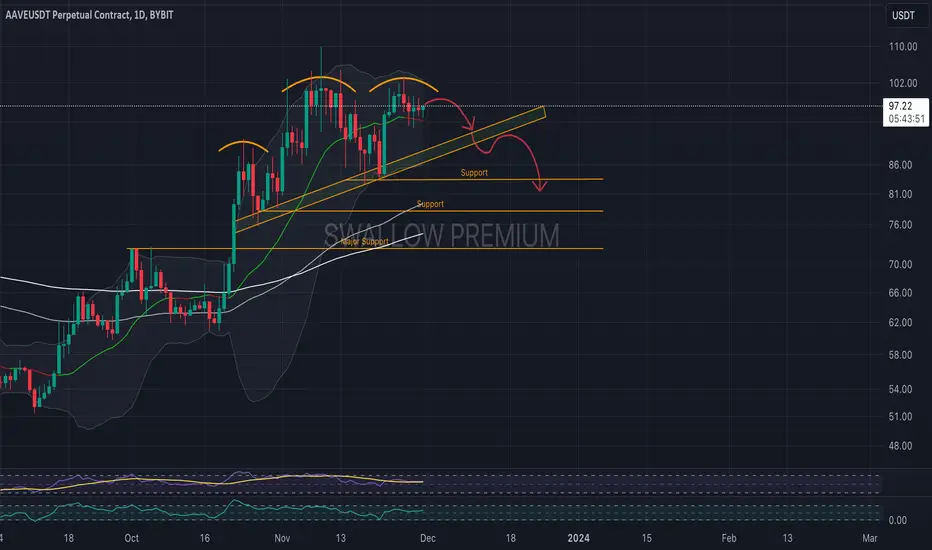
Aave (AAVE): Time To Re-Claim Lower Supports 👀 AAVE is currently in a pivotal phase, testing the resilience of a bullish trend that has been the backbone of recent upward movements. The price is hovering near the middle line of the Bollinger Bands, suggesting a potential turning point. We are closely monitoring for a breakdown below this middle line, which lines up with the supporting trend line that aligns with the lower Bollinger Band.
A significant move below this area of support could prompt a bearish shift, leading to a retest of lower support zones. The key to bearish confirmation would be a successful breakdown, re-test, and subsequent re-claim of these lower levels.
Pancake Swap (CAKE): Potential Re-Claim Of FVG Zones. In the 4-hour chart of CAKE/USDT, we see a clear consolidation pattern taking shape. The market has formed multiple FVG (Fair Value Gap) zones, suggesting significant price interest areas. The recent price movement has struggled to maintain upward momentum, hitting a resistance level at approximately $2.85.
The price is currently staying above a series of unfilled FVG zones, with the closest being around $1.77. These gaps often act as magnets for price and could suggest downward movement if the market does not sustain current levels. Moreover, the presence of multiple FVG zones below the current price may increase the likelihood of a chain effect, intensifying the potential drop if initiated.

Dogecoin (DOGE): Resistance, 100EMA, Breakdown??Intriguing scenario on the 4-hour chart. Recent market sell-offs that resulted in a structure break have marked a significant resistance zone, which the market price is currently testing. Despite a slight upward movement, there's a clear tension as traders anticipate whether the resistance will hold or not.
If the price sustains below this resistance, then we will go for a movement towards 100 EMA near $0.0775, which is also close to a bullish trend as well. We are looking for weakness to kick in here as BB shows some overbought sings here and marketprice has recently went outside the path of BB as well!

Litecoin (LTC): Multiple Selloffs = Potential Downward MovementRecent price movement that has not been able to break above the downward-sloping resistance (upper side of triangle formation) line or fall below the local support area (lower side of triangle formation) shows that markets are getting weaker!
Recent trading sessions have been characterized by multiple sell-offs, suggesting that bears may be gaining strength. However, the lack of a clear break below support keeps the door open for potential reversals. We are looking for a possible break below the support zone around $68.71, which could confirm a bearish movement and initiate a move towards lower support levels, potentially around the $60.50 area.
Conversely, if bulls manage to push the price above the resistance line, it could overturn the bearish scenario and potentially lead to a test of higher resistance levels.

How RSI Alerts Can Supercharge Your Long-Term Crypto PortfolioBuilding a long-term portfolio demands a strategic approach that goes beyond random buys and impulsive decisions.
Instead, savvy investors employ tools like the Relative Strength Index (RSI) to identify advantageous entry points and navigate the market cycles effectively.
💜 If you appreciate our guides, support us with boost button 💜
Here’s a step-by-step guide on how to harness RSI alerts to fortify your long-term crypto holdings.
Step 1: Spotting Entry Opportunities with RSI < 35
When aiming for long-term crypto accumulation, the goal is to buy assets at opportune prices. Setting up your charts with the RSI indicator and adjusting the lower band to 35 enables you to pinpoint instances where cryptocurrencies in your portfolio might have experienced an unwarranted dip. This can be a golden opportunity to acquire assets for the long run, aligning with the principle of buying low.
Step 2: Steering Clear of Overbought Zones with RSI > 70
Conversely, an RSI reading surpassing 70 signals potential overbought conditions. In such instances, it's prudent to exercise caution. Holding off on new purchases during these periods or even considering exiting certain positions that have seen significant price surges allows you to safeguard your returns. Converting gains into stablecoins during overbought phases enhances liquidity, positioning you strategically for future opportunities.
Step 3: Confirm with Other Indicators & DYOR
RSI functions most effectively when complemented by other indicators. Incorporating tools like Moving Averages, Bollinger Bands, and MACD provides a more comprehensive view of market conditions. Remember, thorough research is crucial. Rely on multiple indicators to reinforce your decision-making process and mitigate risks associated with single-point analyses.
Step 4: Get Timely RSI Alerts On Your Email & TradingView App
Time is of the essence in the volatile crypto market. Instead of constantly monitoring prices across various platforms, set up RSI alerts on TradingView to receive timely notifications. This ensures you don’t miss critical market movements and can respond promptly to favorable conditions or potential risks.
How to Create RSI Alerts on TradingView
Open TradingView: Log in to your TradingView account.
Select the Chart: Open the chart of the cryptocurrency you're monitoring.
Add RSI Indicator: Click on "Indicators" at the top, search for RSI "Relative Strength Index", and add it to your chart.
Set RSI Levels: Adjust RSI levels by clicking on the RSI label on the chart, then edit the Upper and Lower Band levels to your preferred values (e.g., 35 for Lower Band, 70 for Upper Band).
Create Alert: Click on the alarm bell icon at the top of the chart, then select "Add Alert." Choose the condition (crossing above/below RSI level), set the desired RSI level, and customize the notification settings.
Save Alert: Confirm and save your alert. You’ll now receive notifications via email or within the TradingView platform when the specified RSI conditions are met.
Effectively utilizing RSI alerts is a game-changer for long-term crypto investors. By intelligently identifying entry points, avoiding overbought conditions, confirming signals with other indicators, and staying informed with timely alerts, you position yourself for success in the dynamic world of cryptocurrencies. Enhance your portfolio strategy with RSI – a tool that brings precision and efficiency to your crypto investment journey.

Bitcoin (BTC) - Failed To Hold $38K ZoneThe weekly chart for Bitcoin shows that the price has failed to hold above the resistance zone and the $38K level, closing below both and indicating potential bearish momentum. A new week has begun with a move down from $37,500, suggesting that the bulls are losing their grip.
The $29,850 level is a significant point of interest; a fall to this support could signify a deeper correction. However, the $24,260 level stands out as a critical area to watch for a potential bounce or further breakdown. If the downtrend continues, the next target could be as low as $16,095, a crucial historical support zone.

Bitcoin (BTC): Another Attempt To Break $38K ZoneOn the 4-hour chart for Bitcoin, we've got an interesting setup developing. The price is teasing the upper boundary of an ascending channel, indicating a strong resistance zone around $38K. Despite recent attempts to breakout from this level, BTC is struggling to hold, signalling potential exhaustion among buyers.
With all eyes on the $38K zone, a confirmed break above could invalidate the bearish outlook, potentially triggering a short squeeze due to the recent greed in the market. However, failure to maintain above this level could see BTC slide back down within the channel and possibly test lower support levels, with significant interest around the mid-$30K range.
Swallow Team

Bitcoin (BTC) - About 150 Days Before HALVING (Update)Bitcoin's been testing our patience at the $38K zone, but it's clear: the bears are itching to drag it down to lower support levels where every attempt to breakout from $38K has been surpassed (even strong liquidations). Now, with all eyes on the upcoming Halving in April 2024, we're on high alert for market maneuvers.
History's got a way of repeating itself, and if we're reading the patterns right, we could be in for a pre-Halving shakeout. We've seen the FUD and the euphoric pushes, but remember, it's the calm traders who survive the storm. So, we're watching that $40K psychological resistance for any potential touches there, but overall, our aim is still the lower zones (more near $26-32K, if not the lover) before the halving.
Swallow Team

ADA/USDT - Long Wait Has Come To End (We Reached Resistance) The price has reached the anticipated resistance zone, currently demonstrating strong holding power from sellers. Furthermore, the RSI exiting the overbought zone indicates the beginning of a potential bearish trend. This combination of factors—the resistance hold and the RSI shift—suggests that traders may start to see a downward trend in price. Now waiting to see if we will reach that target support around $0.2550
Swallow Team

XRP/USDT - Waiting For $0.535 To Be ReachedAfter monitoring this one for the last 10 days, we have seen a lot of things, starting with a nice breakdown and also the price teasing that 100EMA as well. The price remaining below the 100 EMA and the resistance zone, which is a bearish indicator for us, further confirms the breakdown we had.
We are still keeping an eye out for that lower support zone to be reached near $0.535, so let's see how this week we will be moving on the XRP.

Ethereum (ETH) - We Are Still Below 100 EMAOn a weekly timeframe, our attention is still on reaching the lower side of the triangle formation here. We see that the price just keeps rejecting that zone, which indicates a potential movement to lower zones here!
We are holding our eyes open for some sharp movements here and we are going to start slowly shorting ETH as well!

Bitcoin(BTC) - Breaking Down From Bullish Channel (Daily Update)Trice is hovering near the 100 EMA and the lower side of the trending channel, suggesting a potential weakness. Despite a recent small bounce, the Fear & Greed Index shows a greedy market, hinting that the bullish sentiment may not hold for long. This scenario, coupled with an overbought market, raises the possibility of a short squeeze or even a continuous movement to lower zones here.
Weekly Candles are in favour for bears and same goes for daily candles, which still remain below $38K and also $40K, which both work as some sort of "physiological resistance."
Swallow Team

CRO/USDT = Time To Fill FVG Zones CRO is exhibiting a tight consolidation pattern, with prices fluctuating between established liquidity zones. The market has made several attempts to break out, but none have proved decisive yet. Resistance at $0.10975 and $0.1069 define the current price action's boundaries.
We are watching for either a strong downward push through supports or a potential move to fill in those FVG zones here, which could indicate the beginning of a bearish trend.
Swallow Team

ALGO/USDT = Sideways before The Breakdown/BreakoutWe see a tight trading range, signifying indecision between buyers and sellers. If we see a solid break above the upper yellow line, there could be potential for an upward push, possibly initiating a new bullish phase for ALGO coin. However, the odds seem slim, and we may more likely witness a bounce between the resistance and support zones.
We're on the lookout for a potential breakdown, which would necessitate a confirmed re-test of the resistance turned from the support zone. Such a move would signal a clear shift in market sentiment and a potential move to our liquidity grab zone as well!

BTC/USDT - Markets are GREEDYWith markets being greedy and prices being overbought, we are not seeing much bullish movement here (at least not for long). We are still seeing signs of turnover; the only question is, when?
As the surge of the $40K zone is increasing and it is acting almost like a magnet, there is a chance of having a shorts squeeze near this zone, but as soon as we reach it, we are seeing a really nice drop to come after that.
Swallow Team

Decoding RSI during bear market, the Constance Brown way!RSI, as conventionally understood, does not oscillate between 70-30.
This idea explains the RSI behaviour during bear market phase.
