Relative Strength Index (RSI)

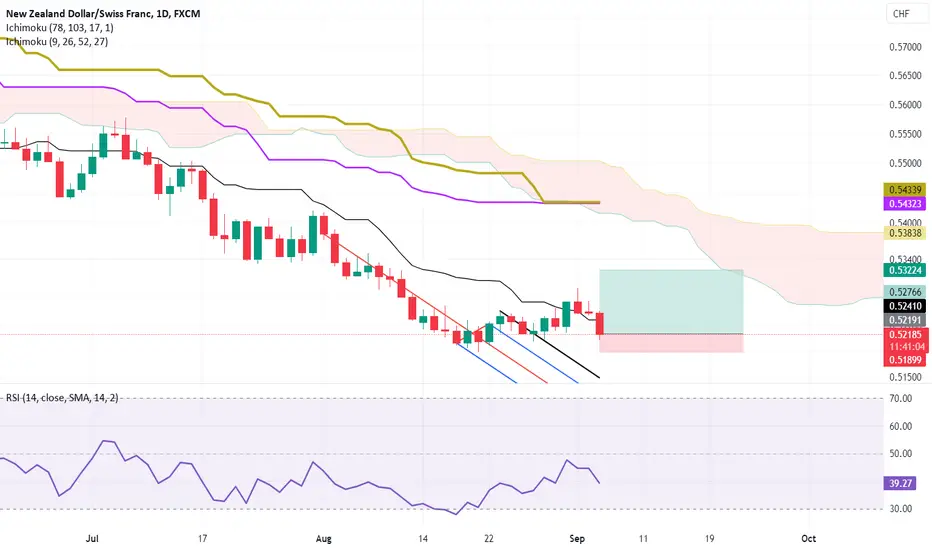
Ichimoku RSI Analysis RSI was in oversold area, so I expect a bullish correction and price can touch the Kumo!
🔥 Worldcoin Bullish Divergence: Is This The Bottom?WLD has seen a very long period of selling after it initially launched on Binance (as happens often with newly added tokens). However, it appears that this token might have bottomed for the time being.
I'm seeing strong bullish divergence on the daily RSI chart. The price made a lower-low, while the RSI made a higher-low, which often signals the start of a change in trend.
Still, this is a risky token and a risky entry. However, the potential gains are very high.
I'm looking at a longer-term target of 3 USD, potentially even higher next year.

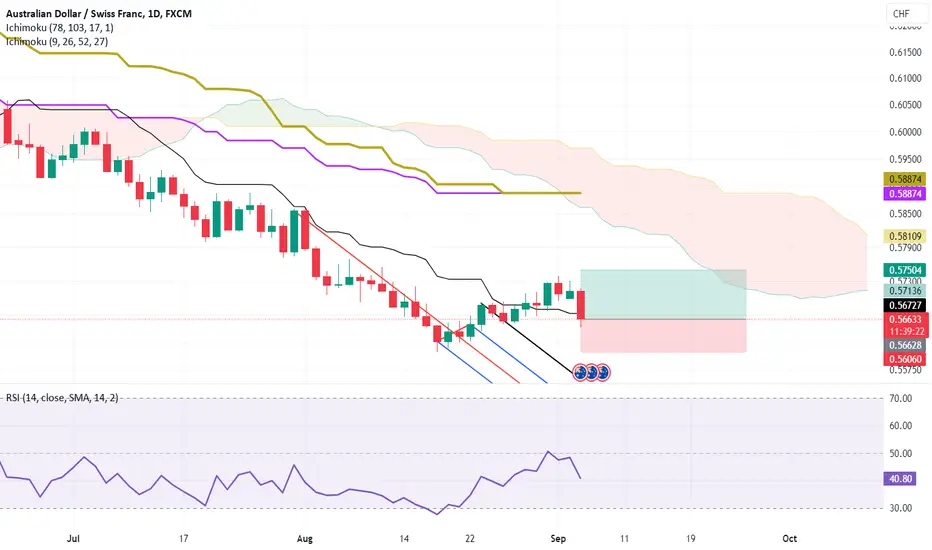
Ichimoku RSI AnalysisRSI was in oversold area, so I expect a bullish correction and price can touch the Kumo!
#KAS/USDT 4h (ByBit) Broadening wedge on resistanceKaspa is facing 200MA where it already got rejected once, seems likely to retrace down to 50MA support.
⚡️⚡️ #KAS/USDT ⚡️⚡️
Exchanges: ByBit USDT
Signal Type: Regular (Short)
Leverage: Isolated (6.7X)
Amount: 5.0%
Current Price:
0.03945
Entry Targets:
1) 0.04020
Take-Profit Targets:
1) 0.03540
Stop Targets:
1) 0.04260
Published By: @Zblaba
$KAS BYBIT:KASUSDT.P #Kaspa #L1 #PoW kaspa.org
Risk/Reward= 1:2.0
Expected Profit= +80.0%
Possible Loss= -40.0%
Estimated Gaintime= 4-8 days

Ichimoku RSI AnalysisWe see a bearish regular divergence in RSI, so I expect a bearish correction and price can touch the Kumo!

Ichimoku RSI AnalysisRSI was in overbought area, so I expect a bearish correction and price can touch the Kumo!

Ichimoku RSI AnalysisRSI was in overbought area, so I expect a bearish correction and price can touch the Kumo!

#AKRO/USDT 2h (ByBit) Ascending channel on resistanceAkropolis printed a shooting star deviation and seems likely to retrace down to 100EMA support, especially with that overbought RSI.
⚡️⚡️ #AKRO/USDT ⚡️⚡️
Exchanges: ByBit USDT
Signal Type: Regular (Short)
Leverage: Isolated (2.6X)
Amount: 4.9%
Current Price:
0.018692
Entry Targets:
1) 0.019243
Take-Profit Targets:
1) 0.013254
Stop Targets:
1) 0.022244
Published By: @Zblaba
NASDAQ:AKRO BYBIT:AKROUSDT.P #Akropolis #DeFi #DAO
Risk/Reward= 1:2.0
Expected Profit= +80.9%
Possible Loss= -40.5%
Estimated Gaintime= 3-6 days
akropolis.io

Ichimoku RSI AnalysisPrice was in overbought area, so we expect that price come down and touch the Kumo!

Simple Introduction to RSI for Crypto TradingCrypto trading can be a rollercoaster ride, with prices jumping up and down. To help you make smarter trading choices, many traders turn to technical tools like the Relative Strength Index (RSI). In this article, we'll break down what RSI is, how it works, and how you can use it as a crypto trader, even if you're not a finance expert.
What is RSI?
RSI stands for Relative Strength Index, but you don't need to worry too much about the fancy name. It's just a tool that helps you figure out if a cryptocurrency is overbought or oversold. Think of it like a traffic light for crypto prices, telling you when to slow down or speed up.
How Does RSI Work?
RSI works by looking at recent price changes and comparing how much a cryptocurrency has gone up versus how much it's gone down. This gives you a number between 0 and 100, which you can use to make better decisions about buying or selling.
Here's the simple way RSI is calculated:
First, you pick a specific number of days to look at, usually 14 days. This is called the "period."
Next, you figure out how much the price went up and down during those 14 days.
Then, you calculate the Relative Strength (RS) by dividing the average gain by the average loss.
Finally, you use that RS to find the RSI with a simple formula.
Interpreting RSI
Once you have your RSI number, it's time to understand what it's telling you:
RSI above 70: It's like a red light, indicating the crypto might be overpriced and due for a drop. This could be a good time to sell or take some profits.
RSI below 30: It's like a green light, suggesting the crypto might be a bargain and due for a rise. This could be a good time to buy or hold on to what you have.
RSI between 30 and 70: It's like a yellow light, showing that things are neither too hot nor too cold. It means the market is in a neutral state, and you might want to use other tools to make your decision.
Using RSI in Crypto Trading
Here are some practical tips for using RSI in your crypto trading:
Double-Check with Other Tools: RSI works best when you use it together with other tools and analysis methods. Don't rely solely on it.
Look for Divergence: Keep an eye out for times when RSI disagrees with the price. If RSI is showing one thing and the price is doing something else, it could signal a change in the market.
Adjust Your Settings: You can tweak the RSI settings to match the crypto you're trading. Shorter periods (like 7 days) react faster, while longer ones (like 21 days) give smoother signals.
Manage Risks: Always be careful and use good risk management. RSI can help, but it's not a crystal ball. Set stop-loss orders and make wise decisions about how much you're willing to risk.
Conclusion
The Relative Strength Index (RSI) is like a helpful traffic light for crypto traders. By understanding its basics and using it alongside other tools, you can make better decisions in the world of crypto trading. Just remember that RSI is a part of your toolkit, not the whole strategy. Use it wisely and keep learning to become a more successful crypto trader.
Cheers!
GreenCrypto
Follow us for more such articles and trading ideas.

INGERSOLL RAND LTD - Multiple Indicator 📊 Script: INGERRAND (INGERSOLL RAND (INDIA) LIMITED)
📊 Nifty50 Stock: NO
📊 Sectoral Index: NIFTY INFRASTRUCTURE
📊 Sector: Industrials - Capital Goods
📊 Industry: Industrial Products - Compressors & Pumps
Key highlights: 💡⚡
I have used 4 indicators which is as follow:
1. Bollinger Bands (BB)
2. MACD
3. RSI
4. MOVING AVERAGE CROSSOVER
📈 Script is trading at upper band of Bollinger Bands (BB) and giving breakout of it.
📈 MACD is giving crossover.
📈 Double Moving Averages also giving crossover.
📈 Current RSI is around 67.
📈 One can go for Swing Trade.
⏱️ C.M.P 📑💰- 2292
🟢 Target 🎯🏆 - 2475
⚠️ Stoploss ☠️🚫 - 2194
⚠️ Important: Always maintain your Risk & Reward Ratio.
⚠️ Purely technical based pick.
✅Like and follow to never miss a new idea!✅
Disclaimer: I am not SEBI Registered Advisor. My posts are purely for training and educational purposes.
Eat🍜 Sleep😴 TradingView📈 Repeat🔁
Happy learning with trading. Cheers!🥂

Jubilant Pharmova Limited - Bullish on Chart📊 Script: JUBLPHARMA (JUBILANT PHARMOVA LIMITED)
📊 Nifty50 Stock: NO
📊 Sectoral Index: N/A
📊 Sector: Healthcare
📊 Industry: Pharmaceuticals
Key highlights: 💡⚡
📈 Script is trading at upper band of Bollinger Bands (BB) and giving breakout of it.
📈 MACD is giving crossover.
📈 Double Moving Averages also giving crossover.
📈 Volume is increasing along with price which is volume breakout.
📈 Current RSI is around 69.
📈 One can go for Swing Trade.
⏱️ C.M.P 📑💰- 370
🟢 Target 🎯🏆 - 450
⚠️ Stoploss ☠️🚫 - 329
⚠️ Important: Always maintain your Risk & Reward Ratio.
⚠️ Purely technical based pick.
✅Like and follow to never miss a new idea!✅
Disclaimer: I am not SEBI Registered Advisor. My posts are purely for training and educational purposes.
Eat🍜 Sleep😴 TradingView📈 Repeat🔁
Happy Labh Pancham 🪔🎉✨
Happy learning with trading. Cheers!🥂


🔥 AVAX Deep Oversold Bounce PlayAVAX has been on a massive losing streak for well over a year now. Even with BTC being relatively bullish in 2023, AVAX has made a new bear-market low last week.
Nevertheless, this token enjoys a lot of popularity across the internet. With AVAX trading in a historically very strong area of support and the 3-day RSI hitting oversold recently, I think it's time to scout for a potential reversal trade.
Stop just below the recent lows, target at 30$. More defensive traders might want to take (partial) profits around 20$.

LONG NIFTYYou can buy in the green zone I have marked. and take a target till 19,550.
Disclaimer: I am not a SEBI Reg. Analyst, Please do your own research and analysis before trading or investing.


🔥 Bitcoin Most Oversold Since COVID Dump: Incoming Bounce! 🚨If you enjoy this analysis, please like and follow.
I've been quite bearish over the last few weeks. I noted that volatility was extremely low and that the odds were more in favor of a bearish move as opposed to a bullish one.
In the short-term, statistics are more in favor of a bullish bounce, as opposed to a continued sell-off. The daily RSI value (measuring oversold and overbought conditions) has not been this low since the COVID dump back in 2020.
I still believe that BTC will continue to go down over the next months, but that doesn't mean we can have a bounce here and there. Personally, I think we will see some kind of bounce in the near future, which will eventually be sold off again.
Short-term in favor of the bulls, long-term for the bears.
What will happen next week? Share your thoughts in the comments 🙏

NIFTY SHORTTake short trade if market goes up till 19,400
Disclaimer: I am not SEBI reg. Analyst. Do your own research before trading or investing.

🔥 Bitcoin Stochastic RSI Signal +838% Average Gain? Bullish!If you enjoy this analysis, please give it a like and a follow.
The month has not closed yet, but it appears that the slow Stochastic RSI (orange line) will close above the 80 line for the first time since November 2021. I've made several bearish analyses over the last few weeks, but this one is a more bullish one (on average!).
Historically, once the orange line from the Stochastic RSI closes above the orange line it means that a pump is coming. 3/4 times a very decent move has occurred from the moment it went over 80, till it crossed below 80. On average, a +838% move has followed.
We can say with quite some certainty that a +838% move is out of the question. Still, the market has historically performed well.
Personally, I'm anticipating a move like in 2019, where the orange line reached above 80 and moved below it in the following month.
Is this bullish to you? Share your thoughts in the comments 🙏

🔥 Bitcoin Bears In Danger.. Or Not?Quick and dirty analysis coming in.
BTC just hit a 3 week diagonal resistance. For the bulls it's going to be a make it or break it moment. If we can close the day above 29.8k we can make the assumption that the relative bearish times are over.
However, we're not there yet! Stocks have sold off hard today, which makes it more likely for bearish price action. In addition, the hourly RSI is quite overbought at the moment. Wouldn't be surprised if we reverse from this point onwards.
Too early to be bullish. Aggressive bears are shorting here, will they be right?
Discuss your views below 🙏

Falling Wedge for Reversal | $110Weekly Chart
PAYPAL NASDAQ:PYPL is in the Falling Wedge and can break in this month. Just follow it
We have good signals
- Divergence RSI
- Failling Wedge
So wait and see next move

Gold or Nasdaq: What to Short this Week?For Gold (XAU/USD), the 4-hour chart suggests a neutral-to-bearish stance. While the pair is currently above its moving averages, the 50-day moving average is closely trailing its price. The Relative Strength Index (RSI) is dropping towards a neutral level, indicating a potential pause in buyer activity. If Gold drops below $1,945, there is a risk of prices descending further and retesting their previous lows or the 200-Day Simple Moving Average (SMA) around $1,941.
The deciding factor for Gold this week will likely be the US jobs data. The Non-Farm Payroll (NFP) report on Friday is a significant event, and the precursor jobs data (JOLTS Job report on Tuesday) could also sway traders. The market expects the NFP to show 190K jobs added, more than double the natural US growth rate. A strong jobs figure could influence traders' anticipation of the Federal Reserve's interest rate decision and impact the downside outlook for Gold.
On the other hand, Nasdaq and other major US indices are expected to end July with gains. The Dow Jones has particularly shown impressive growth over the past two weeks. The outperformance of the Dow Jones suggests a possible shift by investors from growth stocks (such as Nasdaq stocks) to value stocks.
Looking at the daily chart, the Nasdaq Composite is now targeting a key resistance level at 14,649. However, there is a possibility of aggressive seller response at that level. On the 4-hour chart, a divergence with the MACD indicates weakening momentum, which is often followed by pullbacks.
Earnings reports from major tech companies, Apple and Amazon, will be crucial for Nasdaq this week. These two giants represent 11.6% of the entire Nasdaq index measured by market cap. Better-than-expected US earnings could potentially prolong the bull run in the market.
