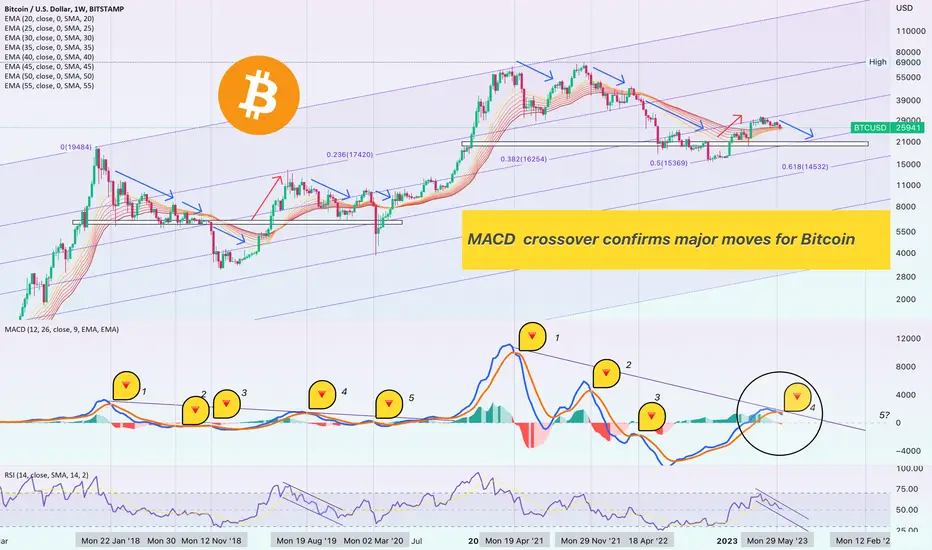
Bitcoin Rolling MACD CrossOver in Five PhasesHello dear community! Let's explore the relationship between the MACD and Bitcoin price action on the Weekly time-frame and draw conclusions based on historical data.
Phases 1 - 5 in 2018 - 2020
Upon analyzing the MACD window, we can discern distinct phases characterized by downward crossovers in the moving average (MA). Commencing from 2018, Phase 1 began with the first downward crossover on 22nd January 2018. In Phase 2, the second downward crossover materialized on 30th July 2018. Moving to Phase 3, the third downward crossover occurred on 12th November 2018. Transitioning to Phase 4, the fourth downward crossover took place on 19th August 2019.
By analyzing the first and fourth downward crossovers, we can establish a trendline that was subsequently breached when the bull market emerged.
Phases 1 - 5 in 2021 - 2024
Phase 1, the subsequent market phase, commenced shortly after the MACD reached a new all-time high around 19th April 2021. In Phase 2, the second downward crossover occurred on 29th November 2021. Following that, in Phase 3, the third downward crossover took place on 18th April 2022. Similar to the consolidation observed in 2019, a period of pause was experienced. Finally, in Phase 4, the fourth downward crossover occurred on 29th May 2023. It is important to note that the fifth phase is yet to be witnessed, as we await the occurrence of the fifth downward crossover in 2024.
Can we utilize this data to gain insights into the potential future movement of Bitcoin?
It is often observed that history repeats itself in financial markets, albeit with some variations in volatility. Therefore, based on the MACD study, we can glean a clue regarding how the price might behave during Phase 4, which suggests a downward movement.
Furthermore, let's briefly examine the RSI indicator. In Phase 4 of 2019, the RSI consolidated within a downward channel, and upon observing the current state in 2023, it appears that the RSI is exhibiting a similar pattern.
Relative Strength Index (RSI)
Enhance Your Trading Strategy with MACD and RSI ConvergenceIntroduction:
Welcome, fellow traders! Today, I'm excited to present a step-by-step tutorial on how to enhance your trading strategy using a combination of two powerful technical indicators: Moving Average Convergence Divergence (MACD) and Relative Strength Index (RSI) .
Section 1: Understanding MACD and RSI - Exploring the Components
MACD:
The MACD consists of three components:
MACD line : Represents the difference between two moving averages, typically the 12-day and 26-day exponential moving averages.
Signal line : A 9-day exponential moving average of the MACD line.
Histogram : Displays the difference between the MACD line and the signal line, providing visual cues about the momentum of the price movement.
RSI:
The RSI is an oscillator that measures the strength and speed of price movements on a scale from 0 to 100.
Readings above 70 indicate overbought conditions, suggesting a potential price reversal.
Readings below 30 indicate oversold conditions, suggesting a potential price bounce.
Divergence between price and RSI can be a signal of a trend reversal.
Section 2: The Idea Behind the Strategy - Combining MACD and RSI
By aligning the signals of MACD and RSI , we aim to increase the reliability of our trading decisions.
When both indicators provide signals in the same direction, it enhances the probability of a successful trade.
The convergence of MACD and RSI helps filter out false signals and focus on high-probability trade setups.
Section 3: Implementing the Strategy - Identifying Bullish and Bearish Signals
Look for a bullish crossover:
MACD line crossing above the signal line , indicating upward momentum.
Confirm the bullish signal: Ensure the RSI reading is above a specific threshold, such as 50, indicating strength in the upward move.
Consider additional confirming indicators, such as positive divergence or breakouts from key resistance levels.
Identifying Bearish Signals:
Identify a bearish crossover:
MACD line crossing below the signal line , indicating downward momentum.
Confirm the bearish signal: Ensure the RSI reading is below a specific threshold, such as 50, indicating weakness in the downward move.
Consider additional confirming indicators, such as negative divergence or breakdowns from key support levels.
Section 4: Backtesting and Refinement - Improving Performance and Accuracy
The Importance of Backtesting:
Gather historical price data for the desired trading instrument and timeframe.
Apply the MACD and RSI convergence strategy to the historical data.
Analyze the performance of the strategy, considering factors such as win rate, average gain/loss, and maximum drawdown.
Adjust the threshold levels, timeframe, or other parameters to improve the strategy's performance.
Refining the Strategy:
Consider incorporating additional technical indicators, such as trend lines, Fibonacci levels, or volume analysis, to further confirm trade signals.
Evaluate the strategy's performance across different timeframes and trading instruments to identify its strengths and weaknesses.
Continuously monitor and adapt the strategy to changing market conditions and refine it based on your trading style and preferences.
Section 5: Risk Management and Trade Execution
Effective Risk Management:
Determine appropriate position sizes based on your risk tolerance and account balance.
Set stop-loss orders to limit potential losses if the trade goes against you.
Establish profit targets to secure gains and exit the trade when the desired level is reached.
Regularly review and adjust risk management parameters as needed.
Conclusion:
Congratulations! You've completed the tutorial on leveraging MACD and RSI convergence to enhance your trading strategy. By combining these powerful indicators, you now have a valuable tool in your trading arsenal. Remember to practice in a demo environment (aka. Paper Trading) before applying the strategy with real funds, and always adapt it to the evolving market conditions.
Feel free to share your progress, ask questions, and discuss your experiences in the comments section. Let's learn from each other and continue refining this strategy together. Best of luck on your trading journey!
Note: Trading involves risks, and this tutorial is for educational purposes only. Always conduct your own research, seek professional advice, and practice responsible risk management.

🔥 BNB Waiting For Oversold Bounce Break OutBNB has been a leading bearish crypto over the last couple of days, which has most likely to do with the legal issues that both Binance and CZ are currently facing.
Nevertheless, I think that BNB is still a worthwhile asset. With BNB hitting daily oversold (bottom indicator is daily RSI), I'm expecting some kind of bounce in the near future.
The entry signal will be once BNB can successfully close an hourly candle above the dotted purple resistance. Stop below the recent swing low (currently 263) and a target of 300.

🔥 CFX First Daily Oversold In 2023 Bounce IdeaCFX has seen incredible gains in the start of the year. However, we've been largely been trading rangebound since the March top.
As of today, CFX's daily RSI is on the edge of being oversold. This is the first time since half December that the RSI has hit daily oversold levels. This is significant because it has taken 6 months for it to happen, hence I'm anticipating bulls to step in.
Keep in mind that we're currently in a news-related event, so volatility is to be expected. The signal will activate once the daily RSI has closed below 30.

AUD/CAD This is just an example of technical analysisIf helps you, please like and share.
#price_action FX:AUDCAD

🔥 APE Crazy Bullish Divergence: Best Trade Of The Summer!APE has been roughly selling off since the start of the year. This trade anticipates that the selling is over and that the bottom is in for the time being. The idea is that the massive bullish divergence on the price vs RSI will cause a huge uptick in bullish pressure, further reassured by a bullish long-term BTC and stock market.
When we place the stop below the current daily low of 2.99 and a target of 6.40 (the year to date high), we can create a trade with an insane risk-reward of almost 26. This can potentially be one of the best trades of the summer.
Based on your preference you can take partial profits around 3.50 and 4.60

Cigna Group, RSI Bullish Divegrence at the 800 Day EMACigna is showing quite a bit of RSI Bullish Dievegrence as it trades at the 800-Day EMA for the second time; we could eventually see this result in a rally to atleast make a 50%-78.6% retrace.

🔥 XRP Overbought: Reversal Trade With Great Potential RewardXRP has been seeing great price action over the last 2 weeks or so. However, XRP is going up whilst BTC is going down, which puts it at risk of being dragged downwards by Bitcoin.
This trade is based on the idea that Bitcoin will continue to trad bearish, and XRP will eventually follow.
To further strengthen our bearish bias, XRP is both reversing from a historically strong area of resistance and the daily RSI is overbought.
A defensive trader can take partial profits and/or move the stop at 0.44 and 0.4

🔥 EOS Oversold Double Bottom Bounce: High Risk/Reward! Like most cryptos, EOS is currently seeing a bullish bounce after weeks of selling. There's two reasons on why EOS might see a strong bullish move coming in the near future.
- The daily RSI has reached oversold.
- The price has found support in a 1 year old support area.
Wait for the price to close above the 0.92 level, which is a short-term resistance. Target is placed at the recent highs. More defensive traders could move their stops to break even and/or take partial profits around $1.

CapitaLand Ascendas REIT (A17U) weekly chart*** non-dividend adjusted
Ever since the hugh drop back in Sep 2020 (covid), it has been a choppy slight downtrend path connecting most of the Peaks & Troughs (ignore occasional exceptional dips)
More than 10 times, lower channel were tested and perhaps we can expect it will happen again
So buy on dip along lower channel? Of course u decide your own😀


Big Bounce from here Thanks NVDA RSI BounceSo last night we witnessed NVDA we saw NVDA come up from a BULLISH GRAVE. I mean GEEEEEEEZ LA WEEEZ. This is the same bounce that the market seen from META, AMAZON and APPLE . The market was in a slump and then boom tech came into save the day. So as you can see on the 30 mins and hourly channel. We are indeed oversold and this along side with the QQQ being bullish late in th week this will carry over into next week. But here's my outlook on things was we head into WITCHING . Please do not forget. It's only weeks away and it's the same thing from last March . Please do not trade against the market. Trade with the market. The first half of June to me will be bullish. Look out for weakness after that.

YTLPOWR, possible continuation?Looking at MYX:YTLPOWR for a continuation to the upside. Overall regional peers are lower however, might or might not trigger.
Trigger: RM1.10
STOP: RM1.06
Target: RM1.19
These are my views and analysis and is only used for educational purposes. I am not a financial advisor.
Nothing in the information posted here is intended to be or should be interpreted as trading advice.

PWF breaking out for next legTAIFEX:PWF1! is breaking out of the immediate resistance level of 0.74 now.
Next hurdle is 0.76 and then possibly 0.86.
These are my views and analysis and is only used for educational purposes. I am not a financial advisor.
Nothing in the information posted here is intended to be or should be interpreted as trading advice.

JKS - It's a challenging uphill battle!Breaking the recent downward trend will be a challenging task, despite our strong support. Currently, we are below both the 200-day moving average (turquoise line) and the 50-day moving average (gray line), and we also need to surpass the RSI 50 level to initiate a strengthening.
If the upward movement begins, we will face resistance at the 50-day moving average around 47, the upper Bollinger Band at 48.5, and the 200-day moving average and RSI 70 level at 50.50 (three red circle). Since the $50 price level is also a psychological barrier, I don't believe we can rise above it without a strong catalyst. Despite robust revenue growth, any potential issues with US authorities could force the stock to trade sideways within the range of 42-50.

Tesla Bottoming Out Currently Bottoming out and will probably be back above $300 within the next 3 month.
*Oversold
*Market Exhaustion
*Resistance

GBP/USD SWING TRADE TO PLAY OUT OVER WEEK GBP/USD SWING TRADE TO PLAY OUT OVER WEEK
Linear regression channel hit w/bullish candle
Waiting for 21 ema cross
RSI O/S & Coming out
MACD CROSS
When all criteria met and in confluance we take trade.
Long- 110.75
Tp-127.11
Sl-104.77
RR-1:3
Margin-100k/5%/5k
Lev-3X

WCEHB ready for another leg up?I am of the view that MYX:WCEHB might be seeing another leg up towards the 0.55 region. Base well supported, Stops would be the recent low at 0.475.
These are my views and analysis and is only used for educational purposes. I am not a financial advisor.
Nothing in the information posted here is intended to be or should be interpreted as trading advice.

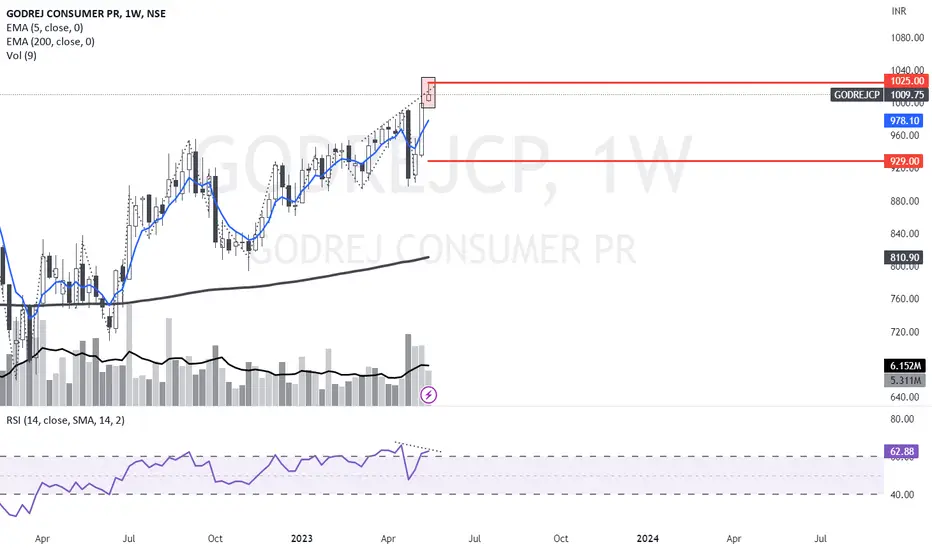
GODREJCP Weekly Bearish Divergence.Bearish RSI Divergence is evident on the chart. It would be a clearer indication if the RSI turns down making a lower high and price trades below the weekly low of 1001. If price trades below 1000 and if closes on the daily below that level, we could expect a target of 930.
TIMECOM awaiting breakout to the upsideMYX:TIMECOM awaiting a breakout of RM5.70 to the upside. Initial targets being RM5.95 with stops below RM5.58.
These are my views and analysis and is only used for educational purposes. I am not a financial advisor.
Nothing in the information posted here is intended to be or should be interpreted as trading advice.

SHH looking for a continuation to upside? MYX:SHH could be looking for another continuation to the upside. However risks are higher with this as liquidity is not too good. A break of 0.98 would possibly lead to targets of 1.06 and then 1.33.
Lets see if I get it right
These are my views and analysis and is only used for educational purposes. I am not a financial advisor.
Nothing in the information posted here is intended to be or should be interpreted as trading advice.

YTL forming flag patternMYX:YTL looks like it is flagging for a continuation pattern to the upside.
If it manages to break 0.675, I am estimating next resistance to be around 0.69 and then if this level gets broken, 0.72. Similar moves to MYX:YTLPOWR which I posted earlier.
These are my views and analysis and is only used for educational purposes. I am not a financial advisor.
Nothing in the information posted here is intended to be or should be interpreted as trading advice.

YONGTAI breaking resistance? MYX:YONGTAI retook Friday's high and absorbed the selling pressure. I am feeling bullish that this name could see more upside in the near short term future with a target of 0.435 if 0.38 manages to break. Of course if 0.35 gets breached, the setup is invalidated.
These are my views and analysis and is only for educational purposes. I am not a financial advisor.
Nothing in the information posted here is intended to be or should be interpreted as trading advice.
