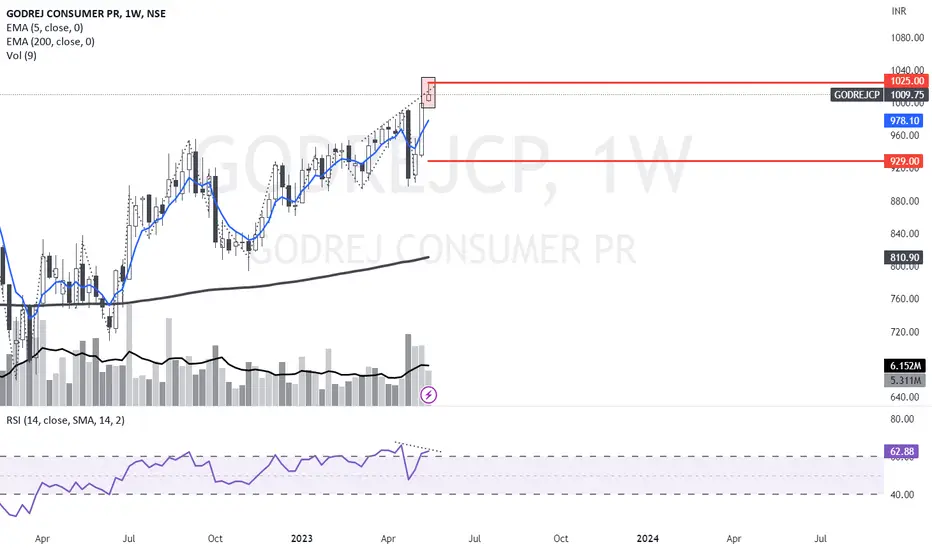
GODREJCP Weekly Bearish Divergence.Bearish RSI Divergence is evident on the chart. It would be a clearer indication if the RSI turns down making a lower high and price trades below the weekly low of 1001. If price trades below 1000 and if closes on the daily below that level, we could expect a target of 930.
Relative Strength Index (RSI)
TIMECOM awaiting breakout to the upsideMYX:TIMECOM awaiting a breakout of RM5.70 to the upside. Initial targets being RM5.95 with stops below RM5.58.
These are my views and analysis and is only used for educational purposes. I am not a financial advisor.
Nothing in the information posted here is intended to be or should be interpreted as trading advice.

SHH looking for a continuation to upside? MYX:SHH could be looking for another continuation to the upside. However risks are higher with this as liquidity is not too good. A break of 0.98 would possibly lead to targets of 1.06 and then 1.33.
Lets see if I get it right
These are my views and analysis and is only used for educational purposes. I am not a financial advisor.
Nothing in the information posted here is intended to be or should be interpreted as trading advice.

YTL forming flag patternMYX:YTL looks like it is flagging for a continuation pattern to the upside.
If it manages to break 0.675, I am estimating next resistance to be around 0.69 and then if this level gets broken, 0.72. Similar moves to MYX:YTLPOWR which I posted earlier.
These are my views and analysis and is only used for educational purposes. I am not a financial advisor.
Nothing in the information posted here is intended to be or should be interpreted as trading advice.

YONGTAI breaking resistance? MYX:YONGTAI retook Friday's high and absorbed the selling pressure. I am feeling bullish that this name could see more upside in the near short term future with a target of 0.435 if 0.38 manages to break. Of course if 0.35 gets breached, the setup is invalidated.
These are my views and analysis and is only for educational purposes. I am not a financial advisor.
Nothing in the information posted here is intended to be or should be interpreted as trading advice.

USOUSD rises on reversal USOUSD today on the 15-minute chart dropped on a downtrend outside the Bollinger (lower)
Band (49, ohlc,2) hit a Doji candle and then started the upward retracement. The RSI indicator
shows relative strength hitting a bottom and bouncing up. RSI is about to go over 50. Price
is currently below the high volume area with the POC line aligned with the basis center line
of the Bollinger Bands. The ECHO indicator, a predictive algo tool is for a 2.5 % upward trend
over the next 2-3 days. I see this as a good entry point for a long leveraged forex trade.

AUDJPYAUDJPY on the 30-minute chart has had higher lows but also lower highs and may have
a symmetrical triangle pattern. Price is currently at or above the following :
(1) the POC line of the long-term volume profile (2) the mean line of the long-term anchored
VWAP (blue line ) and the convergence of the EMA 200 ( red) and EMA 21 ( green). On the
stochastic RSI the lines are moving upward from a bottom well below 20 and suggest bullish
divergence. Given these confluences, I conclude that AUDJPY is set up to move higher over
the intermediate term.

SEAL looking at a flag breakout MYX:SEAL is flagging and pending a breakout to the top. I the close for today maintains above 0.42, I think possible targets towards 0.47 soon with stops at 0.40
These are my views and analysis and is only for educational purposes. I am not a financial advisor.
Nothing in the information posted here is intended to be or should be interpreted as trading advice.

Is GOOG ready for bullish continuation?GOOG has had a good month thus far rising about 9% and relatively strong compared with
QQQ ( black line on chart) as shown on this one-hour chart. The past couple of days it has
rested in consolidation at the upper volume shelf on the profile. The stochastic RSI has the
lines low below the oversold /undervalued line of 25 and "curling up" suggesting they are about
to cross. The 24 hour running average volume indicator shows stable volume at a level higher
than April. No matter it may be overextended, GOOG has consolidated to base the next leg
up. Its high liquidity and low spreads make for a long entry of stock or call options.

Introducing the Trendicator (by Stock Justice)In this comprehensive tutorial, we dive deep into the world of the Trendicator, a powerful and innovative trading tool made by @StockJustice that enables traders to identify trends, spot reversals, detect bullish and bearish divergences, and perform multi-timeframe analysis. We delve into the inner workings of this never-before-seen indicator, demystifying its complex algorithms and showing you how to harness its full potential. From understanding the unique features of the Trendicator such as its compression stages, divergences, and MACD crossovers, to learning how to pair it with a Displaced Aggregated Moving Average (DACD) for enhanced precision, we cover it all in a fun and engaging manner.
The tutorial is not just about explaining the Trendicator's functionalities, but it also provides practical tips and strategies for using it in real-world trading scenarios. We discuss how the Trendicator can help traders spot the onset of a trend, gauge its strength, and pinpoint potential reversal points. Additionally, we explain how traders can utilize the bullish and bearish divergences identified by the Trendicator to anticipate market turns and make informed trading decisions.
Lastly, we emphasize the importance of multi-timeframe analysis in trading and demonstrate how the Trendicator can facilitate this process. By interpreting the Trendicator's signals across different timeframes, traders can gain a more comprehensive view of the market and make more accurate predictions. This tutorial is a must-watch for any trader aspiring to level up their technical analysis skills and trade more confidently and effectively. So, get ready to embark on an exciting journey of learning and discovery with the Trendicator!

AUD/NZD This is just an example of technical analysisIf helps you, please like and share.
#price_action FX:AUDNZD

Introducing the Dynamic Fusion OscillatorHello, it's Stock Justice here! In our latest video, we delve into the world of the Dynamic Fusion Oscillator (DFO) - a tool that blends the power of the Relative Strength Index and the Stochastic Oscillator. I walk you through how it works, from understanding these two base components to how we fuse them to create a balanced and sensitive tool for identifying market trends and reversals.
We dive deep into how the DFO uses moving averages to signal potential bullish or bearish trends, and how divergence within the DFO can indicate trend reversals or continuations. I also touch on the DFO's capacity for multi-timeframe analysis, giving you the bigger picture of market trends.
Wrapping up, I remind you of the DFO's value as a versatile trading tool, but also emphasize the importance of using it alongside proper risk management and other technical analysis components. All in all, this video is a must-watch for traders aiming to enrich their toolkit and navigate the market more effectively!

Looking at SALUTE for another wave upAfter pulling back and consolidating, I am looking at MYX:SALUTE to stage another wave up.
Trigger: 0.965
Stop: 0.87
Targets: 1.28,then 1.57
These are my views and analysis and is only used for educational purposes. I am not a financial advisor.
Nothing in the information posted here is intended to be or should be interpreted as trading advice.

ORCL - Rising Trend Channel [MID TERM]- ORCL is in a rising trend channel in the medium long term.
- ORCL has broken a resistance level in the short term and given a positive signal for the short-term trading range.
- There is no resistance in the price chart and further rise is indicated.
- In case of a negative reaction, the stock has support at approximately 90.
- RSI diverges negatively against the price, which indicates danger of a reaction downwards.
- Overall assessed as technically positive for the medium long term.
*EP: Enter Price, SL: Support, TP: Take Profit, CL: Cut Loss, TF: Time Frame, RST: Resistance, RTS: Resistance to be Support LT TP: Long Term Target Price
*Chart Pattern:
DT - Double Top | BEARISH | RED
DB - Double Bottom | BULLISH | GREEN
HNS - Head & Shoulder | BEARISH | RED
REC - Rectangle | BLUE
iHNS - inverse head & Shoulder | BULLISH | GREEN
Verify it first and believe later.
WavePoint ❤️

INDHOTEL MULTI MONTH BREAKOUT#INDHOTEL is showing a multi-month breakout, and we're seeing some exciting potential for an upward trend. With strong support levels at 340-345, this could be the perfect opportunity to get in on the ground floor and watch those profits climb. Our analysts are predicting targets of 400, 433, and even 455+.

BTC Holds at Crucial Support AreaBTC is currently sitting in the Fibonacci 0.618 retracement area of the recent rise with support from the 200-period exponential moving average.
The loss of this place could take us to the 25K region. My opinion about the decrease to the 12-14K range has not changed,
I am waiting for the needles to the 9.3-9.8K range, but before this happens, BTC is still reading what it knows.

ABNB - Falling Trend Channel [MID TERM]- ABNB is in a falling trend channel in the medium long term.
- An inverse head and shoulders formation is under development.
- A decisive break of the resistance at 145, ideally with an increase in volume, signals a further rise.
- The stock is between support at 110 and resistance at 126.
- The RSI curve shows a rising trend, which is an early signal of a possible trend reversal upwards for the price as well.
- Overall assessed as technically neutral for the medium long term.
*EP: Enter Price, SL: Support, TP: Take Profit, CL: Cut Loss, TF: Time Frame, RST: Resistance, RTS: Resistance to be Support LT TP: Long Term Target Price
*Chart Pattern:
DT - Double Top | BEARISH | RED
DB - Double Bottom | BULLISH | GREEN
HNS - Head & Shoulder | BEARISH | RED
REC - Rectangle | BLUE
iHNS - inverse head & Shoulder | BULLISH | GREEN
Verify it first and believe later.
WavePoint ❤️

QQETSBB Screener: A Powerful Tool for Monitoring Multiple SymbolQQETSBB Screener: A Powerful Tool for Monitoring Multiple Symbols
Introduction
In the world of trading, having the ability to monitor multiple symbols simultaneously is crucial for making informed decisions. The QQETSBB Screener is a powerful tool that allows traders to keep track of various symbols at once, providing essential information regarding price, volatility, and sentiment. In this blog post, we will explore the strategy implemented by the QQETSBB Screener and explain the table.
Strategy
The QQETSBB Screener uses a combination of mathematical calculations and technical indicators to generate a comprehensive analysis of multiple symbols. It utilizes the following indicators: QQE, SMA, EMA, WMA, RSI, MACD, Stochastic, CCI, MFI, and others. By combining these various indicators, the screener provides a sentiment score and a directional score for each symbol, allowing traders to quickly assess the market conditions for a specific asset.
In-Depth Exploration of the QQETSBB Screener Strategy
The QQETSBB Screener strategy is designed to provide traders with a comprehensive understanding of various symbols at once. This is achieved through a combination of mathematical calculations and technical indicators, which are applied to each symbol being monitored. In this section, we will delve deeper into the strategy, exploring the individual components that contribute to its effectiveness.
1. QQE (Quantitative Qualitative Estimation): The QQE is a volatility-based indicator that measures the difference between the price and a moving average. It is considered a leading indicator, as it can provide early signals of potential price movements. The QQE is used as the primary moving average in the QQETSBB Screener when selected by the user.
2. SMA (Simple Moving Average): The SMA is a widely used technical indicator that calculates the average price of a security over a specified period. It is used to smooth out price fluctuations and identify trends. The QQETSBB Screener incorporates the SMA as an alternative moving average option for users.
3. EMA (Exponential Moving Average): Similar to the SMA, the EMA is a type of moving average that places greater weight on more recent data points. This allows it to react more quickly to recent price movements. The EMA is another alternative moving average option available in the QQETSBB Screener.
4. WMA (Weighted Moving Average): The WMA is another type of moving average that places more emphasis on recent price data. It assigns weights to each data point, which decrease linearly as the data points get older. The WMA is the final alternative moving average option in the QQETSBB Screener.
The QQETSBB Screener strategy utilizes a combination of these moving averages, along with other popular technical indicators, to generate a sentiment score and a directional score for each symbol. These scores provide valuable insights into the overall market conditions for each asset, allowing traders to make informed decisions.
The additional technical indicators used in the QQETSBB Screener strategy include:
5. RSI (Relative Strength Index): The RSI is a momentum oscillator that measures the speed and change of price movements. It is used to identify overbought or oversold conditions in a market. The RSI is incorporated into the sentiment score calculation in the QQETSBB Screener.
6. MACD (Moving Average Convergence Divergence): The MACD is a trend-following indicator that shows the relationship between two moving averages of a security's price. It is used to identify potential trend reversals and is incorporated into the sentiment score calculation in the QQETSBB Screener.
7. Stochastic: The Stochastic is a momentum indicator that compares a security's closing price to its price range over a specific period. It is used to identify potential trend reversals and is also incorporated into the sentiment score calculation in the QQETSBB Screener.
8. CCI (Commodity Channel Index): The CCI is a versatile indicator that measures the difference between a security's price change and its average price change. It is used to identify potential trend reversals and is included in the sentiment score calculation in the QQETSBB Screener.
9. MFI (Money Flow Index): The MFI is a momentum indicator that combines price and volume data to measure the strength of money flowing in and out of a security. It is used to identify potential trend reversals and is incorporated into the sentiment score calculation in the QQETSBB Screener.
10. Haiken Ashi: The Haiken Ashi is a charting technique that uses modified candlestick data to identify trends more easily. The QQETSBB Screener uses the Haiken Ashi method to calculate the overall trend of the symbol, contributing to the sentiment score.
By combining these various indicators, the QQETSBB Screener strategy provides traders with a comprehensive understanding of each symbol's current market conditions. The sentiment and directional scores generated by the screener allow traders to quickly assess the potential opportunities and risks associated with each asset, making it an invaluable tool for enhancing trading strategies and decision-making processes.
Table Explanation
The QQETSBB Screener displays information in a table format, which is divided into several columns:
1. Symbol: Displays the symbol for each asset being monitored.
2. Price: Displays the current price of each asset.
3. Band Spread: Represents the volatility range as a percentage. A larger band spread indicates higher volatility in the asset's price.
4. Segment Spread: Represents 1/4th of the volatility range as a percentage. This helps to identify the specific segment of the volatility range that the asset's price is currently in.
5. Level: Indicates the quarter of the band the price is currently at. This ranges from 0 to 5, with 0 being the lowest and 5 being the highest.
6. Sentiment: Provides a score based on a combination of popular indicators such as RSI, MACD, Stochastic, CCI, MFI, and others. A higher score indicates a more overbought condition, while a lower score indicates an oversold condition.
7. Direction: Displays the direction in which the asset's price is moving, using arrows to indicate an upward (↑), downward (↓), or sideways (→) trend.
Conclusion
In conclusion, the QQETSBB Screener strategy is a powerful and versatile tool that offers traders a comprehensive overview of multiple symbols simultaneously. Its combination of mathematical calculations and technical indicators provides valuable insights into price, volatility, sentiment, and direction, enabling traders to make informed decisions and stay ahead of the market. Whether you are a beginner or a seasoned trader, the QQETSBB Screener can help you navigate the complex world of trading and maximize your potential for success.

AUDUSD Rising LONGOn the 4H chart, AUDUSD is rising over the intermediate term volume profile POC and ascending the anchorded
VWAP bands as well; Price rose from undervalued to fair-valued on the VWAP bands.
The Chris Moody RSI indicator flashed a a pair of buy signals and RSI rose over the 50% line.
Another good sign is price is approaching a volume void /gap on the volume profile. Finally
there was a mild volume spike when price reversed from the bottom of the high volume area on
the profile. I am looking for rising price action in the intraday upcoming once both London
and New York sessions are overlapping.

What is the True Range Osc?Introducing the True Range Oscillator: A Smoother and More Accurate Alternative to RSI
Introduction:
Technical analysis plays a crucial role in the decision-making process of traders and investors. One of the most popular technical indicators is the Relative Strength Index (RSI), which measures the speed and change of price movements. However, the RSI has some limitations, such as losing signal strength when increasing the lookback period. This article introduces the True Range Oscillator, a new technical indicator that provides a smoother and more accurate alternative to the RSI, even when increasing the lookback period.
True Range Oscillator: An Overview
The True Range Oscillator is designed to be a more accurate and smoother alternative to the RSI. It is based on the concept of True Range, which considers the high, low, open, and close prices of an asset. By incorporating the True Range into its calculation, the True Range Oscillator can maintain signal strength even when the lookback period is increased.
The main advantage of using the True Range Oscillator is that it can provide more accurate and smoother signals compared to the RSI. When set to a lookback period of 14, the True Range Oscillator is similar to the RSI, but with a smoother curve. As the lookback period is increased, the True Range Oscillator maintains its signal strength and accuracy, unlike the RSI, which tends to lose its signal strength.
Mathematical Explanation:
The True Range Oscillator is calculated using the following steps:
1. Calculate the True Range: True Range is calculated as the average of the following values: (High - Low), (High - Close), and (Low - Close). This provides a more accurate representation of the price movements compared to the RSI, which only considers the close prices.
2. Calculate the Average True Range (ATR): The ATR is calculated using an exponential moving average (EMA) of the True Range values over the specified lookback period.
3. Calculate the Z-Score: The Z-Score is calculated as (Close Price - EMA of Close Prices) / ATR. This standardizes the price movements, making it easier to compare them across different timeframes.
4. Apply Smoothing: The Z-Score is smoothed using a simple moving average (SMA) with the specified smoothing period.
5. Calculate the Min-Max: The Min-Max function is used to normalize the smoothed Z-Score to a range of 0 to 100. This is done by subtracting the minimum value from the Z-Score and dividing it by the difference between the maximum and minimum values.
Normalized Price Oscillators:
Normalized price oscillators are a class of technical indicators that measure the strength or weakness of a financial instrument's price movement by normalizing its price data. This normalization typically involves converting the price information into a more standardized format, such as a percentage or an index, which makes it easier to compare and analyze price movements across different timeframes and financial instruments.
Normalized price oscillators are particularly useful for identifying overbought and oversold market conditions, as well as potential trend reversals. By analyzing and comparing the normalized price data, traders can make more informed decisions and better understand the underlying market dynamics.
True Range Oscillator and RSI as Normalized Price Oscillators:
Both the True Range Oscillator and the Relative Strength Index (RSI) are normalized price oscillators. They convert the raw price data into a standardized format, making it easier to analyze and compare price movements.
In the case of the RSI, the price data is normalized using the Relative Strength (RS) calculation, which results in an index value ranging from 0 to 100. This index value provides a clear indication of the overall strength or weakness of the price movement and helps traders identify overbought or oversold market conditions.
The True Range Oscillator, on the other hand, is normalized through the Min-Max function, which also results in an index value ranging from 0 to 100. This normalization process takes into account the high, low, open, and close prices, providing a more comprehensive and accurate representation of the price movements.
Why the True Range Oscillator is a Good Normalized Price Oscillator:
The True Range Oscillator stands out as a superior normalized price oscillator for several reasons:
1. Comprehensive Price Data: By incorporating the high, low, open, and close prices, the True Range Oscillator provides a more accurate representation of the price movements, leading to better decision-making.
2. Maintaining Signal Strength: The True Range Oscillator maintains its signal strength and accuracy even when the lookback period is increased, making it a more reliable tool for longer-term analysis.
3. Smoother Indicator: The True Range Oscillator produces a smoother curve compared to the RSI, making it easier to identify trends and reversals, and reducing the noise created by price fluctuations.
4. Minimizing False Signals: The True Range Oscillator can better filter out false signals caused by sudden price movements, thanks to its incorporation of the True Range into its calculation.
5. Customizable Outlier Level: The True Range Oscillator allows users to set a customizable outlier level, which helps to further filter out extreme price movements and reduce false signals.
To better understand the advantages of the True Range Oscillator, it is essential to delve into the history and workings of its predecessor, the Relative Strength Index (RSI).
History of RSI:
The Relative Strength Index (RSI) was developed by J. Welles Wilder Jr. and introduced in his 1978 book, "New Concepts in Technical Trading Systems." The indicator quickly gained popularity among traders and investors due to its simplicity and effectiveness in identifying overbought and oversold market conditions. The RSI is a momentum oscillator that measures the speed and change of price movements by comparing the magnitude of recent gains to recent losses.
How RSI Works:
The RSI is calculated using the following steps:
1. Calculate the average gains and losses over a specified lookback period, typically 14 days.
2. Calculate the Relative Strength (RS) as the ratio of the average gains to the average losses.
3. Normalize the RS to a range of 0 to 100 using the formula: RSI = 100 - (100 / (1 + RS))
Despite its popularity and widespread use, the RSI has some limitations that the True Range Oscillator aims to address.
Why the True Range Oscillator is Better:
1. Comprehensive Price Data: While the RSI only considers the closing prices, the True Range Oscillator takes into account the high, low, open, and close prices. This provides a more accurate representation of the price movements and helps to prevent false signals caused by sudden price fluctuations.
2. Maintaining Signal Strength: A significant drawback of the RSI is its loss of signal strength when the lookback period is increased. In contrast, the True Range Oscillator maintains its signal strength and accuracy even with an extended lookback period. This makes it a more reliable tool for longer-term analysis.
3. Smoother Indicator: The True Range Oscillator produces a smoother curve compared to the RSI, making it easier to identify trends and reversals. This can help traders make more informed decisions by reducing the noise created by price fluctuations.
4. Minimizing False Signals: By incorporating the True Range into its calculation, the True Range Oscillator can better filter out false signals caused by sudden price movements. This can help traders avoid making hasty decisions based on misleading signals.
5. Customizable Outlier Level: The True Range Oscillator allows users to set a customizable outlier level, which helps to further filter out extreme price movements and reduce false signals.
Conclusion:
In conclusion, the True Range Oscillator is an excellent example of a normalized price oscillator that offers enhanced accuracy and reliability compared to the conventional RSI. By considering a broader range of price data, maintaining signal strength over longer lookback periods, and providing a smoother curve, the True Range Oscillator provides a more comprehensive analysis of price movements. This makes it an ideal tool for traders and investors looking to improve their technical analysis and make more informed decisions in the ever-changing financial markets. The True Range Oscillator's ability to minimize false signals and offer customizable outlier levels further adds to its value, making it a valuable addition to any trader's toolkit.

VNQ Monthly ChartBack then:
VNQ falls below 20 SMA in Jul 2007
Double attempt to rebound (red arrows) but failed
after struggling 15 months, a sell off begin in Oct 2008
Now:
VNQ falls below 20 SMA in Jun 2022
Double attempt to rebound (red arrows) but failed
RSI remained in low levels below 50 (more bearish than bullish)
Might not seen the worst yet, unless RSI reverse back above 50

Is $EBAY Completing a Bearish Head and Shoulders Top?Is NASDAQ:EBAY Completing a Bearish Head and Shoulders Top?
The monthly chart is pretty close to completing the right shoulder in what looks to be a bearish Head and Shoulders formation.
Measuring from the top of the head down to the neck line would put the price target down to $3.00 and change.
It will be interesting to continue to watch what the 14 RSI does as it approaches 50, which is usually a resistance point in downtrends.
Hard to say if it will go that low, or if the right shoulder will even complete the bear flag it is in the middle of right now.

NDX - Rising Trend Channel [MID TERM]- NDX is in a rising trend channel in the medium long term.
- The index has given a positive signal from the double bottom formation by a break up through the resistance at 12042.
- Further rise to 13396 or more is signaled.
- The index is between support at points 13000 and resistance at points 13700.
- A definitive break through of one of these levels predicts the new direction.
- RSI diverges negatively against the price, which indicates danger of a reaction downwards.
- Overall assessed as technically positive for the medium long term.
*EP: Enter Price, SL: Support, TP: Take Profit, CL: Cut Loss, TF: Time Frame, RST: Resistance, RTS: Resistance to be Support LT TP: Long Term Target Price
*Chart Pattern:
DT - Double Top | BEARISH | RED
DB - Double Bottom | BULLISH | GREEN
HNS - Head & Shoulder | BEARISH | RED
REC - Rectangle | BLUE
iHNS - inverse head & Shoulder | BULLISH | GREEN
Verify it first and believe later.
WavePoint ❤️
