CSC-HARSI with Buy SEll alerts and (Name the next one)Welcome, welcome.
In today's video I have some way for you all to get involved in a little bit of the development of this indicator. As you read below you'll be able to do me a favor and leave your comments the topic at the bottom where you can name the next indicator tied to the CSC-HARSI 2022.
So what would you call it?
Read on......
Once again we've returned to the coffee shop and I have a bit of an i-told-you-so video. Sorry this video goes on a lot longer than I thought it would but I had to bring up a few points and I got a little excited telling you guys about some of the new indications and alerts on the CSC-HARSI 2022.
The next update will include indications and alerts that tell you when you have entered into a range when you have broken up out of a range when you have a range break down it will also include buy and sell indications as well as when you should exit your long trade or exit your short trade.
All that being said you shouldn't use this tool as the be-all end-all for your entries and exits because you will still need to understand a little bit something about price action. While the indicator itself will work very well at telling you when to get in and out of Trades whether you're long or short the combined indicator of the mass effect moving average will help you understand when the trade you're about to enter into before a long for example is a price manipulation and at which point you don't want to get into that trade so I'm doing my best to get you that information and give you that indicator as well but it's going to be a little time before that Mass Effect moving average is complete.
However on today's idea about the CSC-HARSI 2022, I wanted to drop a quick video and tell you about some of the upcoming changes so that you guys can come back and give you some ideas and comments below about anything that you're looking for or if you have any guidance on when and how things should be clearly defined in the layout.
The reason I bring up these particular points is because after this particular update I will not be updating it unless I need to keep it current to Pine script coding. I simply don't want to over code this indicator was too many alerts and indications and plots and images and stuff like that this should work on this next release well enough on its own while though I do have another idea for another script which you can use along with the CSE hard see if you want and end up having both of them in the bottom of your panel if you like but that 12 is going to take at least a few weeks ago.
Since it will be working as a brother to the CSC-HARSI 2022, I'd like to hear back from you guys on what I should name it.
Relative Strength Index (RSI)

MK RESTAURANT GROUP - short positionThe RSI indicator is above 70 which shows overbought conditions.
We expect that the price will get rejected at the resistance level . Next we expect the price to retest the downsloping trendline as a support.
Entry, stop loss and target are shown in the chart.

COGT a botechology stock with a great uptrend SHORTCOGY a biotechonology stock is doing what others
in the sector typically do in their performance when they
ignore general market dynamics and often hold up in recessions.
COGT has 4Xed since May earnings so ALPHA is high.
Right now the RSI is down trending so showing bearish divergence.
Additionally, the mass index went over the threshold and
then under the trigger suggesting an impending reversal.
The ADX indicator which has been as high as 100 for both up and down
trends is nearly zero. Although not shown on the chart, the mass
index indicator has triggered.
I conclude that COGT has ran up and extended too far and is now
set up for a short trade.

ETHUSD - Shapes of a Bottom Feat. The CMF & RSI"Ah, freak out! Le freak, c'est Chic Freak out!"
I made this chart in an attempt to counteract the various freak-out fests I have seen on Twitter and Telegram these last few months. I am not sure what charts the Freak-Out Crew (FOC) are watching, but they can't be the same ones as I am looking at today. The cycle low is in and the bottom is being made, what's the problem, bois? A good, solid foundation takes months, not weeks to build so what is left to do, other than appreciate the shape and movement of it all? But, oh the macro! Right, the macro narrative is what made me sell everything during the Covid Crash March 2020; never again, my friends...never again. I have learned to trust the weekly and monthly charts.
I hope the heavily labelled chart is easy enough to understand, if not shoot me a comment down below and I will do my best to help you understand. Also any counter-arguments are very welcome. Enjoy your day. Cheers.

USDJPY Swing LongFX:USDJPY
USDJPY on a 2H chart has been in an ascending parallel channel
and presently sitting on the ascending support line.
I see USDJPY setup as a swing long for the next several
trading sessions and will monitor the RSI by watching more
closely for a downturn to close the trade once it is over 80.

SPX - Volatility & Divergence Good (middle of the night) to you!
I am exploring this massive structural divergence between the RSI Indicator and the UVXY.
Generally, these divergent patterns signal a reversal… and this is on a long enough range that it is implying a reversal from the bull rally of the SPX, which would result in a a bearish continuation pattern for the SPX.
Good Luck, God Speed, Love & Light to All!

IS RIDE heading up hill (LONG)RIDE has finished a downtrend the past ten trading days
and now appears to a retracing that downtrend.
The upside here is about 16% to the mid Fibonacci level.
The MACD shows an early K / D line crossover as a lagging
indicator.
The RSI is in midrange being neither oversold or overbought.
I see this as a setup to trade a swing long trade or a call option
for a 4 week expiration at a price 5-10 % above the current
market price. NASDAQ:RIDE

Is this the last chance to short ?The main short idea is already shared , This is a re-entery. So why I re-share an originally shared setup ?
The thing is that maybe tomorrow we're going to see one of the biggest red candles that we will see in this month. The reason is Fed Chairman Jerome Powell speaks Friday at 10 a.m. ET in a much-anticipated appearance at the Federal Reserve’s annual Jackson Hole, Wyoming, symposium.
Fed watchers do not expect a new message from the Fed chairman, just a tougher version of the central bank’s promise to slow inflation by raising interest rates.
Therefore I think that we're going to see stronger dollar and weaker gold.
Boosting this post will make me more motivated to keep posting signals on a regular basis.
Following will keep you updated with every analysis I share

LOOKING AT USD/JPY AND LEARNING THE ICHIMOKU CLOUD, KDJ AND RSINot the best idea to trade USD/JPY because shaded areas of Ichimoku cloud are low/tight so we don't trade it however there are some clouds that are big and we can trade them because we have 3 yes opinions before making a decision, this means we have 3 indicators that are going well and its something we are looking for. An example is if we are looking for a sell trade than we must all look for 3 indicators which is the Ichimoku Cloud, KDJ and RSI, if all indicators are telling you its a sell than you would sell the trade, if one of the indicators are telling you its a sell but the other two indicators are not than you wouldn't sell the trade.

HEXO Swing LongNASDAQ:HEXO
HEXO is reversing like its peers within the MJ sector;
As a low priced penny stock it is likely to experience
high relative volume.
The bullish increase in relative strength on the RSI
confirms the trend.
See also my ideas on POTX and TLRY.

EUR/GBP: UpdateI'm still bearish in EUR/GBP, but there' a possible bullish divergence in RSI that we formed a lower low and price action too. what we would need to be pending if we forming any bearish rejection in those points to watching in the next hours.
If in case I see a strenght in the candlestick, I will closed up this short position and change for long if we see any bullish pattern signal. But in another hand, we see that Euro it's being affecting by fundamental news that I'm drive for it.
So I made an entry aroound 0.8438 GBP, Stop Loss to 0.8467 GBP and target to 0.8350 GBP.
I hope that this idea support you

Bitcoin (BTCUSD), 4-Hour, A rebound?I think the price will rebound towards the nearest supply zone.
Why? Because we have:
- a successful demand zone rebound
- a double bottom
- a bullish price-RSI divergence
- and high volume.
And it is all that I wanted to pass on to you. Look at the chart!

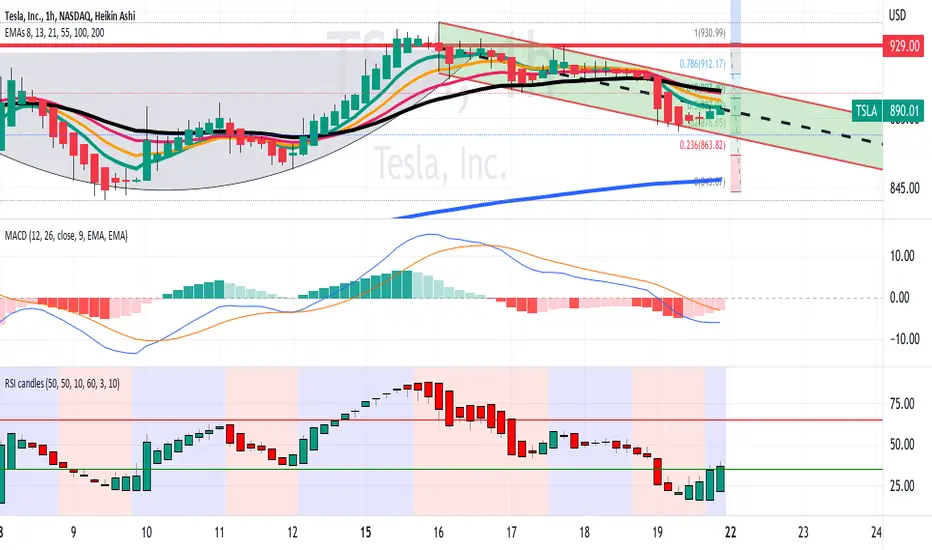
TSLA Early BULL Signal on RSI / MACDNASDAQ:TSLA
On the 1H timeframe chart, TSLA is showing an early reversal as follows:
(1) It is ascending in a downtrend parallel channel
(2) On the MACD, the signal line is below the histogram, and
the K & D lines are converging on this lagging indicator.
The histogram bars are decreasing in negative height.
(3) the color-coded RSI candle indicator shows bullish engulfing
strength candles.
All in all, I see technical signs of a reversal as described here
CAD/JPY - 1H - Rising WedgeCAD/JPY is in a bullish trend, making HHs and HLs and forming a Rising Wedge . The price action is currently making a pullback into the rising support which has a confluence of slow MA dynamic support.
The Bullish Bias is based on the following signals:
Bullish trend (price making HHs and HLs)
GMMA: fast MA above slow MA with separation
Slow MA acting as dynamic support
RSI above 50 and not too near overbought levels
OBV convergence with price (uptrend has conviction)
Expecting bulls to be in control above the rising support. Go short if the wedge breaks downside.
Like & Follow for more such ideas.

GBPUSD SWING SHORTGBP
USD has been in a persistent downtrend for much of the year as the DXY has been strong.
On the weekly chart, the price in the past week did a "buy Pop" up crossing the EMA8 and EMA13
lines, The relative strength topped up and downturned while on the MACD, the lines
have been long below the histogram but in the mast week a K and D lines crossover
occurred.
I see these as reasons to add to GBPUSD swing short with little risk as compared
with intermediate-term profit reward expectation.

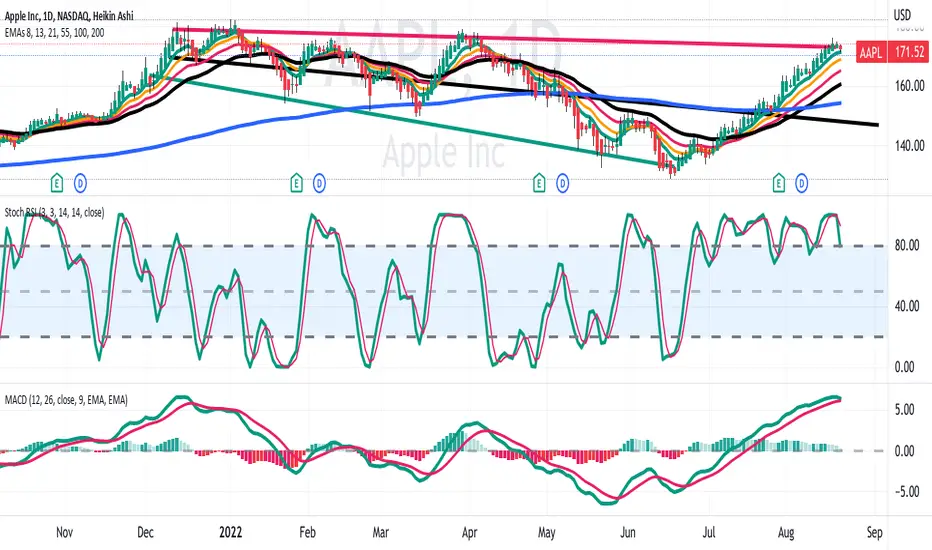
AAPL Megaphone Pattern SWING SHORTNASDAQ:AAPL
Apple has been in a megaphone pattern for the last month.
It is now at a horizontal and trendline resistance similar to
conditions on December 13, 2021.
Relative Strength has been high over 80 for much of the month.
The MACD signal is high over its histogram, and the K and D
lines appear primed for a crossover. Both of these indicators
conditions existed back on December 13, 2021.
I see this analysis as a suitable foundation for an excellent
swing long trade in stock or put options expecting AAPL
to fall from the resistance trendline back towards the
mean line of the megaphone pattern. In doing so,
I set the stop loss at $5.00 above the market price, while
targetting the EMA200 or the center line of the megaphone
the pattern shown on the chart in black.
( As an aside the AAPL inverse bear fund is AAPD available
at a lower price than AAPL In reviewing the AAPD chart
I see a reversal from downtrend to an uptrend in the
past two trading days with some bullish engulfing candles.)