Reliance Industries Stock(India) - {11/07/2025}Educational Analysis says that Reliance Industries (Indian Stock) may give trend Trading opportunities from this range, according to my technical analysis.
Broker - NA
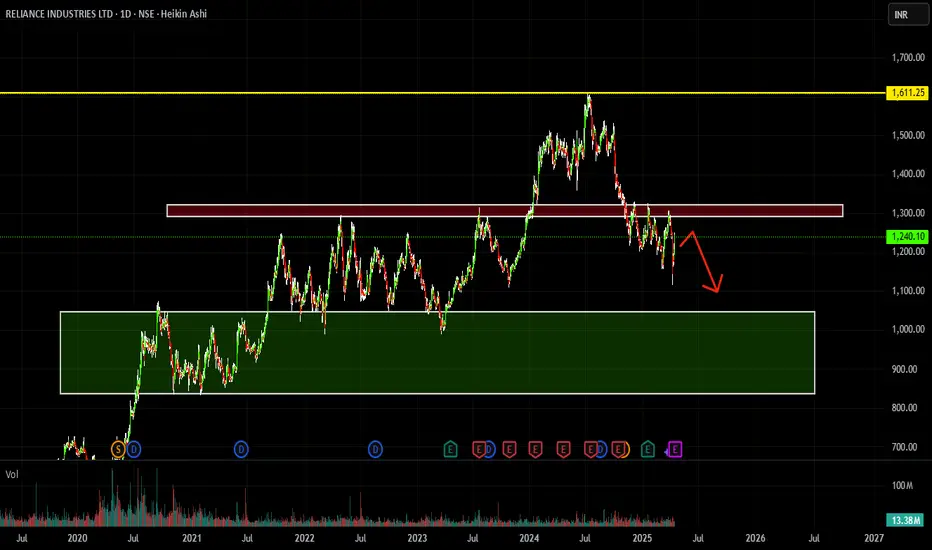
So, my analysis is based on a top-down approach from weekly to trend range to internal trend range.
So my analysis comprises of two structures: 1) Break of structure on weekly range and 2) Trading Range to fill the remaining fair value gap
Let's see what this Stock brings to the table for us in the future.
DISCLAIMER:-
This is not an entry signal. THIS IS FOR EDUCATIONAL PURPOSES ONLY.
I HAVE NO CONCERNS WITH YOUR PROFITS OR LOSS,
Happy Trading,
Stocks & Commodities TradeAnalysis.
My Analysis is:-
Short term trend may be go to the external demand zone.
Long term trend breaks the new high after going from discount zone.
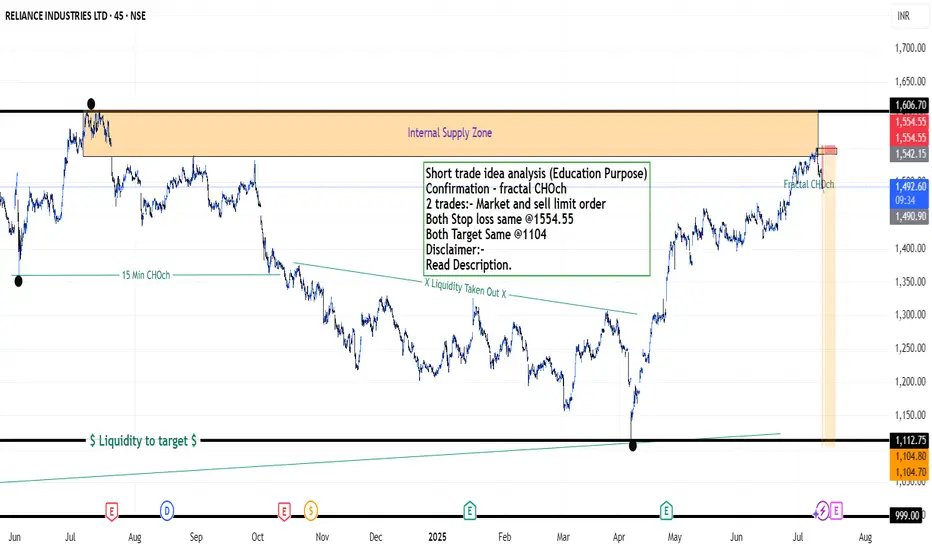
Short trade idea analysis (Education Purpose)
Confirmation - fractal CHOch
2 trades:- Market and sell limit order
Both Stop loss same @1554.55
Both Target Same @1104
Please check the comment section to see how this turned out.
Relianceanalysis
What to do with Reliance share after its drubbing today? Reliance looks weak post result however there is no spike in volume of sale that is a good point. The levels from which Reliance can recover seem to be 1427, 1370 or 1323. If we get a closing below 1323 the stock can fall to 1217 or even 1160 levels this is the reading as of now.
The result was looking good but on deeper scrutiny it was understood that major chunk was profit was due to sale of Reliance stake in Asian Paints business. This I think is not liked by the market specially the retail investors.
The stock has tanked close to 3% as of now but there is no huge selling seen from HNIs or MFs (As of now). (This is an assumption looking at the volume of sale) Volumes are similar to normal day of trade.
May be as retail investors panic MFs, HNIs and others might gulp the stock. Cant say clearly. We might reanalyze by end of the day but caution: Do not sell Reliance in Panic. Result was average it was not bad even if we ignore the Asian paint factor so. Currently I am not selling Reliance I am holding on to it. Might add at lower levels.
Disclaimer: The above information is provided for educational purpose, analysis and paper trading only. Please don't treat this as a buy or sell recommendation for the stock or index. The Techno-Funda analysis is based on data that is more than 3 months old. Supports and Resistances are determined by historic past peaks and Valley in the chart. Many other indicators and patterns like EMA, RSI, MACD, Volumes, Fibonacci, parallel channel etc. use historic data which is 3 months or older cyclical points. There is no guarantee they will work in future as markets are highly volatile and swings in prices are also due to macro and micro factors based on actions taken by the company as well as region and global events. Equity investment is subject to risks. I or my clients or family members might have positions in the stocks that we mention in our educational posts. We will not be responsible for any Profit or loss that may occur due to any financial decision taken based on any data provided in this message. Do consult your investment advisor before taking any financial decisions. Stop losses should be an important part of any investment in equity.

RELIANCE : Completing correction, ready to bounce back🚀 Trading Opportunity: Reliance Industries Ltd. (NSE: RELIANCE) -
⏱️ Timeframe: 1 Day (1D)
💰 Current Price: ₹1,175.60
🎯 Swing Target Zone: ₹1,374 - ₹1,565 🏆
🛡️ Support Level: ₹1,182.10
🛑 Stop Loss: ₹1,159.00 (Day Close Below) 📉
🔍 Wave Analysis:
📈 The chart indicates a completed corrective wave (primary) 5 on the daily chart. This suggests a potential end to the downtrend and the start of an upward move.
🔄 We observe a corrective wave (A), followed by a potential reversal at (B), and a completed intermediate correction wave 5.
💥 The breakout at point (2) signals the start of wave (C), aiming for the swing target zone of ₹1,374-₹1,565. 🎯
💪 Current support near ₹1,182.10.
⚠️ Daily close below ₹1,159.00 invalidates the wave count and the setup. ❌
📊 Strategy:
✅ Entry: Enter near current market prices (around ₹1,175.60). 🛒
🔒 Risk Management: Set stop loss at ₹1,159.00 (daily close) to limit downside. 📉
💸 Exit: Aim for profits within the swing target zone of ₹1,374-₹1,565, aligning with the wave (C) target. 🏆
#Trading 📈 #StockMarket 💰 #RELIANCE 🏭 #TechnicalAnalysis 🧐 #Investing 💼 #ElliottWave
⚠️ Disclaimer: I am not a financial adviser; please consult one. Don't share information that can identify you. ⚠️

RELIANCE INDUSTRIES LTD short dayThe stock of Reliance Industries is currently exhibiting a clear bearish tone. Price action continues to show weakness, with repeated failed attempts to recover, signaling that sellers remain in control.
The ongoing downward movement suggests a lack of confidence from market participants, with no strong catalysts visible to shift momentum. Selling pressure dominates, while any bounce attempts struggle to hold.
Unless there's a visible change in price behavior or a shift in sentiment, the overall outlook remains negative. Caution is advised, and buyers may want to wait for clearer signs of stability before considering entry.
BULLISH PATTERN IN RELIANCEMultiple Bullish Patterns..
Breakout Retest in Daily TF
Pole and Flag in 1 hr TF active above 1280 hourly candle closing
Can Expect Bullish Move
Idea Invalid if todays closing below 1260
Reliance in range from 6th Nov.. Breakout will lead to rally in long term above 1380

BUY RELIANCE ABOVE 1280Reliance formed a strong bullish candle near previous low and looks like a double bottom. Reliance looks a good buy if sustains above 1280 for the Targets of 1320, 1350 and 1400 until 1215 in intact on the downside.
To motivate us, Please like the idea If you agree with the analysis.
Happy Trading!
InvestPro India

Reliance Looking Good...Buy REL at current level and all dips
Target1 - 3000
Target2 - 3200
Target3 - 3627 (if close above 3210)
Disclaimer :-
I am not SEBI registered. The information provided here is for education purposes only.
I will not be responsible for any of your profit/loss with this channel suggestions.
Consult your financial advisor before taking any decisions

Reliance Intraday Levels : 20-Sep-24Reliance closed nr resistance and respect Trendline(both) .
Breakout of resistance & Trendline(White) can expect upside or Breakout of Trendline(Blue) & rejection from resistance can drag price downside.
Bullish> 2945
Bearish < 2935
Use SL trailing method to secure profit.

reliance 2.5 years sideways breakout wait for retracement 2680 -2700 is perfect entry level ,long view ,weekly time frame first target 3200 rs second target 4000 above

RELIANCEReliance has decisively broken the all-time high. I am currently waiting for a retest to enter the long trade.

Reliance Intraday Levels: 25-Jun-24Reliance close at support of horizontal & Trendline with W formation below levels are important for trend determination
Bullish > 2900
Bearish< 2870

RELIANCE (Reliance Industries Limited) - Swing TradeClosing Price: ₹2,972.1
Change %: 1.74%
Volume: 7,304,130
High: ₹2,984.45
Reliance Industries, a market heavyweight, saw a 1.74% increase, closing close to its intraday high. The considerable volume signifies robust investor confidence. Given Reliance's diversified business portfolio and market influence, the stock is likely to maintain its upward momentum, making it an attractive swing trade option.
Kindly conduct thorough analysis and consider market conditions before making any trading decisions.

RELIANCE Reliance is currently at a support level, which may indicate a potential reversal. Here are some trading levels for those interested.


Reliance target 2753.25lower limit- 2181.25
upper limit- 2753.25
cmp- 2455.20
gain- 12.1% from cmp
Rangebound trading strategy in reliance, target will be achieved by 18/08/23

RELIANCE--Rising Wedge??Rising wedge bearish pattern is observed in this stock..
This stock is showing strong bullishness from the demand areas at 2600 levels.
A strong bullishness is observed after broken the trendline previously
and a continuous move is identified.
So look for long in this stock from the demand Areas.

Reliance--Bulllish or Bearish??This stock is completely bullish now,a strong break above the major resistance is observed recently. Strong bullish move is observed from 2500-2600.
Price is likely to test this demand zone again.
On topside price is facing resistance in the form of trendline.keep looking for buy when price tested these levels.
If consolidation happens on topside price is likely to continue moving upside chances or more.

Reliance--Resistance @2400 ??I am sharing the important levels of Support and Resistance. These levels play a crucial role in trading decisions, as they act as reliable markers of price movements.
------>>Support levels are price points where an asset tends to find buying interest, preventing it from falling further.
---->Resistance levels, on the other hand, are points where selling pressure typically prevents the asset from rising higher.
Take a look at these levels and trade accordingly. Recognizing and respecting these support and resistance levels can help traders make informed decisions and manage risk effectively. They serve as key reference points for technical analysis and are vital tools in successful trading strategies.
Trade safe...Thank you guys for your support

RELIANCE--@ Strong Demand??The stock price is now enters in demand zone, where price is strongly moved to the upside...
Find long opportunity in this demand area...
on top side we have a trendline acting as a resistance...
so be careful with this resistance, may have a chance of pushing the price down...
keep safe....
Note:: There is no guarantee that this zone push the price up...sometimes it opens below and continue to down...so careful here.

RELIANCE--Near Its Demand Zone?? look for buy when price test this demand Zone.
I am sharing the important levels of Support and Resistance. These levels play a crucial role in trading decisions, as they act as reliable markers of price movements.
------>>Support levels are price points where an asset tends to find buying interest, preventing it from falling further.
---->Resistance levels, on the other hand, are points where selling pressure typically prevents the asset from rising higher.
Take a look at these levels and trade accordingly. Recognizing and respecting these support and resistance levels can help traders make informed decisions and manage risk effectively. They serve as key reference points for technical analysis and are vital tools in successful trading strategies.
Trade safe...Thank you guys for your support.
The information provided on this platform/website/blog is for informational purposes only and should not be considered as financial or investment advice. It is not intended to be a substitute for professional financial advice or consultation.
The content presented here is based on personal opinions, analysis, and research, and it may not always reflect the most current market conditions or regulations. Investing in stocks, bonds, commodities, or any financial assets carries inherent risks, and individuals should conduct their own due diligence and consult with a qualified financial advisor before making investment decisions.
Past performance is not indicative of future results. The value of investments can go up or down, and there are no guarantees of profit or protection against loss in the stock market.
We do not endorse, recommend, or promote any specific stocks, securities, or investment strategies. Readers and users of this information are solely responsible for their investment decisions and should consider their own financial situation, risk tolerance, and investment goals.
Trading and investing in the stock market can involve substantial risk, and it is possible to lose more than your initial investment.
We make no warranties or representations about the accuracy, completeness, or reliability of the information presented. We disclaim any liability for any loss or damage arising from the use of this information or reliance on it.
Please be aware that regulations and tax laws related to investments may vary by jurisdiction, and it is essential to understand and comply with the specific rules and regulations applicable in your location.
By accessing and using this platform/website/blog, you agree to this disclaimer and acknowledge that you have read and understood the information provided herein. It is your responsibility to review and accept the terms of use and privacy policy of this platform/website/blog.
This disclaimer may be updated or modified without notice, and it is your responsibility to review it periodically for any changes.

RELIANCE--Long??this stock is showing strong bullish pressure..
multiple times facing the resistance 2420-2425 range if price breaks this range...will see a good upside movement.
keep in long side...

Reliance--Demand @2360 ??The stock is trending downwards....
we have a strong demand zone at 2360 level...
when price comes here...look for buy...
we have a continuation bullish gap also be in the middle...take a look at this level as well..
both together may acts as support....

RELIANCE--Head & Shoulders Pattern ??After a strong trending movement from few weeks,
price is near its resistance level,
now it is in the form of Head and Shoulders pattern..which is a reversal pattern..
wait until price breaks the Neckline and retest...then will enter for Short side...
keep track this for Short side, if breaks neckline...until wait and watch.
