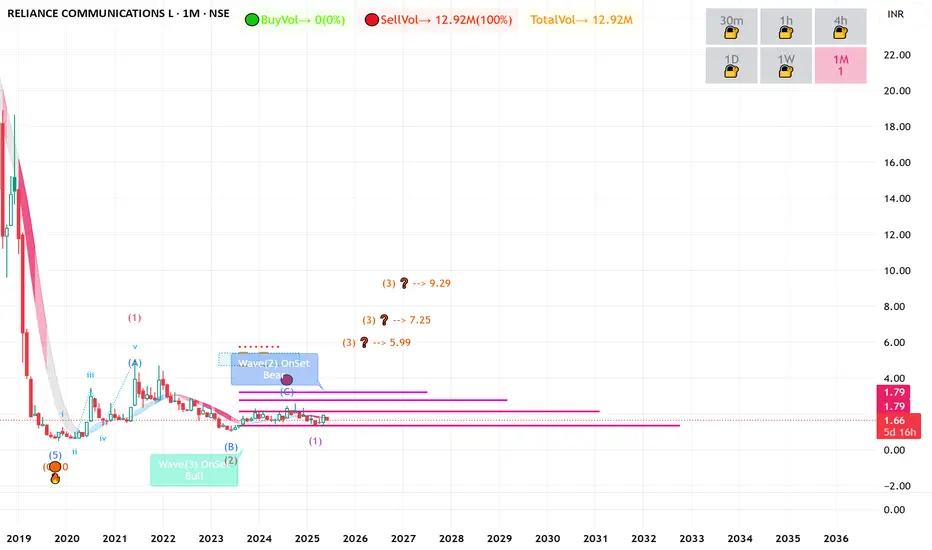
RCOM Big GEM ??? or just another bubbleReliance communication trading 1.55
we saw in monthly counts where we found big up setup in formation going on !!!
if wave theory exists than this could be big potential penny stock ready to blast with solid returns to investors for long term basis towards 7.55 to 9
Elliot waves theory consists multiple forecasts and moves
this is education-based charts share your counts!!!
Reliancebuysetup
RELIANCE : Completing correction, ready to bounce back🚀 Trading Opportunity: Reliance Industries Ltd. (NSE: RELIANCE) -
⏱️ Timeframe: 1 Day (1D)
💰 Current Price: ₹1,175.60
🎯 Swing Target Zone: ₹1,374 - ₹1,565 🏆
🛡️ Support Level: ₹1,182.10
🛑 Stop Loss: ₹1,159.00 (Day Close Below) 📉
🔍 Wave Analysis:
📈 The chart indicates a completed corrective wave (primary) 5 on the daily chart. This suggests a potential end to the downtrend and the start of an upward move.
🔄 We observe a corrective wave (A), followed by a potential reversal at (B), and a completed intermediate correction wave 5.
💥 The breakout at point (2) signals the start of wave (C), aiming for the swing target zone of ₹1,374-₹1,565. 🎯
💪 Current support near ₹1,182.10.
⚠️ Daily close below ₹1,159.00 invalidates the wave count and the setup. ❌
📊 Strategy:
✅ Entry: Enter near current market prices (around ₹1,175.60). 🛒
🔒 Risk Management: Set stop loss at ₹1,159.00 (daily close) to limit downside. 📉
💸 Exit: Aim for profits within the swing target zone of ₹1,374-₹1,565, aligning with the wave (C) target. 🏆
#Trading 📈 #StockMarket 💰 #RELIANCE 🏭 #TechnicalAnalysis 🧐 #Investing 💼 #ElliottWave
⚠️ Disclaimer: I am not a financial adviser; please consult one. Don't share information that can identify you. ⚠️

Reliance Industries: Case of Ending DiagonalTheory:
DIAGONAL:
Diagonal are the motive waves like an impulse wave, but diagonals are different from impulse wave in that they do follow the first two Sutras (rules of impulse wave) for wave analysis, but it does not follow the third one i.e. Wave 4 should not intervene the territory of the wave 1. In a diagonal wave 4 always enters into the price territory of the wave 1.
Properties Of Diagonals:
Diagonals can be contracting or expanding type being expanding diagonal a rare one.
In contracting type, wave 3 is shorter than wave 1, wave 5 is shorter than wave 3, and wave 4 is shorter than wave 2.
In expanding type, wave 3 is longer than wave 1, wave 5 is longer than wave 3, and wave 4 is longer than wave 2.
Types Of Diagonals:
LEADING DIAGONAL
ENDING DIAGONAL
LEADING DIAGONAL: In a leading diagonal , waves 1,3, and 5 are all impulsive in nature or all in corrective form of zigzags. Wave 2 and wave 4 are always present in a zigzag form. A leading diagonal suggests the starting of a new wave & that is why it can develop wave 1 of a impulse wave and a first wave of a zigzag pattern.
ENDING DIAGONAL : This is the most common diagonal that can be found out at the ending of a main trend or main correction. It consists of all the waves 1-2-3-4-5 in a single or multiple zigzags. They can be found placed at 5th wave of an impulse wave or can been seen as a wave ‘C’ of a corrective waves zigzags or flat.
After the termination of the diagonal , a swift & a sharp reversal takes place which bring the prices back to the level from where the diagonal has began. (generally it retrace back to the wave-2 of the diagonal structure)
TRADING PLAN:
Stock is likely to hold above 1156 on any weakness and recover towards 1290-1300 in the coming days and weeks ahead.

INV H&S IN RELIANCE IN FORMATIONInv H& S expected
Gap Filling till 1275
Todays Closing Imp... idea invalid if closing below 1260 on DCB
Dip Buying till gap filling 1275

RELIANCE : BET ON FNO AND SWINGTechnical Analysis of Reliance Industries on 1-Hour Chart
Overview of the Chart
The chart represents Reliance Industries on the 1-hour timeframe , highlighting key concepts such as CHoCH (Change of Character), demand zones, and the golden retracement zone.
Tools Used:
Price Action : Key highs/lows, retracement zones.
Demand Zones : Mitigated demand areas.
Golden Retracement Zone : Optimal entry for Wave B based on Fibonacci levels.
Swing Target : Projected target for Wave C.
Key Levels and Concepts Explained
Extended Retracement Zone (Deep Retracement): ₹1,261.20 – ₹1,252.70
This zone marks a potential support area for buyers after a correction in Wave A to B.
Buying Tip: Look for reversal signs in this zone.
Stop Loss: Below ₹1,252.70 to manage risk effectively.
Golden Retracement Zone (Wave B): ₹1,241.30 – ₹1,261.20
Located at the 61.8% Fibonacci retracement level, a high-probability area for a reversal upward.
Buying Strategy:
Enter within this zone if price shows bullish signs like engulfing patterns or pin bars.
Stop Loss: Just below ₹1,241.30.
Target: Swing high at ₹1,341 – ₹1,354 (Wave C).
CHoCH Zones:
Failed CHoCH: Price rejected near ₹1,273.75 and corrected lower.
Demand Zone: Strong demand needs to emerge at ₹1,261.20 for a reversal upward.
Tip: Look for bullish confirmation near demand zones or the golden retracement.
Swing Target Zone: ₹1,341 – ₹1,354
Represents the projected target for Wave C if the retracement zone holds.
Partial Profit Tip: Book profits near ₹1,341 – ₹1,354 and trail stops for further upside.
Stop Loss Strategy
Stop Loss on Failure: Below ₹1,241.30.
If price closes below this level, the bullish setup is invalid, and traders should exit to limit losses.
Buying Tips at Key Levels
Primary Buy Zone: ₹1,241.30 – ₹1,261.20 (Golden Retracement)
Look for bullish confirmation like pin bars, engulfing candles.
Stop Loss: Below ₹1,241.30.
Target: ₹1,341 – ₹1,354.
Aggressive Buy Option: ₹1,261.20
Scale into positions near mitigated demand with tight stop losses.
Key Observations
Wave Structure: Price is in Wave B (corrective phase), aiming for an upward Wave C.
Demand Zone: Buyer defense at the golden retracement confirms bullish outlook.
Risk Management: Always use stop losses to avoid significant drawdowns.
Summary of Key Levels
Key Levels Actions
₹1,241.30 – ₹1,261.20 Buy Zone (Golden Retracement)
Below ₹1,241.30 Stop Loss
₹1,341 – ₹1,354 Swing Target Zone
By following this plan, traders can align with price structure, optimize risk-to-reward, and trade effectively.

BUY RELIANCE ABOVE 1280Reliance formed a strong bullish candle near previous low and looks like a double bottom. Reliance looks a good buy if sustains above 1280 for the Targets of 1320, 1350 and 1400 until 1215 in intact on the downside.
To motivate us, Please like the idea If you agree with the analysis.
Happy Trading!
InvestPro India

The Next Chapter for Reliance...?Reliance has demonstrated a significant shift in its price action by breaking out of the prevailing downtrend. This is an important indicator as it suggests potential momentum for upward movement. Following this breakout, the stock has successfully retested the downtrend line, confirming its strength and validity.
Currently, it is trading within a critical support range between 1280 to 1290 rupees. This level has historically provided a foundation for price stability, indicating that there is buying interest around this area.
There are three compelling reasons to consider entering a long position at this juncture:
1. **Break of the Trendline**: The breach of the downtrend signifies a potential change in market sentiment, which can often lead to further gains.
2. **Successful Retest**: The fact that Reliance has tested the broken trendline and held suggests that the previous resistance is now acting as support, which increases the likelihood of upward movement.
3. **Maintaining Support Levels**: The stock's ability to stay above the significant support range of 1280 to 1290 rupees indicates strong buying pressure. It reflects investor confidence and may serve as a psychological barrier against further declines.
Given these factors, now may be an opportune moment to consider a long position in Reliance.

Reliance Looking Good...Buy REL at current level and all dips
Target1 - 3000
Target2 - 3200
Target3 - 3627 (if close above 3210)
Disclaimer :-
I am not SEBI registered. The information provided here is for education purposes only.
I will not be responsible for any of your profit/loss with this channel suggestions.
Consult your financial advisor before taking any decisions

RELIANCERELIANCE has returned to the support level of 3000. We should prepare for a long position if the price remains above 3000.

reliance 2.5 years sideways breakout wait for retracement 2680 -2700 is perfect entry level ,long view ,weekly time frame first target 3200 rs second target 4000 above

RELIANCEReliance has decisively broken the all-time high. I am currently waiting for a retest to enter the long trade.

RELIANCE Reliance is currently at a support level, which may indicate a potential reversal. Here are some trading levels for those interested.

RELIANCE--Rising Wedge??Rising wedge bearish pattern is observed in this stock..
This stock is showing strong bullishness from the demand areas at 2600 levels.
A strong bullishness is observed after broken the trendline previously
and a continuous move is identified.
So look for long in this stock from the demand Areas.

Reliance--S/R levelsI am sharing the important levels of Support and Resistance. These levels plays a crucial role in trading decisions, as they act as reliable markers of price movements.
------>>Support levels are price points where an asset tends to find buying interest, preventing it from falling further.
---->Resistance levels, on the other hand, are points where selling pressure typically prevents the asset from rising higher.
Take a look at these levels and trade accordingly. Recognizing and respecting these support and resistance levels can help traders make informed decisions and manage risk effectively. They serve as key reference points for technical analysis and are vital tools in successful trading strategies.
Trade safe...Thank you guys for your support

Reliance--Bulllish or Bearish??This stock is completely bullish now,a strong break above the major resistance is observed recently. Strong bullish move is observed from 2500-2600.
Price is likely to test this demand zone again.
On topside price is facing resistance in the form of trendline.keep looking for buy when price tested these levels.
If consolidation happens on topside price is likely to continue moving upside chances or more.

RELIANCE--@ Strong Demand??The stock price is now enters in demand zone, where price is strongly moved to the upside...
Find long opportunity in this demand area...
on top side we have a trendline acting as a resistance...
so be careful with this resistance, may have a chance of pushing the price down...
keep safe....
Note:: There is no guarantee that this zone push the price up...sometimes it opens below and continue to down...so careful here.

RELIANCE--Near Its Demand Zone?? look for buy when price test this demand Zone.
I am sharing the important levels of Support and Resistance. These levels play a crucial role in trading decisions, as they act as reliable markers of price movements.
------>>Support levels are price points where an asset tends to find buying interest, preventing it from falling further.
---->Resistance levels, on the other hand, are points where selling pressure typically prevents the asset from rising higher.
Take a look at these levels and trade accordingly. Recognizing and respecting these support and resistance levels can help traders make informed decisions and manage risk effectively. They serve as key reference points for technical analysis and are vital tools in successful trading strategies.
Trade safe...Thank you guys for your support.
The information provided on this platform/website/blog is for informational purposes only and should not be considered as financial or investment advice. It is not intended to be a substitute for professional financial advice or consultation.
The content presented here is based on personal opinions, analysis, and research, and it may not always reflect the most current market conditions or regulations. Investing in stocks, bonds, commodities, or any financial assets carries inherent risks, and individuals should conduct their own due diligence and consult with a qualified financial advisor before making investment decisions.
Past performance is not indicative of future results. The value of investments can go up or down, and there are no guarantees of profit or protection against loss in the stock market.
We do not endorse, recommend, or promote any specific stocks, securities, or investment strategies. Readers and users of this information are solely responsible for their investment decisions and should consider their own financial situation, risk tolerance, and investment goals.
Trading and investing in the stock market can involve substantial risk, and it is possible to lose more than your initial investment.
We make no warranties or representations about the accuracy, completeness, or reliability of the information presented. We disclaim any liability for any loss or damage arising from the use of this information or reliance on it.
Please be aware that regulations and tax laws related to investments may vary by jurisdiction, and it is essential to understand and comply with the specific rules and regulations applicable in your location.
By accessing and using this platform/website/blog, you agree to this disclaimer and acknowledge that you have read and understood the information provided herein. It is your responsibility to review and accept the terms of use and privacy policy of this platform/website/blog.
This disclaimer may be updated or modified without notice, and it is your responsibility to review it periodically for any changes.

Reliance--Demand @2360 ??The stock is trending downwards....
we have a strong demand zone at 2360 level...
when price comes here...look for buy...
we have a continuation bullish gap also be in the middle...take a look at this level as well..
both together may acts as support....

RELIANCE AnalysisObservations::
previous resistance is acts a support and the price is moved up...
a strong fall is noticed from the zone 2580-2570,
price broken this zone with strong momentum, and tested again..keep on buy side until this breaks.
if price is not able to move upside again from this zone will go for side...
A demand zone is observed at 2540 level...
if suddenly price falls.. this gives support.. look for buy on this zone...

RELIANCE TOWARDS 2600 levelsThere is a formation of Bat Pattern on the hourly chart of Reliance Industries Ltd.
Support zone: 2478-2490
Sustaining the support zone, the stock is likely to move towards 2540 to 2600 in the coming trading sessions.
Higher Timeframes also look promising.

Reliance - launcpad readyStage 2A
- Week of 12.6.23
- above all mas
- increasing volume
- double bottom
It has bounced from a confluence of moving averages and ready to rip now!

RELIANCE--2500 or 2400 ??Observations::
----the stock is in the resistance zone...where previously strong sell of is observed in this zone..
today a strong bearish candle is observed from this zone..
If price fall below 2500 zone, and not able to break 2600, then look for sell in these zones.
(2520-2500 range)
If price is not able to break above after taking support from 2520-2500 levels, short side up to 2400.

RELIANCE--Double Top Formation??------->>----->> Can we consider this as double top ??
------>> Failed to create a new high and falls heavily to the below levels.
if demand acts as supply @ 2470-2460 levels, we will observe a fall again towards 2420 and 2370 levels.
@ 2370 Levels we have identified a strong rise in this stock price, will again push the price towards higher levels.
keep track these two levels.
