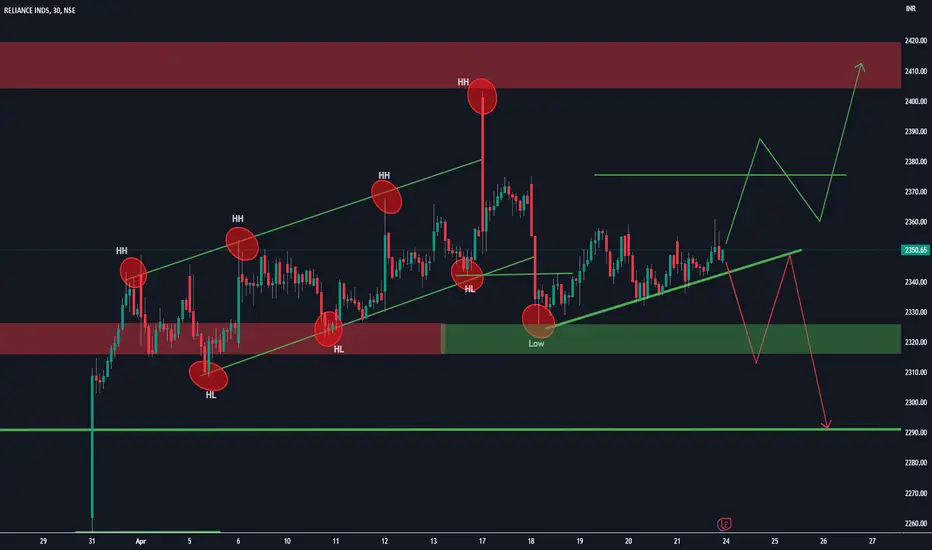
RELIANCE-Will create a lowerlow or continue upside.The RELIANCE has been trending upwards, but recently it broke through the higher low level at 2342 and dropped to a low of 2326.
However, the previous supply zone at 2326 has acted as a demand level, causing the price to rise weakly towards the upside.
At this point, it is uncertain whether the stock will continue to move higher or form a lower low.
Further analysis is required to determine the likely direction of the price movement.
Note:
As of now it is in bullish, slightly turned to be bearish as a low is formed and weak momentum is observed towards high ,it may create lower low or can rise towards a strong level of resistance at 2400.
Relianceindustries
NIFTY MAY GIVE A BREAKOUT.NSE:NIFTY is on a urge to gave a breakout above 17640, hence there are some of the criteria which may apply to this pattern, there is a NSE:RELIANCE results coming out this weekend which may affect the movement, positive results may lead to bullish moment, however negative result would make it move sideways to slightly bearish. Thus be cautious, this trade may break if sentiments aren't strong
thanks

What is #Reliance up to?Reliance Industries Ltd. remains favourite among many NSE traders, and among people who trade #Nifty50 in India.
This one is in wave 4 and subsequently wave 5, down and therefore I am looking at shorting opportunities from these levels.
Happy Trading.

Reliance Industries Ltd Seems have more painReliance Industries Ltd Seems have more pain.
Reliance industries chart I had uploaded earlier too. It was looking in wave 4 of correction.
The retracement for wave 4 is considered to be around 38-50%.
I have taken 38.2 % which comes around 1856, level is marked with green line.
This is not a buy/sell recommendation. only for educational purpose.
Please read the chart's labels carefully.
Regards

Reliance Showing Early Signs of Top Formation⚡️Early Signs of Top Formation
⚡️ Stage-4 may be confirmed below the 2000-2030 zone only
⚡️If it enters in Stage-4, it may go toward 1500-1600 zone
⚡️Except Covid Crash, first-time price sustained below 200 DMA &Weekly RSI below 40
⚡️ Looks like Reliance Chart follows 78-80 Week time cycle
⚡️The current time cycle is about to complete in next 2-4 weeks

RELIANCE GOOD ENTRY POINT FOR MID TERMI won't call this a typical divergence, but a stock making tripple bottom at one level and reversing possibility is very very high.

Reliance Ready for -35% Down Move from here..?Reliance/INR Chart Analysis :-
Based on the chart analysis, Reliance is currently trading at ₹2322 and has broken the support level. This could lead to a big down move in the coming months, but there may be good buying opportunities for the long term around ₹1500-₹1600.
The 0.50 Fib Retracement level is at ₹1584, which could lead to a strong bounce from that level. However, this analysis will only hold true if Reliance breaks the ₹2607 level.
My key levels for Reliance:-
support at ₹2218/₹1897/₹1584 and
Resistance at ₹2680
Don't forget to like and appreciate my hard work, and follow me for the latest real-time updates on cryptocurrencies. Thank you!

Breaking- out from a trendline The scrip is breaking out from a trendline after forming a double bottom, keep this scrip in radar

Reliance Industeries Call option buy opprotunity 2600 Ce 29 marHi every one
2600 CE 29 march Rel you can buy
now date 6 march 2023 today

reliance industries Postive trendreliance industries
hi everyone plan trade
if want ot plan plan buy trade
till 6 march to 7 march 2023 valid this idea

Relaince industries relaince industries will test the 2385 to 2390 price again, at this price, we can take risk and can go long from this price.

Reliance may go down !! but keep trailing your SLThe scrip is looking negative and it can break its previous support. keep in radar. but keep trailing your SL.

RELIANCE INDReliance ind 1 month chart in which stock is trading at near strong support zone. It's a monthly swing high support I will go long with small stop loss 2280. can gain short term gain. No short view untill it starts trade below 2280.

Reliance Chart Analysis 12/2/23While the price is above the support 2306 price is expected to fall as the current support will get broken
❤️ If you find this helpful and want more FREE forecasts in Trading View
Be sure to leave a comment; let us know how you see this opportunity and forecast.
❤️ Your support is very much 🙏 appreciated!❤️

RELIANCE - Elliott Wave ViewRELIANCE.
Correction cycle towards 1900 level. Below 1850, could extend towards 1650 level. The stock is forming a WXY corrective pattern.
The analysis is based on the Elliott Wave Theory.

Reliance IndsReliance inds trading in pattern. Just sharing my thoughts. DONT TRADE BASED ON THESE IDEA.

Reliance - Make or BreakWhile Reliance can go higher in the short run, in the longer run, the structure is extremely week. Watch the 20MMA. The last time Reliance closed below is with MACD in sell... Well the chart shows what happened

RELIANCE LONG TERM VIEWReliance on a weekly chart is moving in a fixed channel for a long time.
2350 is a crucial level for reliance if it breaks we can see a good downfall in this stock. And if it bounces back from this level, the previous high of 2800 level can be expected.
Trade safe. Manage risk. Be profitable.
Please follow us for more simple trading analysis and setups. Also, let me know in the comment if you have any queries.
Disclaimer:- This is my view. Please analyze the charts yourself and then decide to take any trades.


Reliance Industries 🚀RIL ( Reliance Industries ) is performing Good at his levels to the estimate Target for Swing Trading is 2680 🎯
Note : This is just for Backtesting and Educational Purpose Only.

RELIANCE : near resistance RELIANCE : Down trend in hourly chart since many days. now its near to resistance for trendline & also near flip Resistance. Please watch closely (in 15 min chart ) all the candle formation and enter in trade. IF Breakout & retest of Flip level we can see 2600 on table and Nifty with our next target as per Nifty chart.
Like, Share, Comment for regular updates.
Disclaimer
I am not sebi registered analyst
My studies are Educational purpose only
Please consult with your Financial advisor before trading or investing

Reliance Harami type candle on resistance#Reliance in triangle consolidation after Trendline breakdown.
And formed harami looking candle pattern on Resistance today.
Can initiate Short position if it breaks today's & yesterday low around 2550 with SL of 2580
Trgt 2510-2490.
If breaks today's n yesterday high around 2580 then can initiate Long position
With SL below 2550. For trgt 2625, 2675 & 2725 final positional.

Reliance - rectangle breakoutReliance showing bullish RSI range shift on 1HR time frame
Rectangle breakout with target of 58 points
Rectangle target : 2608
Resistance at 20DMA : 2595
Round figure resistance : 2600
