$REN looking great on the 1hr. REN is looking great on the 1hr chart. Peeking it’s head out the A-tri, would like to see a 1-4hr close above the trend line & preferably a backtest for confirmation
REN-BTC

Massive REN green recovery dildo.My dip blackhorse is called REN
Longed based on a trend line strong test and respect.

$REN LONG - INSHALLAHRen pair looks good. renbtc looks good. ren usdt looks good. if target doesn't reach then THE market is simply WRONG.

REN - usd pair REN / BTC is in a rounding bottom formation and currently breaking resistance. USD pair is in a ascending triangle . Both pairs looking great makes me confident this is a strong and great long opportunity.


REN NEXT PUMP
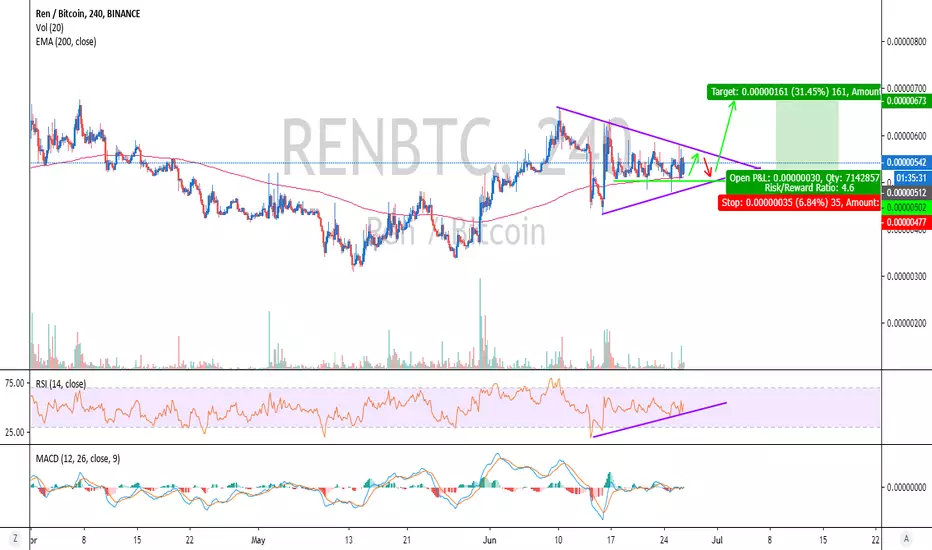
These are the appropriate level exits for the next run of one of the biggest actor in the DeFI space.
Theyre focused on bringing interoperability between Bitcoin to Ethereum network.


REN is bullish as long as it holds the flagEnter on break of the flag and small consolidation outside. Trade with stops.

REN/BTC|4H|02.12 Battle incomingWho's gonna win?
Head And Shoulders or Uptrend's triangle + bullish divergence?
Let's vote boyzz...


RENBTC Buy SignalThis pair is printing a bullish channel on 1D since mid September similar to the one it started in mid May. Once the pull back on the 5th leg is completed below the MA50 I am expecting a very aggressive rise towards 0.00001110. The RSI action of the two patterns is also similar.


RENBTC BreakoutQuiet possibly that RENBTC will breakout soon. I am watching it on a 1 minute chart and waiting to break the resistance line, then I will buy it.

Potential Buy Zone REN BTCAfter broke the trendline, price is approaching to 0.382 fibonacci level. If can stay above of this level i'll label it as wave 2 just before huge wave 3.
If can not stay on this level, next support can be considered as 0.236 fib level.

REN - Support soon?This green box was before a strong resistance zone. Then it became a support zone, it has been tested twice. If it touches this support and holds then I will long REN.

RENnow=0.00001228
target=0.00001473
profit=19%
if hold 0.000014 btc then target 2=0.00002235 btc
profit=84%

RENBTC - Symmetrical triangleThe coin formed a symmetrical triangle, where within the triangle formed a good support. There is a probability of making a small correction to this medium and going up approximately 30%. The stopLoss would be just below the bracket and breaking the triangle.
RENBTC LONG BINANCE via VPVR ICHIMOKU FIB OBV and ADXDespite the powerfully momentous sell off since the REN ICO, we have seen a very aggressive reaccumulation from the markets constituents under 0.00200000. The short term trend is looking rather Bullish. On Balance Volume is drastically under the trend angle, indicative of an obvious accumulation opportunity for institutional traders. The Possitive DMI is above the 20 line and is about to bounce off the ADX, which is also above the 20. We can see that the Tenkan-sen and Kijun-sen are about to cross in Bullish behavior. We can also see that the Kumo Cloud is about to Twist. Likely the strongest indicator to be taken here in terms of market repectecting an indication. Price is consolidating above the Point of Control and my speculative Take Profit targets are based off of High Volume and Low Volume Node mountains and valleys as we should all know how price likes to move from LVN to HVN and vice versa. TPs are also in confluence with a Fibonacci extension taken from the latest reaccumulation swing directly after the Climactic Sell off. If I were to take this trade, I would use the pertinent values of the Ichimoku Kinko Hyo relative to that point in the future. Please let me know if you have any input here.
For a bit of fundamental analysis, the parent company of REN is MSFT. The current strong bullish trend for Microsoft has been mirrored by RENTBTC and RENTBNB on BINANCE. And general adoption of aunanoymous coins is ground exponentially accross all exchanges.
Thank you for taking the time to read this.

