RENDER/USDT:UPDATEHello friends
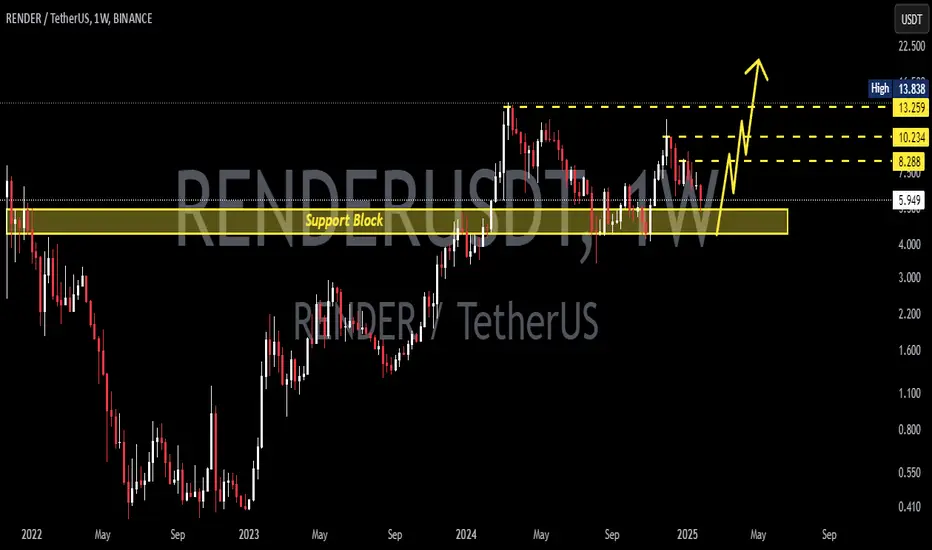
Given the good return that the price has had, especially from an important support, it can be understood that the buyers have become strong and we can play behind their hands.
We have specified the buying steps for you and the goals have also been specified.
I hope you like it and support us.
*Trade safely with us*
Render

Render Token Activates Long-Term SupportRender Token (RENDERUSDT) entered the bullish zone in late 2023 when it broke above $3.333. This is mapped on the chart as "long-term support."
Good evening my friend...
Incidentally, this same long-term support level matches MA200 on the weekly timeframe.
This support zone launched the early 2024 bullish cycle and also worked as support in August 2024. In both instances, as soon as this level was activated the market experienced sustained growth.
The same is happening again now, there can be some variations.
Instead of straight up as it happened in the past, there can be some sideways, consolidation/accumulation, before the next rise.
As long as RENDERUSDT trades above this level we can expect growth. This level can be pierced on a wick and the bullish bias and potential remains. If prices move below, a buy opportunity. Cryptocurrency is bullish regardless of the short-term.
The time to buy is now.
Thanks a lot for your continued support.
Remember to do your own research and develop a plan before buying any Altcoin. A preconceived plan can help you eliminate stress and increase positive trading results. A plan can be as simple as knowing if you are ready to hold no matter what happens. If you are ready to hold long-term, your plan can consist in buying each time your favorite pair hits support. Buy and hold. Once the action turns bullish and the market turns green, you will be happy with the results.
One day the market is down and red; the next day everything changes.
Surprise!!! And we are going up.
Namaste.

RENDER (RNDR/USDT) - Potential Bottom & Breakout Incoming? RNDR is showing signs of a potential bottom formation on the daily chart.

Render about to turn?RenderUSD
Support levels at $4.00 And 3.91
Tight resistance levels at 4.11 and 4.30... if we can break 4.30 this should grind up to the 5.22 levels
I can see render making a rounded bottom here... and start its grind upward...if we break below the 3.92 there is a long way down so as always use cuation and remember that capital preservation is always #1 when trying to make money

RENDERUSDT Below Key Support—But Is a Massive Reversal Incoming?Yello, Paradisers! #RENDERUSDT just broke a critical support level, triggering a major downside move. But here’s where things get interesting—before this drop, RENDER left behind wickless candles at $8.70 to $8.80, signaling unfinished business at higher levels. Could a sharp reversal be on the cards? Let’s break it down.
💎Right now, #RENDER has tested the breakout support region between $3.40 - $3.15—the same level that originally fueled its last major rally. This is a key demand zone where bulls are likely to step in aggressively, triggering short-covering and possibly even a higher time-frame reversal.
💎Sellers need to be extremely cautious here. This zone has the potential to create a slingshot effect, where a sudden surge in buying pressure could trap shorts and send RENDER flying back up before they can react.
💎If bulls successfully defend this level, the first upside target sits at $5.65. A breakout above this could open the door toward $6.25 - $6.55, a pivotal resistance zone that will determine whether RENDER can regain full bullish momentum. Strength above this level would likely send the price surging toward the wickless candle at $8.80, where unfinished liquidity could be swept.
Patience and discipline are key here, Paradisers. The market often tests both bulls and bears before making decisive moves, so stay vigilant.
MyCryptoParadise
iFeel the success🌴

RENDER 1H Sell/ShortHi, dear traders. how are you ? Today we have a viewpoint to Sell/Short the RENDER symbol.
For risk management, please don't forget stop loss and capital management
When we reach the first target, save some profit and then change the stop to entry
Comment if you have any questions
Thank You

RENDERUSDT 1WRENDER ~ 1W Analysis
#RENDER Re-test this support, Buy from here if you still have a Conviction on this coin with a minimum target of 20%+
RENDER = approaching Entry level!Hi fellow traders, RENDERUSDT is getting ready to make a move higher after it completes the correction. Target the 13.8877 level. Good luck and trade safe!

RENDER UPDATE (1D)RENDER seems to be in a long-term diametric formation.
Wave D also appears to be a diametric.
It is in wave D of D. It could retrace upwards from the green zone.
A daily candle close below the invalidation level will invalidate this analysis.
For risk management, please don't forget stop loss and capital management
Comment if you have any questions
Thank You

RENDER VS BTC (1D)This chart represents RENDER to BTC, essentially showing RENDER's dominance over Bitcoin.
It seems we are nearing the end of wave G and have approached a very key support zone today.
In the coming days, as the price penetrates deeper into the support zone, if RENDER recovers and appears more bullish compared to the market, it shouldn't come as a surprise.
For trading the RENDER/USDT pair, make sure to wait for a trigger and confirmation.
For risk management, please don't forget stop loss and capital management
Comment if you have any questions
Thank You

Render ; +100$ in playEvening folks , people who know me also know that I’m super bullish on AI , Done some projects before and I’m bullish on Render as well , wanna keep the chart simple and wont say much tho asking you to have your research about render with chatgpt or grok , amazing roadmap and partnerships and amazing community.
Dyor

#RENDER/USDT Ready to go higher#RENDER
The price is moving in a descending channel on the 1-hour frame and sticking to it well
We have a bounce from the lower limit of the descending channel, this support is at 6.87
We have a downtrend on the RSI indicator that is about to be broken, which supports the rise
We have a trend to stabilize above the moving average 100
Entry price 7.15
First target 7.67
Second target 8.00
Third target 8.34

Nosana - it is about to move up. Nosana has been struggling to go above $4.45 area since Oct 2024. There is a large sell block sitting above it. However. MACD and RSI in the daily chart are entering the bull zone and the weekly stochastic has crossed and is rolling back up entering the bull zone. The price still needs to go above the previous week high and the previous month high, but I think the price will soon break to the upside if weekly stochastic remains to move upwards.
One note: Stochastic in the daily chart is in the overbought territory, so the price is likely to get pushed down once more when it reaches where the sell block is sitting above.

RENDERUSDT: Strategic Support Zones at the Blue BoxesIn this analysis, the blue boxes stand out as potential support areas worth close attention. These zones are significant for two key reasons:
They align with demand areas, where buying pressure is likely to increase.
They act as first lines of defense, offering a possible halt to further downside movement.
Trading Plan
Focus on Lower Time Frame Reactions: Observing price behavior within the green line and the blue box zones is essential. Key indicators include bullish candlestick patterns, volume surges, or other signs of reversal.
Long Trade Opportunities: If positive reactions occur in these areas, long trades can be structured with well-defined entry, stop-loss, and target levels.
Summary
The blue boxes in RENDERUSDT represent high-probability support zones, combining technical demand with structural significance. By analyzing the lower time frame reactions, traders can position themselves for potential upside opportunities while managing risks effectively.
I keep my charts clean and simple because I believe clarity leads to better decisions.
My approach is built on years of experience and a solid track record. I don’t claim to know it all, but I’m confident in my ability to spot high-probability setups.
My Previous Analysis
🐶 DOGEUSDT.P: Next Move
🎨 RENDERUSDT.P: Opportunity of the Month
💎 ETHUSDT.P: Where to Retrace
🟢 BNBUSDT.P: Potential Surge
📊 BTC Dominance: Reaction Zone
🌊 WAVESUSDT.P: Demand Zone Potential
🟣 UNIUSDT.P: Long-Term Trade
🔵 XRPUSDT.P: Entry Zones
🔗 LINKUSDT.P: Follow The River
📈 BTCUSDT.P: Two Key Demand Zones
🟩 POLUSDT: Bullish Momentum
🌟 PENDLEUSDT.P: Where Opportunity Meets Precision
🔥 BTCUSDT.P: Liquidation of Highly Leveraged Longs
🌊 SOLUSDT.P: SOL's Dip - Your Opportunity
🐸 1000PEPEUSDT.P: Prime Bounce Zone Unlocked
🚀 ETHUSDT.P: Set to Explode - Don't Miss This Game Changer
🤖 IQUSDT: Smart Plan
⚡️ PONDUSDT: A Trade Not Taken Is Better Than a Losing One
💼 STMXUSDT: 2 Buying Areas
🐢 TURBOUSDT: Buy Zones and Buyer Presence
🌍 ICPUSDT.P: Massive Upside Potential | Check the Trade Update For Seeing Results
🟠 IDEXUSDT: Spot Buy Area | %26 Profit if You Trade with MSB
📌 USUALUSDT: Buyers Are Active + %70 Profit in Total

RENDER analysis...hello friends
This currency, which is from the Solana ecosystem, experienced a correction of about 70% after the pump and was able to continue its growth again with the formation of a bottom.
Now, due to the good growth it has had, it is expected that it will be able to break the ceiling and reach the specified goals.
We have specified the purchase points for you.
Capital management must be followed.
Be successful and profitable.

RENDERUSDT 1WRENDER Update ~ 1W
#RENDER As long as still maintain this support block,. Bullish still maintains its structure. If using the Elliott Wave pattern,. this is the 2nd wavy. Buy in stages with a minimum target of 20%+

RENDER is super bullishFrom where we placed the green arrow on the chart, RENDER has entered a bullish phase
This phase is a diamond diametric, we are now at the end of wave D of this diametric.
By maintaining the green range, it can create a new ATH for wave E.
Closing a daily candle below the invalidation level will violate this analysis
For risk management, please don't forget stop loss and capital management
Comment if you have any questions
Thank You

RENDER/USDT Breakout Alert: 200%+ Pump on the Horizon?🚀 Hey Traders! 👋
If this setup resonates, smash that 👍 and hit Follow for trade ideas that deliver results! 💹🔥
RENDER is looking primed for action! It’s broken out of a symmetrical triangle and successfully retested during the recent dip. This could be your chance to accumulate and add more on pullbacks. I’m eyeing a potential 200-250% pump this altseason! 🚀
📈 Trade Setup:
Entry Range: $6.7 - $7.7
Targets: $10 / $14 / $19 / $25
Stop-Loss (SL): $5.60
💬 What’s Your Take?
Are you seeing the same explosive breakout potential? Share your analysis, thoughts, or predictions below. Let’s ride this wave together and lock in massive gains! 💰🌊
🔔 Stay Tuned for More Winning Setups!

RENDER SWING LONG OPPORTUNITY - CRYPTO MARKETPrice is reaching to Price is approaching the monthly demand zone, aligning with a massive bearish trendline originating from Spring 2024. Additionally, there’s confluence with a key Fibonacci level. I anticipate a bounce from this area, potentially leading to new highs or even all-time highs.
As always, wait for lower time frame confirmations before initiating the idea.

Render Network RENDER Long: EWT Analysis & Cycle Peak Targets+ Possible overextended Wave 5 count now?
Trading within Wave (3) of Wave V impulse.
Any major peaks in RENDER have extended as high as the following fib extensions...
The target is the peaks of the parallel channel, confluence with the fib extensions targets:
- 1.414
- 1.618
Last Rally for Cycle Wave V (five) topping around Nov/Dec 2025 being a blow off top.

RNDR | BULLISH ALTS | RNDR Incoming ATH Render has been one of my top alts since Jan 2024, and it hasn't disappointed, currently standing at 140% increase, and if you account for the ATH in March, 245%.
As Bitcoin trades range we're patiently waiting for Ethereum to make a new ATH. This will encourage the rest of alts to make a final push up, that is AFTER ETH made a new ATH. That's why it's so important to watch Ethereum, and the Bitcoin dominance chart.
More on that topic HERE:
____________________
GEMINI:RNDRUSD

#RENDE(SPOT) entry range( 4.45- 5.45) T.(10.299) SL(4.439)BINANCE:RENDERUSDT
entry range ( 4.45- 5.45)
Target (10.299)
SL .1D close below (4.439)
*** collect the coin slowly in the entry range ***
*** No FOMO - No Rush , it is a long journey ***
**** #Manta ,#OMNI, #DYM, #AI, #IO, #XAI , #ACE #NFP #RAD #WLD #ORDI #BLUR #SUI #Voxel #AEVO #VITE #APE #RDNT #FLUX #NMR #VANRY #TRB #HBAR #DGB #XEC #ERN #ALT #IO #ACA #HIVE #ASTR #ARDR #PIXEL #LTO #AERGO #SCRT #ATA #HOOK #FLOW #KSM #HFT #MINA #DATA #SC #JOE #RDNT #IQ #CFX #BICO #CTSI #KMD #FXS #DEGO #FORTH # AST #PORTAL #CYBER #RIF #ENJ #ZIL #APT #GALA #STEEM #ONE #LINK #NTRN #COTI #RENDER ****

Render: Keep It Up! RENDER dissolved last week’s sideways movement to the upside, with a peak gain of 36%. While part of this advance has been retraced, we primarily expect the upward momentum to continue during the blue wave (iii). After the next high is established, a brief interim correction should occur before the bulls complete the five-wave structure with another upward push.
