Render Token Buy Zone: New ATH $17.7, $27 & $46, 2025-26Render Token (RENDERUSDT) is moving within a strong buy zone. Any price below the 5-August 2024 low is a great entry when you aim for the 2025/26 bull market wave. That is, any entry below $3.41 is a very strong, low risk and high potential for reward buy. This is a solid pair.
Remember in 2024 when I told you it was going down, down, down, down? It has been going down for more than a year and three months. There is good news though, Render Token will go down no more.
The chart shows lower highs and lower lows. The last four months have the same base, no new lows. The lows in late 2024 are also not that far away.
Late 2025 & early 2026 targets (New all-time high)
The lower highs are part of a classic correction pattern, with the current chart structure opening up an easy 160% target. This is very easy.
The main target can reach $17.7 (PP: 453%) with higher prices being almost certain. The last target can be around $27 or $46, for these, we will have to wait and see.
When to sell
If the initial move has much force, buyers support and bullish momentum, we can aim for the higher targets. If the initial action is weak and there isn't enough market-buyers support, then we aim lower; it all depends on how the bull market develops but overall the potential is very strong. For Render, for Bitcoin and the rest of the altcoins.
Thanks for the support.
Namaste.
Rendernetwork

RENDER Bounces from Strong Confluence Zone$RENDER/USDT Update
RENDER is holding well above the key support zone after a clean retest of the area of confluence.
What’s interesting here is that the old resistance has now flipped into support, this is often a strong bullish signal on higher timeframes.
Price bounced exactly where you’d expect, at the intersection of horizontal support and the rising trendline.
As long as RENDER continues to respect this zone, the structure remains bullish.
DYOR, NFA
Thanks for following along — stay tuned for more updates!

#RENDER/USDT#RENDER
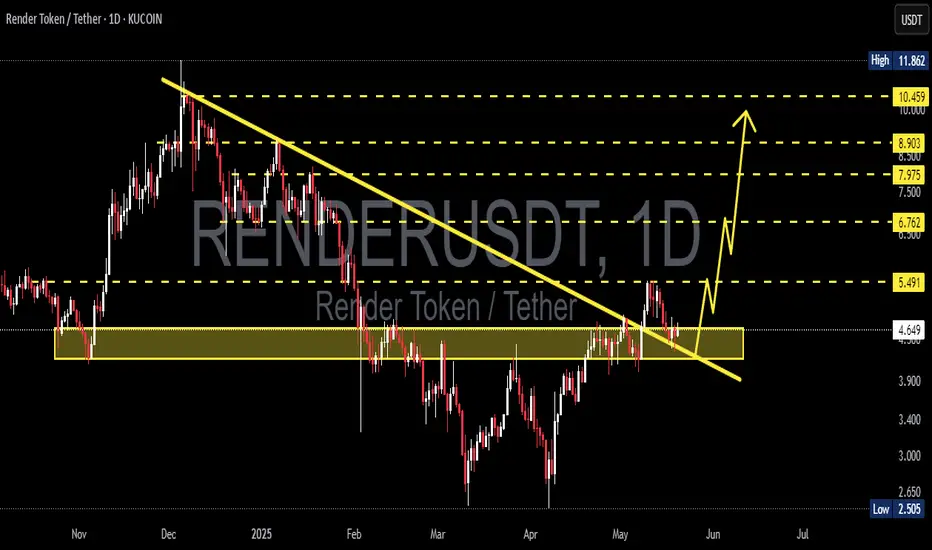
The price is moving within a descending channel on the 1-hour frame, adhering well to it, and is heading for a strong breakout and retest.
We are experiencing a rebound from the lower boundary of the descending channel, which is support at 4.20.
We are experiencing a downtrend on the RSI indicator that is about to break and retest, supporting the upward trend.
We are looking for stability above the 100 Moving Average.
Entry price: 4.41
First target: 4.60
Second target: 4.78
Third target: 4.98

#RENDER/USDT#RENDER
The price is moving in a descending channel on the 1-hour frame and is expected to continue upwards
We have a trend to stabilize above the moving average 100 again
We have a descending trend on the RSI indicator that supports the rise by breaking it upwards
We have a support area at the lower limit of the channel at a price of 3.55
Entry price 3.75
First target 3.92
Second target 4.14
Third target 4.40

RENDERUSDT 1D Analysis RENDER ~ 1D Analysis
#RENDER Buy gradually from here if you still have confidence in this coin with a short term target of at least 10%++ from here.
RENDERUSDT 1D AnalysisRENDER ~ 1D Analysis
#RENDER Buy after successfully penetrating this resistant line with a short -term target of at least 10%+ from here.
Render Is Ready, Bottom Confirmed (340% Easy Target)Render Token is super ready right now and the correction bottom is now confirmed. Notice this pattern on the chart. There are two lows and then a move back above support.
The current candle is the bullish signal. After trading lower, it is now at the upper end of the session, trading near the session high. This high is higher than the previous session open and the close of the one preceding it, the full green candle.
After the main low there were two strong green sessions. Followed by one red session and the current session moving lower, meaning bearish action. This bearish action is being negated and once this session closes green, we have a very strong bullish signal with the bottom confirmed. This will be the start of the next bull market phase.
There will be long-term growth. RENDERUSDT can grow much more than the 340% shown on the chart. It will definitely go much higher, this target is for the mid-term, within 3 months. It will start to grow now, in the coming days and weeks and everything will speed up. This target will hit but no big deal, there will be more.
Expect a correction between now and the final bull market bull-run. The correction can last three weeks just as it can last 2 full months or more. We will have a better idea when the bull market starts to develop. It is still very early but also very close. We have only a few weeks before the entire Cryptocurrency market turns green.
Namaste.

RNDR/USDT – Double Bottom Formation Signals Reversal PotentialRender (RNDR) is currently forming a Double Bottom pattern, signaling a potential bullish reversal from recent lows. The pattern is validated if the price breaks above the Resistance Neckline at 4.200, confirming strength from buyers.
📌 Key Technical Levels:
Key Support: 3.235 – a critical level where price previously found buying interest.
Order Block (OB) Zone: 3.400 - 3.484 – potential demand area for renewed bullish momentum.
Strong Resistance Zone: 5.800 - 6.200 – historical selling pressure likely to be met if price continues upward.
A decisive break above the neckline could trigger a rally toward the Strong Resistance Zone, aligning with prior structural reactions. However, failure to sustain momentum might see retests of Key Support and the OB zone for liquidity gathering. Traders should monitor volume confirmation and price reaction at these critical levels.

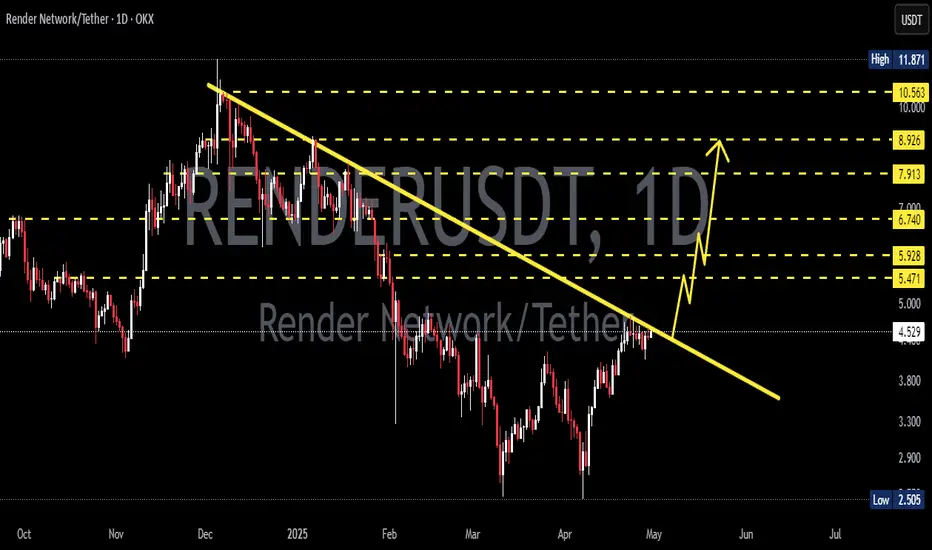
RENDER price analysisOKX:RENDERUSDT chart is starting to show increased trading volumes.
This could mean that the double bottom is coming to an end.
🟨 Risky - to try to buy #RENDER near $3
🟩 Safe - buy #RENDER after the price is fixed above $4
And then in the range of $6.50-7.50
Which way will you choose?
_____________________
Did you like our analysis? Leave a comment, like, and follow to get more

RENDERUSDT 1WRENDER ~ 1W Analysis
#RENDER Buy gradually from here with a short -term target of at least 20%++.
RENDER/USDT:UPDATEHello friends
Given the good return that the price has had, especially from an important support, it can be understood that the buyers have become strong and we can play behind their hands.
We have specified the buying steps for you and the goals have also been specified.
I hope you like it and support us.
*Trade safely with us*

Render about to turn?RenderUSD
Support levels at $4.00 And 3.91
Tight resistance levels at 4.11 and 4.30... if we can break 4.30 this should grind up to the 5.22 levels
I can see render making a rounded bottom here... and start its grind upward...if we break below the 3.92 there is a long way down so as always use cuation and remember that capital preservation is always #1 when trying to make money

RENDERUSDT Below Key Support—But Is a Massive Reversal Incoming?Yello, Paradisers! #RENDERUSDT just broke a critical support level, triggering a major downside move. But here’s where things get interesting—before this drop, RENDER left behind wickless candles at $8.70 to $8.80, signaling unfinished business at higher levels. Could a sharp reversal be on the cards? Let’s break it down.
💎Right now, #RENDER has tested the breakout support region between $3.40 - $3.15—the same level that originally fueled its last major rally. This is a key demand zone where bulls are likely to step in aggressively, triggering short-covering and possibly even a higher time-frame reversal.
💎Sellers need to be extremely cautious here. This zone has the potential to create a slingshot effect, where a sudden surge in buying pressure could trap shorts and send RENDER flying back up before they can react.
💎If bulls successfully defend this level, the first upside target sits at $5.65. A breakout above this could open the door toward $6.25 - $6.55, a pivotal resistance zone that will determine whether RENDER can regain full bullish momentum. Strength above this level would likely send the price surging toward the wickless candle at $8.80, where unfinished liquidity could be swept.
Patience and discipline are key here, Paradisers. The market often tests both bulls and bears before making decisive moves, so stay vigilant.
MyCryptoParadise
iFeel the success🌴

RENDERUSDT 1WRENDER ~ 1W Analysis
#RENDER Re-test this support, Buy from here if you still have a Conviction on this coin with a minimum target of 20%+
RENDER = approaching Entry level!Hi fellow traders, RENDERUSDT is getting ready to make a move higher after it completes the correction. Target the 13.8877 level. Good luck and trade safe!

Render ; +100$ in playEvening folks , people who know me also know that I’m super bullish on AI , Done some projects before and I’m bullish on Render as well , wanna keep the chart simple and wont say much tho asking you to have your research about render with chatgpt or grok , amazing roadmap and partnerships and amazing community.
Dyor

#RENDER/USDT Ready to go higher#RENDER
The price is moving in a descending channel on the 1-hour frame and sticking to it well
We have a bounce from the lower limit of the descending channel, this support is at 6.87
We have a downtrend on the RSI indicator that is about to be broken, which supports the rise
We have a trend to stabilize above the moving average 100
Entry price 7.15
First target 7.67
Second target 8.00
Third target 8.34

RENDERUSDT: Strategic Support Zones at the Blue BoxesIn this analysis, the blue boxes stand out as potential support areas worth close attention. These zones are significant for two key reasons:
They align with demand areas, where buying pressure is likely to increase.
They act as first lines of defense, offering a possible halt to further downside movement.
Trading Plan
Focus on Lower Time Frame Reactions: Observing price behavior within the green line and the blue box zones is essential. Key indicators include bullish candlestick patterns, volume surges, or other signs of reversal.
Long Trade Opportunities: If positive reactions occur in these areas, long trades can be structured with well-defined entry, stop-loss, and target levels.
Summary
The blue boxes in RENDERUSDT represent high-probability support zones, combining technical demand with structural significance. By analyzing the lower time frame reactions, traders can position themselves for potential upside opportunities while managing risks effectively.
I keep my charts clean and simple because I believe clarity leads to better decisions.
My approach is built on years of experience and a solid track record. I don’t claim to know it all, but I’m confident in my ability to spot high-probability setups.
My Previous Analysis
🐶 DOGEUSDT.P: Next Move
🎨 RENDERUSDT.P: Opportunity of the Month
💎 ETHUSDT.P: Where to Retrace
🟢 BNBUSDT.P: Potential Surge
📊 BTC Dominance: Reaction Zone
🌊 WAVESUSDT.P: Demand Zone Potential
🟣 UNIUSDT.P: Long-Term Trade
🔵 XRPUSDT.P: Entry Zones
🔗 LINKUSDT.P: Follow The River
📈 BTCUSDT.P: Two Key Demand Zones
🟩 POLUSDT: Bullish Momentum
🌟 PENDLEUSDT.P: Where Opportunity Meets Precision
🔥 BTCUSDT.P: Liquidation of Highly Leveraged Longs
🌊 SOLUSDT.P: SOL's Dip - Your Opportunity
🐸 1000PEPEUSDT.P: Prime Bounce Zone Unlocked
🚀 ETHUSDT.P: Set to Explode - Don't Miss This Game Changer
🤖 IQUSDT: Smart Plan
⚡️ PONDUSDT: A Trade Not Taken Is Better Than a Losing One
💼 STMXUSDT: 2 Buying Areas
🐢 TURBOUSDT: Buy Zones and Buyer Presence
🌍 ICPUSDT.P: Massive Upside Potential | Check the Trade Update For Seeing Results
🟠 IDEXUSDT: Spot Buy Area | %26 Profit if You Trade with MSB
📌 USUALUSDT: Buyers Are Active + %70 Profit in Total

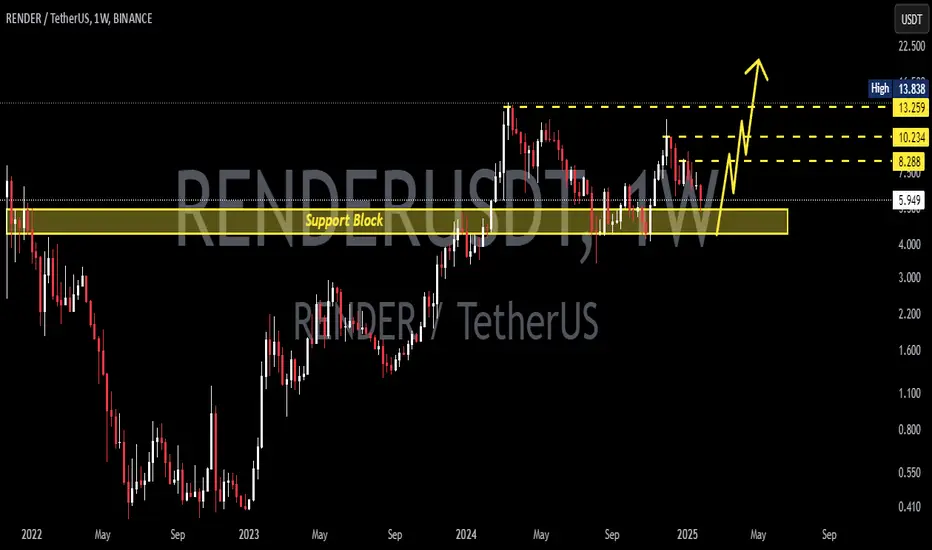
RENDERUSDT 1WRENDER Update ~ 1W
#RENDER As long as still maintain this support block,. Bullish still maintains its structure. If using the Elliott Wave pattern,. this is the 2nd wavy. Buy in stages with a minimum target of 20%+

RENDER | HOW TO GET IN ?I initially entered SEED_DONKEYDAN_MARKET_CAP:RNDR positions around the $5 level, anticipating a strong move. With the market positioning itself for another potential breakout, SEED_DONKEYDAN_MARKET_CAP:RNDR is at a critical juncture.
The price is currently testing a significant resistance zone, and a clean break above this level could signal the next explosive move. Traders can look to board the train once this resistance is breached and confirmed, aligning with the broader bullish momentum in the market.
I keep my charts clean and simple because I believe clarity leads to better decisions. Trading doesn’t have to be overly complicated, and I enjoy sharing setups that have worked well for me.
My approach is built on years of experience and a solid track record. I don’t claim to know it all, but I’m confident in my ability to spot high-probability setups. It’s all about learning and growing together as traders, and I’m here to share what I see.
The markets can confirm what the charts whisper if we’re paying attention. I hope these levels help you as much as they’ve helped me in the past. Let’s see how this plays out!
My Previous Analysis
🐶 DOGEUSDT.P: Next Move
🎨 RENDERUSDT.P: Opportunity of the Month
💎 ETHUSDT.P: Where to Retrace
🟢 BNBUSDT.P: Potential Surge
📊 BTC Dominance: Reaction Zone
🌊 WAVESUSDT.P: Demand Zone Potential
🟣 UNIUSDT.P: Long-Term Trade
🔵 XRPUSDT.P: Entry Zones
🔗 LINKUSDT.P: Follow The River
📈 BTCUSDT.P: Two Key Demand Zones
🟩 POLUSDT: Bullish Momentum

RENDER | Characteristic of a ConsolidationYou can jump in to the train anywhere below 0.5.
RENDER is completing this type of consolidation in this way, but if it loses here, I can also evaluate the lower regions as a purchase. I had previously purchased RENDER at an average of $5.5 and shared my analysis here.
If we go below $6.961 we might see a pullback till $6.330.
My Previous Ideas
DOGEUSDT.P | 4 Reward for 1 Risk much more if you hold it.
RENDERUSDT.P | HTF Accuracy
ETHUSDT.P | Accurate Buyer Zone Identification | High Risk Reward if you hold it.
BNBUSDT.P | Accurate Buyer Zone Identification | High Risk Reward if you hold it.
Bitcoin Dominance | Great Characteristic Detection and Accurate Analysis

#RENDER / Ready to go up#RENDER
The price is moving in a descending channel on the 12-hour frame and sticking to it well
We have a bounce from the lower limit of the descending channel, this support is at a price of 4.20
We have a downtrend, the RSI indicator is about to break, which supports the rise
We have a trend to stabilize above the moving average 100
Entry price 5.57
First target 6.43
Second target 7.31
Third target 8.18

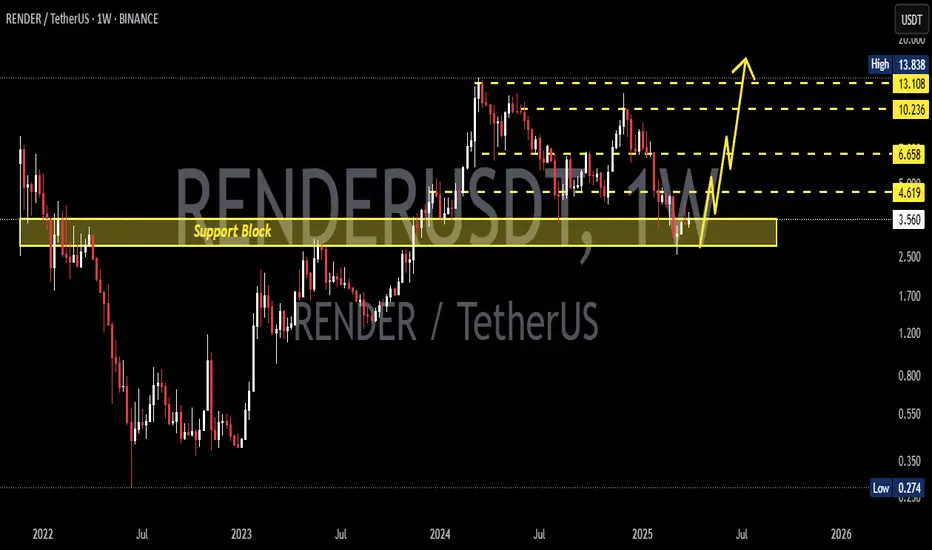
RENDER SWING LONG IDEA - RENDER COIN RENDER is one of the leading AI and DePIN projects in the crypto market. During the 2023-2024 altcoin bull cycle, this coin achieved a remarkable 10x return, so I recommend keeping a close watch on it.
Technical Analysis: The price recently hit the monthly demand and faced a rejection there during the August 5th dip. This rejection sparked an immediate bullish movement and shifted the weekly structure to bullish. The price also initially pulled back from a bearish trendline responsible for the downtrend since March 2024.
Recently, the price broke through this bearish trendline with strong momentum, highlighting the strength of the trend, and I’m interested in joining the trade after this breakout. My targets are set on the purple levels, and I expect potential upside in the coming months.
SL: $3.98
TP1: $6.80
TP2: $11.90
TP3: $13.80
