RENDER is super bullishFrom where we placed the green arrow on the chart, RENDER has entered a bullish phase
This phase is a diamond diametric, we are now at the end of wave D of this diametric.
By maintaining the green range, it can create a new ATH for wave E.
Closing a daily candle below the invalidation level will violate this analysis
For risk management, please don't forget stop loss and capital management
Comment if you have any questions
Thank You
Renderusdt

RENDER/USDT Breakout Alert: 200%+ Pump on the Horizon?🚀 Hey Traders! 👋
If this setup resonates, smash that 👍 and hit Follow for trade ideas that deliver results! 💹🔥
RENDER is looking primed for action! It’s broken out of a symmetrical triangle and successfully retested during the recent dip. This could be your chance to accumulate and add more on pullbacks. I’m eyeing a potential 200-250% pump this altseason! 🚀
📈 Trade Setup:
Entry Range: $6.7 - $7.7
Targets: $10 / $14 / $19 / $25
Stop-Loss (SL): $5.60
💬 What’s Your Take?
Are you seeing the same explosive breakout potential? Share your analysis, thoughts, or predictions below. Let’s ride this wave together and lock in massive gains! 💰🌊
🔔 Stay Tuned for More Winning Setups!

RENDERUSDT, 1D, Inverted Head & ShoulderRENDERUSDT, 1D, Inverted Head & Shoulder.
It has now reached it's inverted right shoulder. By the 1D chart, the price depicted a hammer candlestick with a long bottom wick. This typically happens after a price decline.
My approach would be to wait for tomorrow or next day to check if there is 3 continuous green candlesticks and price holds at closing price approx ~$7.8.
This might signify a reversal.
Else, if ti dips below ~$4.7, it might continue to drop till ~$3.2

RENDER SWING LONG OPPORTUNITY - CRYPTO MARKETPrice is reaching to Price is approaching the monthly demand zone, aligning with a massive bearish trendline originating from Spring 2024. Additionally, there’s confluence with a key Fibonacci level. I anticipate a bounce from this area, potentially leading to new highs or even all-time highs.
As always, wait for lower time frame confirmations before initiating the idea.

Render Network RENDER Long: EWT Analysis & Cycle Peak Targets+ Possible overextended Wave 5 count now?
Trading within Wave (3) of Wave V impulse.
Any major peaks in RENDER have extended as high as the following fib extensions...
The target is the peaks of the parallel channel, confluence with the fib extensions targets:
- 1.414
- 1.618
Last Rally for Cycle Wave V (five) topping around Nov/Dec 2025 being a blow off top.

#RENDE(SPOT) entry range( 4.45- 5.45) T.(10.299) SL(4.439)BINANCE:RENDERUSDT
entry range ( 4.45- 5.45)
Target (10.299)
SL .1D close below (4.439)
*** collect the coin slowly in the entry range ***
*** No FOMO - No Rush , it is a long journey ***
**** #Manta ,#OMNI, #DYM, #AI, #IO, #XAI , #ACE #NFP #RAD #WLD #ORDI #BLUR #SUI #Voxel #AEVO #VITE #APE #RDNT #FLUX #NMR #VANRY #TRB #HBAR #DGB #XEC #ERN #ALT #IO #ACA #HIVE #ASTR #ARDR #PIXEL #LTO #AERGO #SCRT #ATA #HOOK #FLOW #KSM #HFT #MINA #DATA #SC #JOE #RDNT #IQ #CFX #BICO #CTSI #KMD #FXS #DEGO #FORTH # AST #PORTAL #CYBER #RIF #ENJ #ZIL #APT #GALA #STEEM #ONE #LINK #NTRN #COTI #RENDER ****

RENDER goes BooOooOooM!?RENDER spiked up for news looks weak to me, Shorts at cmp for targets till 6.636 deep and 7.348 for shorts targets, Invalid above tops high 11.895 as SL's Quick and risk free trades.
I know alt season memes season, for me it looks bit compulsive

RENDER | HOW TO GET IN ?I initially entered SEED_DONKEYDAN_MARKET_CAP:RNDR positions around the $5 level, anticipating a strong move. With the market positioning itself for another potential breakout, SEED_DONKEYDAN_MARKET_CAP:RNDR is at a critical juncture.
The price is currently testing a significant resistance zone, and a clean break above this level could signal the next explosive move. Traders can look to board the train once this resistance is breached and confirmed, aligning with the broader bullish momentum in the market.
I keep my charts clean and simple because I believe clarity leads to better decisions. Trading doesn’t have to be overly complicated, and I enjoy sharing setups that have worked well for me.
My approach is built on years of experience and a solid track record. I don’t claim to know it all, but I’m confident in my ability to spot high-probability setups. It’s all about learning and growing together as traders, and I’m here to share what I see.
The markets can confirm what the charts whisper if we’re paying attention. I hope these levels help you as much as they’ve helped me in the past. Let’s see how this plays out!
My Previous Analysis
🐶 DOGEUSDT.P: Next Move
🎨 RENDERUSDT.P: Opportunity of the Month
💎 ETHUSDT.P: Where to Retrace
🟢 BNBUSDT.P: Potential Surge
📊 BTC Dominance: Reaction Zone
🌊 WAVESUSDT.P: Demand Zone Potential
🟣 UNIUSDT.P: Long-Term Trade
🔵 XRPUSDT.P: Entry Zones
🔗 LINKUSDT.P: Follow The River
📈 BTCUSDT.P: Two Key Demand Zones
🟩 POLUSDT: Bullish Momentum

RENDER | Characteristic of a ConsolidationYou can jump in to the train anywhere below 0.5.
RENDER is completing this type of consolidation in this way, but if it loses here, I can also evaluate the lower regions as a purchase. I had previously purchased RENDER at an average of $5.5 and shared my analysis here.
If we go below $6.961 we might see a pullback till $6.330.
My Previous Ideas
DOGEUSDT.P | 4 Reward for 1 Risk much more if you hold it.
RENDERUSDT.P | HTF Accuracy
ETHUSDT.P | Accurate Buyer Zone Identification | High Risk Reward if you hold it.
BNBUSDT.P | Accurate Buyer Zone Identification | High Risk Reward if you hold it.
Bitcoin Dominance | Great Characteristic Detection and Accurate Analysis

#RENDER / Ready to go up#RENDER
The price is moving in a descending channel on the 12-hour frame and sticking to it well
We have a bounce from the lower limit of the descending channel, this support is at a price of 4.20
We have a downtrend, the RSI indicator is about to break, which supports the rise
We have a trend to stabilize above the moving average 100
Entry price 5.57
First target 6.43
Second target 7.31
Third target 8.18

Here I buy RENDER at $7Here I buy RENDER at $7
With market orders as usual
And RENDER supply shock is happening
They see me buyin, they hatin'
Patrollin' and tryna catch me ridin' dirty
Tryna catch me ridin' dirty
Tryna catch me ridin' dirty
Tryna catch me ridin' dirty
Tryna catch me ridin' dirty
My music's so loud, I'm swangin'
oh
My greed's so high, I'm fomoin'
They hopin' that the market will crash while I'm buyin
Tryna catch me ridin' dirty
Tryna catch me ridin' dirty
Tryna catch me ridin' dirty
CRYPTOCAP:RENDER #RENDER

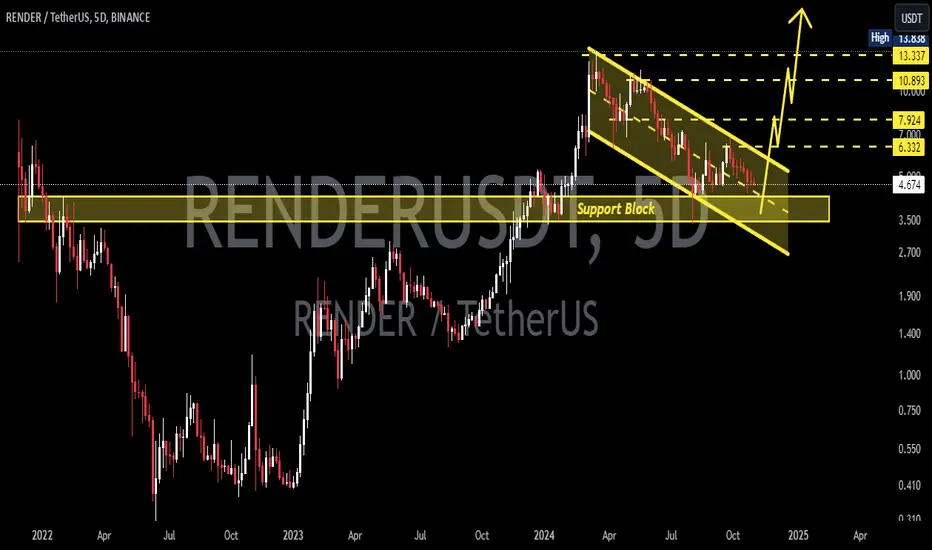
RENDERUSDTRENDER ~ 5D
#RENDER A retest of this support block would be a very strong buy signal. buy in stages with a short term target of at least 20%++
#RENDER (SPOT) entry range( 6.00- 6.690) T.(10.300) SL(5.827)BINANCE:RENDERUSDT
entry range ( 6.00- 6.690)
Target (10.300)
SL .4H close below (5.827)
*** No FOMO - No Rush , it is a long journey ***

Might be the opportunity of the MonthI believe RENDER has huge potential. After a short term pull-back I think huge move will follow.

RENDERUSDTRENDER ~ 1W
#RENDER Make purchases gradually in this pattern. it is only a matter of time that this pattern is successfully broken.

RENDER target 7.444h time frame
-
Entry: $4.8
TP: $7.44
SL: $4.11
RR: 3.74
-
(1) Potential rounding bottom on 1h
(2) Getting support twice at Fib projection 0.382
(3) Depend on time and space analysis, it might go over $7 before October
(4) Fib projection 1.13~1.272 is the target range around $7~$7.45
(5) Stop loss once going below $4.11

#RENDER Technical Analysis in a Daily TimeframeHello everyone, I’m Cryptorphic.
I’ve been sharing insightful charts and analysis for the past seven years.
Follow me for:
~ Unbiased analyses on trending altcoins.
~ Identifying altcoins with 10x-50x potential.
~ Futures trade setups.
~ Daily updates on Bitcoin and Ethereum.
~ High time frame (HTF) market bottom and top calls.
~ Short-term market movements.
~ Charts supported by critical fundamentals.
Now, let’s dive into this chart analysis:
RENDER is facing resistance at the 50 EMA, and to continue its rebound, it must break above this level.
The price is gaining strong momentum, and as long as RENDER maintains the support trendline, we can expect the rally to continue.
If a rejection occurs, the lower support could present a good entry range for RENDER.
Key levels:
- Primary Resistance: $5.427.
- Initial Target: $8.02
- Primary Support: $4.09.
- Lower Support/Good Entry: $3.38.
DYOR, NFA.
Please hit the like button to support my content and share your thoughts in the comment section. Feel free to request any chart analysis you’d like to see!
Thank you!
#PEACE

$RENDER Accumulation ZoneCRYPTOCAP:RENDER pulled up 90% increase from the lows, and it's being rejected again from dema200
RENDER is sought to be the leading AI/DePIN (Decentralized physical infrastructure networks) project riding the Nvidia hype.
However, Nvidia slumped after earnings beat.
Support level I'm looking now is around $4.20 to $4, lose this level then will definitely set for lower floor $2.60 to $1.30 where I would be looking to accumulate.

RENDERUSDT A Bullish Breakout or a Trap? Watch close this!RENDERUSDT – A Bullish Breakout or a Trap?
Yello, Paradisers! Are you ready for the next potential move in #RENDERUSDT? Let’s get into the details.
💎#RENDER has broken out of a descending channel, which is typically a bullish sign. The current price is likely to test the support zone between $5.65 - $5.336 before continuing its upward movement. If this support holds, we could see the price push towards the next resistance area. However, for RENDER to continue its ascent, it must break through this resistance zone to reach our target at the strong resistance level.
💎On the flip side, if RENDER fails to rebound from the $5.336 support and breaks below it, there's a high probability that the price could drop to the $4.37 demand zone. This area is crucial, as it has previously served as a strong base where many buyers have stepped in.
💎The bullish scenario would be invalidated if RENDER's daily candle closes below the $4.37 demand level. This area marks the previous low, and breaking below it could lead to a new lower low, signaling a deeper correction ahead.
Stay focused, patient, and disciplined Paradisers.
MyCryptoParadise
iFeel the success🌴

Is #RENDER still in a downtrend?#Render 1D chart;
Continues the downtrend that started in March with lower highs
It was last downtrending at $6.3 (CHoCH)
A close above the $7.2 level is required before we can talk about a rebound
Otherwise, the levels where it can go by making lower highs;
First OB support at $3.7
If it loses here, the IMB level will be $2.8.
Of course, although its first priority in every upward move is to overcome the previous low peak, it should not be forgotten that the downward trend line (red line) will also act as resistance.

RNDR: Render BEST BUY ZonesRENDER is one of my top altcoin pics for 2024.🏆
It increased a generous 305% since the beginning of the year, and a new bullish cycle is likely next s soon as we hit the ideal re-accumulation zones where whales prefer to buy back.
A -77% retracement hit the next major demand zone, where I expect to see a decent bounce. Between this zone and the lower zone , I'd be looking to re-accumulate for a loner term hold position:
👍 Follow Us to make sure you stay updated
_____________________________
BINANCE:RENDERUSDT

Render Token / RNDRThe price of RNDR is $1.83 today with a 24hour trading volume of 180 million dollars. This represents a 4% price increase in the last 24 hours and a 333% price increase in the past 30 days!
Render token is a distributed GPU rendering network built on top of the Ethereum blockchain, aiming to connect artists and studios in need of GPU compute power with mining partners willing to rent their GPU capabilities out. Backed by parent company OTOY, the RNDR team is based out of Los Angeles, with team members throughout the world. The RNDR advisory board boasts industry leaders such as Ari Emanuel (Co-Founder and Co-CEO, WME), JJ Abrams (Chairman and CEO, Bad Robot Productions) and Brendan Eich (Founder and CEO, Brave Software and BAT)
bulls broke 0.8, 1.2 and 1.6 resistance and ready to claim 2$. I got into rndr wen it has 220 million market-cap and here we are at half a billion dollar mc. as you see market is in correction phase which is normal and healthy so don't panic if you see couple of red candles after 300% pump

What is next for RENDER?Hello everyone,
Here are my targets for CRYPTOCAP:RNDR during the bull market, as shown on the chart:
I'm setting the ATH (All-Time High) of this coin at $47 this season. However, as I've mentioned before, you cannot predict what will happen in a bull market. So, I always have a plan B with a more ambitious target of $320.
Although supports and resistances are demonstrated on the chart.
I say this because some altcoins will experience significant price surges during the bull market, far exceeding others.
Especially lately, CRYPTOCAP:RNDR has migrated to the CRYPTOCAP:SOL blockchain. Therefore, if SOL experiences a significant surge, all Solana-related altcoins could see substantial upside movement.
Feel free to ask any questions you may have.
Have a nice day!
Note: Charts and ideas will be updated as necessary.
