REPBTC 4HAugur; can breakout with probability of the Gartley Pattern-bearish/d's leg and the Cup. Good luck!
REPBTC
REP Descending ScallopDescending Scallop, this is a bullish reversal pattern. Alts are currently being accumulated hugely!
Augur UpdatePossible parabolic rally is occurring, bounces in price can be seen when Gaussian channel turns bearish immediately turning the channel bullish again, this may occur a fourth time, however it usually comes in threes. Included a short term PT for a next wave up.
Augur/BTC breaking out. Downtrend EndAugur is staying above year long downward resistance line. Possible breakout if it stays on the current uptrend channel.
Can break out higher from channel from now.
Bullish setup in Augur.
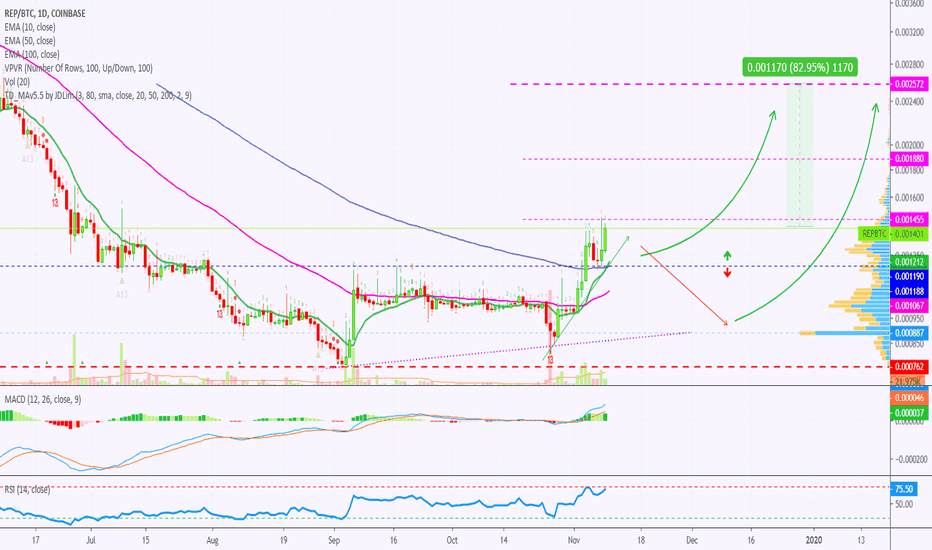
Augur Will Do 80%+ After 55% Growth | Chart AnalysisWe shared a chart for Augur (REPTC) over 2 months ago which produced great gains for our readers, supporters, and followers...
This pair has been growing since... You can see it below:
Now, additional bullish action is possible.
Chart signals
Bullish MACD and RSI.
Trading above EMA10, EMA50, and EMA100.
Increasing volume.
Keep it simple... REPBTC is very likely to continue to grow.
Feel free to hit like to show your support.
Namaste.
Augur Three Falling PeaksThree falling peaks pattern, 'similar to a triple top, but unlike a triple top the tops aren't on the same level but rather descend.' Characterized by three seperate lower highs.
REPBTC : Falling Wedge Pattern.REPBTC : Falling Wedge Pattern.
Note: This is only for Educational Purpose this is not Investment advice.
Thanks
Adil Khan.
REP/BTC TA Update (Pump Hard?)REP/BTC
REP is doing it like crazy Altcoins season with over 90% pump?
Lucky people those who bought at around 1100 - 1200 regions, Sell now and don't be greedy too much.
We are late to the party and please do not FOMO! Wait for the pullback is the best strategy I can suggest.
Personal indicatorHello everyone, this is our view on repbtc, enjoy!
Analysis:
It seems like investors didn't really like oracola in 2019, but they could give a good profit anyway. So we're now approaching Augur's Reputation token. On chart analysis is quite simple this time: price will bounce right from where all those 3 lines (lower line in the falling wedge and bull flag, support and trendline sup-sup) meet. First signal of an upgoing move will be golden cross ma9-ma25. Daily closure above wma10 will be a bullish signal too and first target will be ema on h4. Bollinger is a little bearish short-term. Big ichimoku cloud will stretch as price will go down. In a bearish downtrend many laggings (chaikin, moneyflow, rsi, stoch (14,3,3), uo) formed bullish divergences. No more information from different lenghts. Bull divergence which is also on ao and macd as they're now marking a good momentum but in downtrend. Macd also attempting not to form a death cross. Last red candle marked a F, nothing more from greed & fear.
P.s. this is one of my personal indicators for next altcoins rally as it seems it wants to follow lend steps. Other indicators like this are matic, nebl, qsp, key and poly (some of them already pumped a little).
Strategy:
Entry: 1162 (actual price) - 1107 - 1079
Target (short-term): 1167 - 1232 - 1249
Sell (HODL): 1204 - 1389 - 1475 - 1597 - MOON
Stoploss: 1038
High risk for big gains.
Trade safe. Anlvis.
Trade Idea for REP/BTCRep has just broke out from the flag, expecting it to move up
Entry, stop and targets are mentioned in the chart
REP/BTC TA Update (Bull Flag?)REP/BTC
REP is on a steady pullback after breaking above 200 Day MA. Price is could deep lower further around the previous Higher Low and the 200 Day MA area.
Market structure is strongly bullish and no red flags yet, we will have just to wait how the price reacts with the 200 MA again.
Augur still has room to growAfter a small retracement, I expect Augur to further gains up to ~2700 sats, Parabolic SAR shows a clear mirror downtrend which led to upsides, this is a promising project with great fundamentals in my bias opinion ;p.
REPBTC ideaPossible drop coming after a curved top has formed, strong regression trend this may hold. However curved tops are usually followed by a drop.
$REP, Showing signs of accumulation over support at ~150sats $REP
Showing signs of accumulation over support level at ~150sats w/ increasing volume
UCTS Buy signal on the 1D active for a long time (35%+ up)
EMA200(red) acting as resistance
Volume rising...
If it gets traction from here, aiming for ~170k sats (15%)
#REP
REPBTC a very strong bullish signalthis coin showing a very strong bullish signal. I believe that it will reach all targets in few weeks
REPBTC 2H Deescending TriangleWill it retest the support line or will it break the pattern? Eitherway can result in an upward move..


