Request Network Has 1,800% Potential for Growth (Lev. Setup)This is a chart setup that I am opening with leverage. It is not available on many exchanges and this reduces risk for swings and shakeouts. The action has been strong.
Request Network (REQUSDT) produced a strong higher low in June compared to February and April this year. Many pairs produced double-bottoms or even a lower low in June. A higher low definitely reveals strength. This is what we have here.
The consolidation period has been going for 1,169 days. This is the exact same number we found on the DigiByte chart, more than three years. Three years of consolidation can lead to a very strong bullish cycle. So strong that it is hard to visualize but it will happen.
I am mapping a 1,800% target but just to be safe, I also have the 2,400%. Again, when the market lasts this long in the accumulation phase, it is because it is preparing for something great. The action is about to start within weeks or days.
The last barrier is the long-term resistance (orange) line on the chart. Once this level breaks, immediately you can expect +300% to 500%. After this initial boom, you can enjoy slow and steady growth for months. That's where we are headed. This will not only happen to Request Network but for most of the altcoins, Bitcoin is already up.
Retraces and corrections should be considered an opportunity to buy-in, rebuy and reload.
Namaste.
Requsdt
#REQ/USDT#REQ
The price is moving within a descending channel on the 1-hour frame, adhering well to it, and is heading for a strong breakout and retest.
We are seeing a bounce from the lower boundary of the descending channel, which is support at 0.1367.
We have a downtrend on the RSI indicator that is about to break and retest, supporting the upward trend.
We are looking for stability above the 100 Moving Average.
Entry price: 0.1386
First target: 0.1400
Second target: 0.1420
Third target: 0.1440

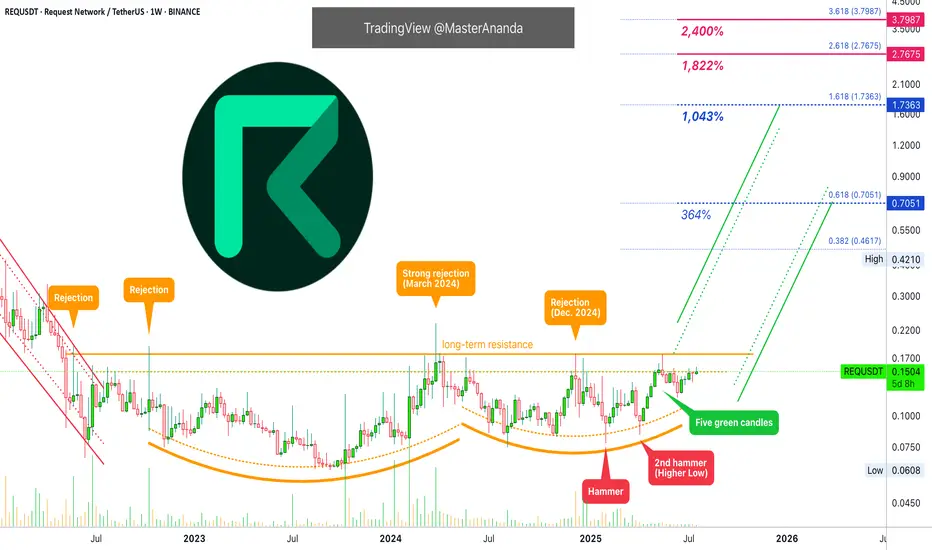
Request Network Long-Term Resistance & New ATH (PP: 1195%)The previous three weeks all closed green and were perfect full bodied candles. This is a strong signal on its own. But REQUSDT (Request Network) didn't print this signal in isolation, it is coming after a hammer candlestick pattern which is also a short-term and long-term higher low. Makes sense?
The market bottom was hit in September 2023. The three white soldiers, as it is called in candlestick reading, is an action signal. It confirms an advance will happen and the hammer candlestick pattern is a reversal signal. The long-term higher lows is a chart structure signal and it can help us project how the pair in question will behave in the future.
With a strong chart structure, we can predict a strong bull market for this pair.
With the action and reversal signal, we can predict the start of the next bullish wave within days. It is already happening because three weeks closing green is a decent amount of time.
The resistance zone on this chart is well established. This resistance was confirmed in May 2022 with a full rejection on a candle. The again in October 2022 there was a strong attempt by the bulls to push prices higher but another failure it seems.
In March 2024 there was another rejection, a strong one because this one cancelled a bullish wave. The final rejection at this long-term resistance zone happened in December 2024.
While the resistance range stays the same, the support zone has been growing from its base (higher lows).
Ok, I will make my prediction now.
» On the next advance, which is part of the current bullish wave, REQUSDT will break this long-term resistance and challenge $0.70 as the first strong target. After this level is challenged there will be a correction followed by additional growth. This additional growth will lead to a new All-Time High as part of the 2025 bull market bull run.
Thank you for reading and for your continued support.
Namaste.

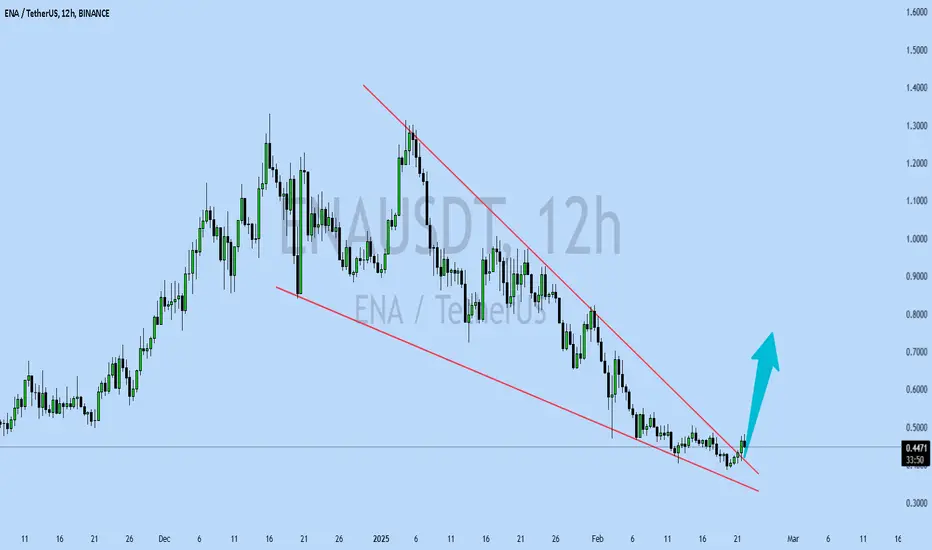
ENAUSDT UPDATEENAUSDT is a cryptocurrency trading at $0.4483. Its target price is $0.7500, indicating a potential 70%+ gain. The pattern is a Bullish Falling Wedge, a reversal pattern signaling a trend change. This pattern suggests the downward trend may be ending. A breakout from the wedge could lead to a strong upward move. The Bullish Falling Wedge is a positive signal, indicating a potential price surge. Investors are optimistic about ENAUSDT's future performance. The current price may be a buying opportunity. Reaching the target price would result in significant returns. ENAUSDT is poised for a potential breakout and substantial gains.
REQUSDT Analysis: A Beautiful Range, Tremendous OpportunityFolks, REQUSDT is in a beautiful range , truly fantastic. Let me tell you, the blue box reactions here are worth considering. Smart trading starts with smart zones, and this one? It's a winner.
Here’s What You Need to Know:
The Range: It’s solid, it’s reliable, and it’s where the action is.
Blue Box: A prime demand zone. These zones don’t pick themselves; they’re carefully chosen for maximum potential.
Confirmation Is Key: I’ll use CDV, liquidity heatmaps, volume profiles, and volume footprints, along with upward market structure breaks in lower time frames to validate entries. Only the best tools for the best trades.
Want to Trade Like a Pro? Look, I can teach you how to use CDV, liquidity heatmaps, volume profiles, and volume footprints . Just DM me, and you’ll learn from the best.
Final Word: Big moves come from big zones, folks. Be patient, trade smart, and remember—risk management is everything.
If you found this helpful, boost it, comment on it, share it with your friends. Let’s make trading great again!
Let me tell you, folks, this is amazing. Nobody does analysis like I do. Believe me. If this helps you, don't forget to boost and comment! It’s a big deal, motivates me to share even more winning insights with you. Tremendous insights.
I keep my charts the best—clean, simple, and clear. You know it, I know it, clarity leads to better decisions. No question about it. My approach? Built on years of tremendous experience. Incredible track record. I don’t claim to know it all, but I spot high-probability setups like nobody else. Trust me.
Want to learn how to use the heatmap, cumulative volume delta, and volume footprint techniques I use to determine demand regions with stunning accuracy? Send me a private message—totally free, folks. That’s right. I help anyone who wants it, absolutely no charge. Unbelievable value.
Here’s the list—long list, great list—of some of my previous incredible analyses. Each one, a winner:
🎯 ZENUSDT.P: Patience & Profitability | %230 Reaction from the Sniper Entry
🐶 DOGEUSDT.P: Next Move
🎨 RENDERUSDT.P: Opportunity of the Month
💎 ETHUSDT.P: Where to Retrace
🟢 BNBUSDT.P: Potential Surge
📊 BTC Dominance: Reaction Zone
🌊 WAVESUSDT.P: Demand Zone Potential
🟣 UNIUSDT.P: Long-Term Trade
🔵 XRPUSDT.P: Entry Zones
🔗 LINKUSDT.P: Follow The River
📈 BTCUSDT.P: Two Key Demand Zones
🟩 POLUSDT: Bullish Momentum
🌟 PENDLEUSDT.P: Where Opportunity Meets Precision
🔥 BTCUSDT.P: Liquidation of Highly Leveraged Longs
🌊 SOLUSDT.P: SOL's Dip - Your Opportunity
🐸 1000PEPEUSDT.P: Prime Bounce Zone Unlocked
🚀 ETHUSDT.P: Set to Explode - Don't Miss This Game Changer
🤖 IQUSDT: Smart Plan
⚡️ PONDUSDT: A Trade Not Taken Is Better Than a Losing One
💼 STMXUSDT: 2 Buying Areas
🐢 TURBOUSDT: Buy Zones and Buyer Presence
🌍 ICPUSDT.P: Massive Upside Potential | Check the Trade Update For Seeing Results
🟠 IDEXUSDT: Spot Buy Area | %26 Profit if You Trade with MSB
📌 USUALUSDT: Buyers Are Active + %70 Profit in Total
🌟 FORTHUSDT: Sniper Entry +%26 Reaction
🐳 QKCUSDT: Sniper Entry +%57 Reaction
📊 BTC.D: Retest of Key Area Highly Likely
And that’s just the start. The list goes on and on, folks. It’s a tremendous list, the best. I stopped adding because, frankly, it’s tiring. So many wins. People are amazed. You can check my profile and see for yourself—winning moves, all the time. Believe me, nobody does it better.

REQUSDT: Explosive Volume Increase with Little Buyer ActivityREQUSDT is experiencing a 683% surge in volume, signaling that buyers are just stepping in. This incredible volume increase suggests strong potential for significant upward moves if captured from a key level.
It’s beneficial to proceed with low risk, focusing on well-defined demand zones or confirmations on lower time frames. Proper positioning here can yield great results. Always prioritize risk management.
I keep my charts clean and simple because I believe clarity leads to better decisions.
My approach is built on years of experience and a solid track record. I don’t claim to know it all, but I’m confident in my ability to spot high-probability setups.
My Previous Analysis
🐶 DOGEUSDT.P: Next Move
🎨 RENDERUSDT.P: Opportunity of the Month
💎 ETHUSDT.P: Where to Retrace
🟢 BNBUSDT.P: Potential Surge
📊 BTC Dominance: Reaction Zone
🌊 WAVESUSDT.P: Demand Zone Potential
🟣 UNIUSDT.P: Long-Term Trade
🔵 XRPUSDT.P: Entry Zones
🔗 LINKUSDT.P: Follow The River
📈 BTCUSDT.P: Two Key Demand Zones
🟩 POLUSDT: Bullish Momentum
🌟 PENDLEUSDT: Where Opportunity Meets Precision
🔥 BTCUSDT.P: Liquidation of Highly Leveraged Longs
🌊 SOLUSDT.P: SOL's Dip - Your Opportunity
🐸 1000PEPEUSDT.P: Prime Bounce Zone Unlocked
🚀 ETHUSDT.P: Set to Explode - Don't Miss This Game Changer
🤖 IQUSDT: Smart Plan
⚡️ PONDUSDT: A Trade Not Taken Is Better Than a Losing One
💼 STMXUSDT: 2 Buying Areas
🐢 TURBOUSDT: Buy Zones and Buyer Presence

REQUSDT Key Buy Zones and LevelsThe cryptocurrency market remains uncertain, with a possibility of no recovery by year-end. To adapt, I’ve adjusted my buy positions significantly lower to align with current market conditions.
For REQUSDT, I’ve identified blue boxes and lines on the chart as critical buy zones and levels of interest. These areas are strategically selected for their potential to act as strong support and offer a favorable risk-reward setup.
Key Details:
Buy Zones: Blue boxes and lines highlighted on the chart
Risk Management: 0.081$
Target: Awaiting confirmation of a bounce or upward momentum before determining exit levels
Patience and disciplined risk management are vital in these volatile conditions.
Disclaimer: This is not financial advice.
I keep my charts clean and simple because I believe clarity leads to better decisions.
My approach is built on years of experience and a solid track record. I don’t claim to know it all, but I’m confident in my ability to spot high-probability setups.
My Previous Analysis
🐶 DOGEUSDT.P: Next Move
🎨 RENDERUSDT.P: Opportunity of the Month
💎 ETHUSDT.P: Where to Retrace
🟢 BNBUSDT.P: Potential Surge
📊 BTC Dominance: Reaction Zone
🌊 WAVESUSDT.P: Demand Zone Potential
🟣 UNIUSDT.P: Long-Term Trade
🔵 XRPUSDT.P: Entry Zones
🔗 LINKUSDT.P: Follow The River
📈 BTCUSDT.P: Two Key Demand Zones
🟩 POLUSDT: Bullish Momentum
🌟 PENDLEUSDT: Where Opportunity Meets Precision
🔥 BTCUSDT.P: Liquidation of Highly Leveraged Longs
🌊 SOLUSDT.P: SOL's Dip - Your Opportunity
🐸 1000PEPEUSDT.P: Prime Bounce Zone Unlocked
🚀 ETHUSDT.P: Set to Explode - Don't Miss This Game Changer
🤖 IQUSDT: Smart Plan
⚡️ PONDUSDT: A Trade Not Taken Is Better Than a Losing One
💼 STMXUSDT: 2 Buying Areas

REQUSDT(Request) Daily tf Range Updated till 23-02-24REQUSDT(Request) Daily timeframe range. price action here is not as stable as other alts PA. thats why we can see wickout and bigger range levels. but within high risk there are high rewards. if it can hold above 0.1072 a retrace back is very much possible.

#REQ/USDT Long#REQ
On the 1-hour frame, we have a bearish channel within which the price is trading
We have strong support that the price is committed to bouncing from
Entry price is 0.0909
The first target is 0.0949
The second goal is 0.0986
The third goal is 0.1032

REQUSDT.1DBased on the provided market data, the cryptocurrency REQ (Request) is currently trading at $0.14 against USDT (Tether). The Relative Strength Index (RSI) for 4 hours, 1 day, and 7 days are 86.30, 85.45, and 75.30 respectively. These high RSI values indicate that the currency is currently in the overbought territory which may suggest a potential price pullback or slowdown in the near future.
The Moving Average Convergence Divergence (MACD) for 4 hours, 1 day, and 7 days are 0.013, 0.0045, and 0.0060 respectively, which indicates a bullish trend in the short term.
The Bollinger Bands (BB) for 4 hours, 1 day, and 7 days are all at 0.14 indicating that the price volatility for REQ is relatively low.
The support levels for 4 hours, 1 day, and 7 days are at $0.097, $0.088, and $0.075 respectively. These are the levels where we can expect the price to potentially bounce back up from. On the other hand, the resistance levels for 4 hours, 1 day, and 7 days are at $0.15, $0.16, and $0.19 respectively. These are the levels where we can expect the price to potentially pull back from.
In conclusion, REQ is showing signs of being overbought but maintains a bullish trend in the short term. It's crucial to keep an eye on the support and resistance levels for potential price reversal points. Please note that this analysis is based on the current market data and does not take into account unforeseen market events that could potentially affect the price. Always do your own research and consider your financial situation before investing in cryptocurrency.

REQ / REQUSDTGood Luck
• Warning •
Any deal I share does not mean that I am forcing you to enter into it, you enter in with your full risk, because I'll not gain any profits with you in the end.
The risk management of the position must comply with the stop loss.
(I am not sharing financial or investment advice, you should do your own research for your money.)

Request (REQ) formed bullish Gartley for upto 26.50% pumpHi dear friends, hope you are well and welcome to the new update on Request (REQ) with US Dollar pair.
Previously we caught more than 17% pump of REQ as below:
Now on a daily time frame, REQ has formed a bullish Gartley move for another price reversal.
Note: Above idea is for educational purpose only. It is advised to diversify and strictly follow the stop loss, and don't get stuck with trade

Request (REQ) formed bullish Gartley for upto 18% pumpHi dear friends , hope you are well and welcome to the new update on Request (REQ) with US Dollar pair.
Recently we caught more nice pump of REQ as below:
Now on a 4-hr time frame, REQ has formed a bullish Gartley pattern for another price reversal move. (infact with US Dollar pair is forming bullish BAT , but with BTC pair REQ has completed a bullish Gartley , therefore, for easy understanding of targets I am sharing this bullish Gartley move with US Dollar pair)
Note: Above idea is for educational purpose only. It is advised to diversify and strictly follow the stop loss, and don't get stuck with trade

Request (REQ) formed bullish Gartley for upto 15% pumpHi dear friends, hope you are well and welcome to the new update on Request (REQ).
Previously we caught more than 34% pump of REQ as below:
Now on daily time frame, REQ with BTC pair has formed a bullish Gartley move.
Note: Above idea is for educational purpose only. It is advised to diversify and strictly follow the stop loss, and don't get stuck with trade

REQ trade setupSpot setup, nice RR if taking as swingtrade. Want to see clear acceptance above trendline

Request BUY NOW TP 5%The price of Request (REQ) is $0.107628 today with a 24-hour trading volume of $2,012,321. This represents a -0.9495156237760125% price decline in the last 24 hours and a -2.1389132577616103% price decline in the past 7 days. With a circulating supply of 780 Million REQ, Request is valued at a market cap of $83,451,847.

REQUSDT TRYING TO CLEAR TRENDLINE trying to break tl in daily tf
incase of successful breakout expecting 80 to 100% bulish Move

REQ/USDT BINANCE SPOT LONG 🚀🚀REQ/USDT HAS BROKE THE RESISTANCE , I'M EXPECTING THAT IT WILL GO ABOVE 0.1
Please like my idea and follow me for more strong signals

REQUSDTTrying To clear trendline In daily tf
Incase If trendline Got Cleared Expecting massive bulish wave

REQUSDT Almost doubled its value in one day!It was just over a month ago when we called for a strong bullish break-out on the Request Network (REQUSDT), in the event that its medium-term Lower Highs trend-line broke and the 1D MA200 (orange trend-line):
As you see, the break-out happened today and so far is massive as the token is up +85% in just one day! As mentioned then, the target is the 2.0 Fibonacci extension level from the previous Inverse Head and Shoulders. A closing above the 2.0 Fib can be a whole new Bull Phase targeting the 0.33700 Resistance of the April 05 High.
-------------------------------------------------------------------------------
** Please LIKE 👍, SUBSCRIBE ✅, SHARE 🙌 and COMMENT ✍ if you enjoy this idea! Also share your ideas and charts in the comments section below! This is best way to keep it relevant, support me, keep the content here free and allow the idea to reach as many people as possible. **
-------------------------------------------------------------------------------
You may also TELL ME 🙋♀️🙋♂️ in the comments section which symbol you want me to analyze next and on which time-frame. The one with the most posts will be published tomorrow! 👏🎁
-------------------------------------------------------------------------------
👇 👇 👇 👇 👇 👇
💸💸💸💸💸💸
👇 👇 👇 👇 👇 👇

REQUSDT Supported and waiting for the 1D MA200 break-outRequest Network (REQUSDT) held the Symmetrical Support of 0.1040 and broke above both the 1D MA100 (green trend-line) and 1D MA50 (blue trend-line). However it bounced off the Lower Highs trend-line that started on the July 31 High.
As a result, we would like to see a break above that Lower Highs trend-line to engage into a buy extension. In that case, the target would be the 2.0 Fibonacci extension (around 0.2100), as the previous pattern was an Inverted Head and Shoulders (IH&S) which is a formation seen on bullish reversals. In addition, the 1D MACD just formed a Bullish Cross.
--------------------------------------------------------------------------------------------------------
** Please support this idea with your likes and comments, it is the best way to keep it relevant and support me. **
--------------------------------------------------------------------------------------------------------

Request REQ bearish sentimentSeptember has major catalysts for the crypto market as well as for the stock market.
The Ethereum merge on September 6th, that will end on Sept 20, the inflation report on September 13 and the next FOMC meeting afterwards with the new interest rates hike.
That is reflected in the crypto space in general as a bearish outlook.
Request REQ has a negative overall sentiment recently.
I have the following price targets:
REQ/USDT short
Entry Range: $0.09 - 0.11
Price Target 1: $0.075
Price Target 2: $0.068
Price Target 3: $0.59
Stop Loss: $0.0.129

Request REQ - Massive wedge is breaking out! + New bull market
We have a huge falling wedge on the daily chart, and the price is currently breaking out!
As per my Elliott Wave analysis, an ABC correction (ZiagZag 5-3-5) has been completed on the macro scale.
We had a massive uptrend in 2020–2021 and also made a double top (2018, 2021), so this coin is definitely stronger than others.
The first profit target is at a strong resistance (Wave B) + 0.618 FIB, but I think we can reach a new all-time high, maybe next year.
As you can see on the chart, the main trendline has been destroyed by the bulls and the price is printing an inverse head and shoulders pattern!
I expect tremendous pumps for selected altcoins. You can find them in the related section down below.
For more ideas, please hit "Like" and "Follow"!
