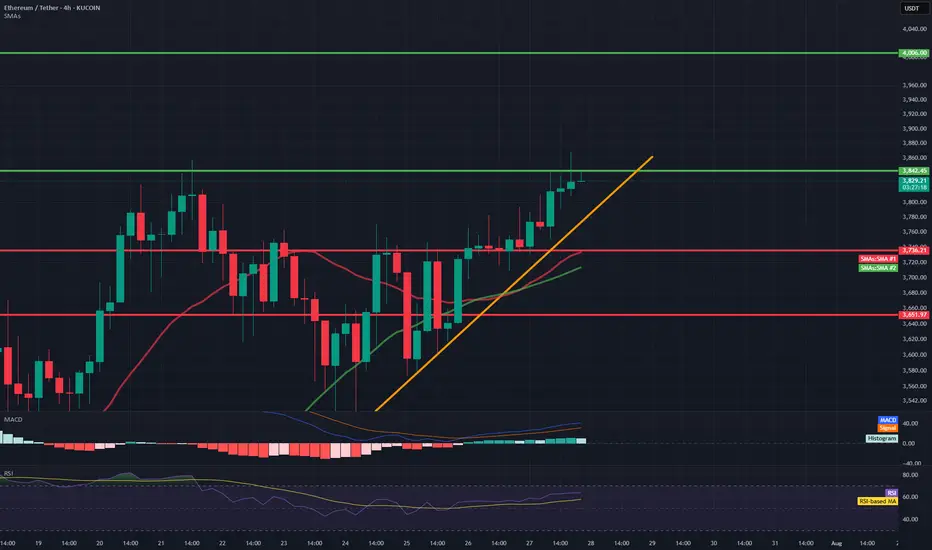
ETH/USDT 4H Chart📊 General Context
Ethereum is rising in a strong short-term uptrend, supported by a rising trendline (orange).
Current price: 3831 USDT
We are approaching a significant resistance level around 3842–3850 USDT (green line).
Technical support is located around 3760 USDT (previous consolidation level and 50/200 SMA).
🔍 Technical Levels
Resistance:
3842–3850 USDT – local high, currently being tested.
4006 USDT – key psychological level and the last local high on the chart.
Support:
3762 USDT – previous resistance, currently turned into support (may be tested in a correction).
3650 USDT – strong technical support, confirmed several times in the past.
SMA50 and SMA200 – currently just below the price, also acting as dynamic support.
📈 Technical Indicators
MACD:
The histogram is rising and positive → bullish momentum.
The MACD line crosses the signal line from below → a buy signal.
RSI (14):
Currently: around 64 → not yet overbought, but close to the overbought zone.
Slightly rising trend, but may suggest impending market overheating with further gains.
🧭 Trend
Short-term: strong uptrend (trend line, green candles, breakout from consolidation).
Medium-term: higher lows and higher highs – the uptrend is maintained.
The price is holding above the 50 and 200 SMAs – confirming bullish sentiment.
⚠️ What to watch next?
A 4-hour candle close above 3842 USDT → confirmation of a breakout, a potential attack on 4000–4010 USDT.
A break of the trend line (orange) → a possible correction to 3760 or even 3650 USDT is possible.
An RSI rise above 70 → an overbought signal, a possible pullback or consolidation.
Resistance_level
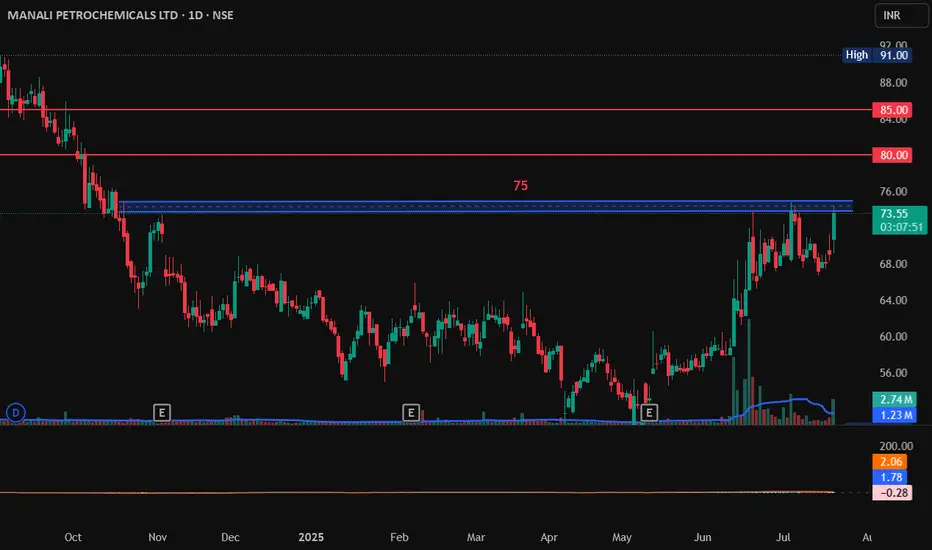
MANALI PETROCHEMICALS LTD, Breakout, LongMANALI PETROCHEMICALS LTD has raised 6% today and its near the resistance zone of 75. If it breaks this 75 and sustain it with Bullish candlestick patterns like Bullish Engulfing, Hammer & Inverted Hammer, Piercing Line, Morning Star, Three White Soldiers, Tweezer Bottoms or Bullish Harami.
Entry on Bullish pattern: 75
Target1: 80
Target2: 85.
SL: 70.
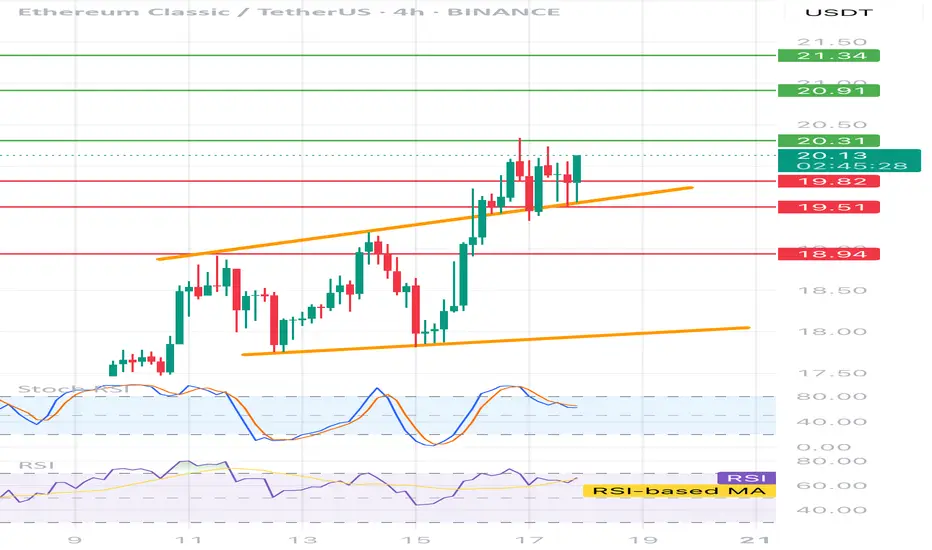
ETCUSDT 4H📊 Price:
Currently around 20.05 USDT
⸻
🔶 Technical formation:
• Ascending channel - clearly marked with two orange trend lines.
• The price is currently testing the upper edge of the channel - it is possible to break or correction.
⸻
📉 Support and resistance:
• ✅ Support:
• 19.73 (local, on the closure of the candles)
• 19.51 (technical, tested several times)
• 18.94 (stronger, historical)
• 🚫 resistance:
• 20.31 - the closest local resistance
• 20.91 - key level
• 21.34 - strong resistance from higher intervals
⸻
🔄 oscillators:
• STOCHASTIC RSI - in the inheritance phase (descent from buying), possible local decline / correction.
• RSI (14) - approx. 60, slightly positive trend, but without exaggeration - no purchase, place for further increases.
📌 Fast strategy:
• 🟢 Long: After breaking and Retescia 20.31 → TP 20.91 / 21.34
• 🔴 Short: after rejection 20.31 or the upper line of the channel → TP 19.73 / 19.51
• 📉 SL: In both cases, it is best 0.3–0.4% above the last high/low
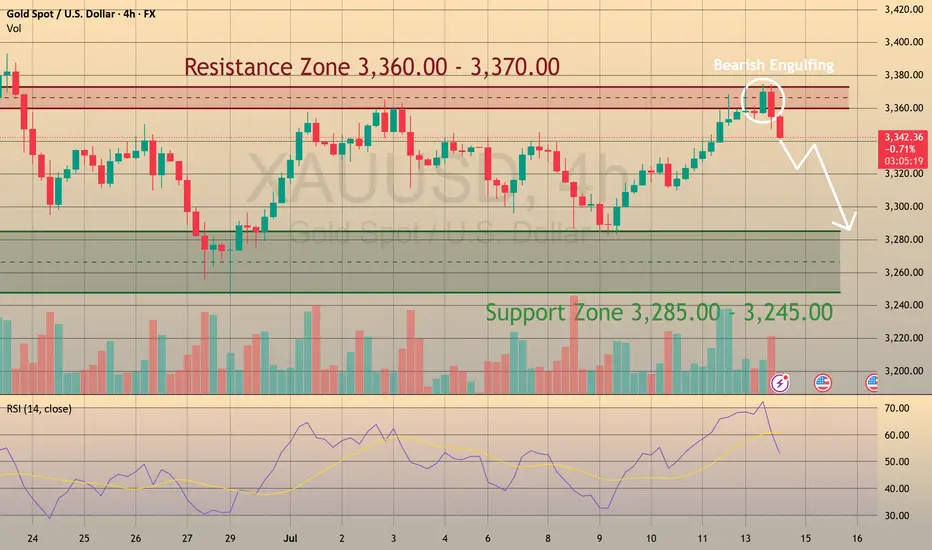
Big Week for Markets: U.S. CPI Tomorrow – What It Means for GoldThis week is packed with news, but the main focus is the U.S. CPI report dropping tomorrow.
🗓 Key Event: U.S. CPI Report
📍 July 15, 2025 | 12:30 p.m. UTC
The CPI report measures inflation and heavily influences the Fed’s rate decisions. Last month’s CPI came in at 2.4% vs. 2.5% expected, following 2.3% vs. 2.4% in April. While it seems inflation is rising, the bigger picture shows stable annual inflation in the 2.3%–3.0% range, keeping things under control—likely the reason Trump is pressuring Powell to cut rates.
Market expects June CPI to be 2.7%.
🤔 Possible Scenarios:
1️⃣ CPI > 2.7%: Bullish for DXY 📈. The stronger the print, the bigger the spike, but I see this scenario as less probable.
2️⃣ CPI < 2.7%: Bearish for DXY 📉. We may see a USD dump, though likely shallow since CPI could still be higher than previous months.
✨ What About Gold?
I don’t expect a major reaction in gold:
✅ Higher CPI? Gold often benefits as an inflation hedge.
✅ Lower CPI? Also supportive for gold as it weighs on the USD.
🔍 Technical Outlook:
Gold has been trading within a triangle since April 22, forming lower highs and higher lows. We may currently be in Wave D (Elliott Wave), aiming toward the triangle’s upper boundary slightly above $3,400 resistance. After that, Wave E may develop – but that’s a story for another post.
SOl on Resistance level. If this area is broken and retested I will buy otherwise will wait to buy the low around 126$

ETH on resistance.Ethereum 2 possible probabilities. 1 shows back demand level around 2100$ the other is a break of 2500$ and retest.

Bitcoin on Resistance levelMy current view. I am sitting mostly in cash waiting for a breakout or fall to buy the dip NFA

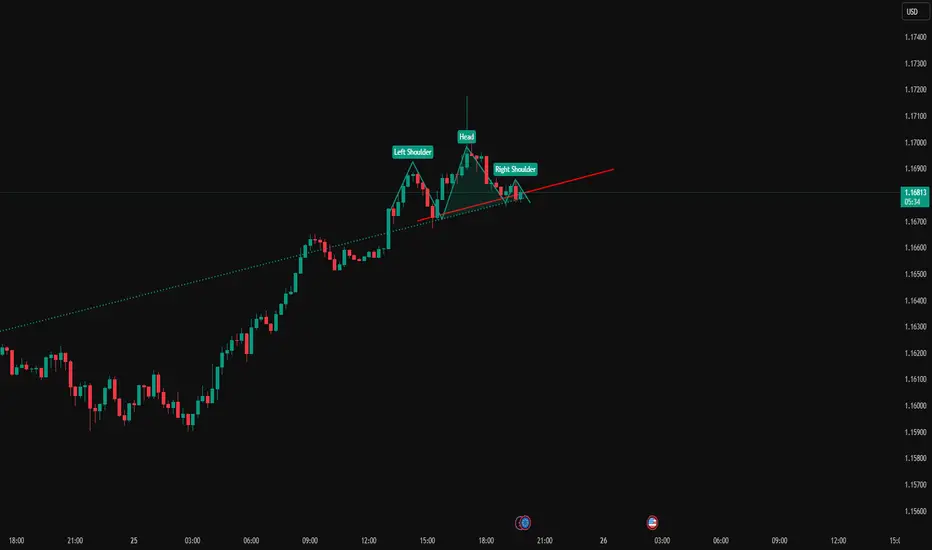
EURUSD Head And ShouldersEURUSD has created a normal head and shoulders pattern while reaching a HTF resistance on the weekly/daily. I expect this pattern to be a catalyst to a bearish movement.
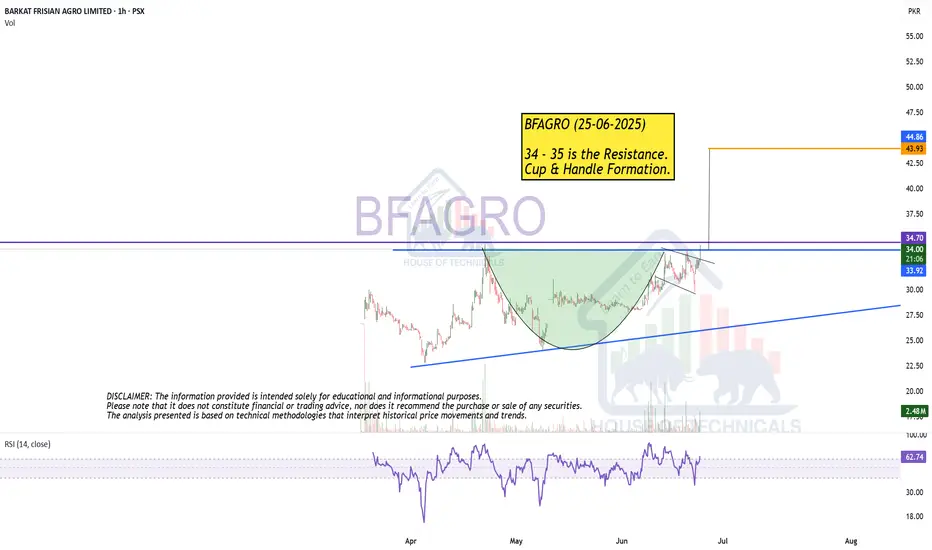
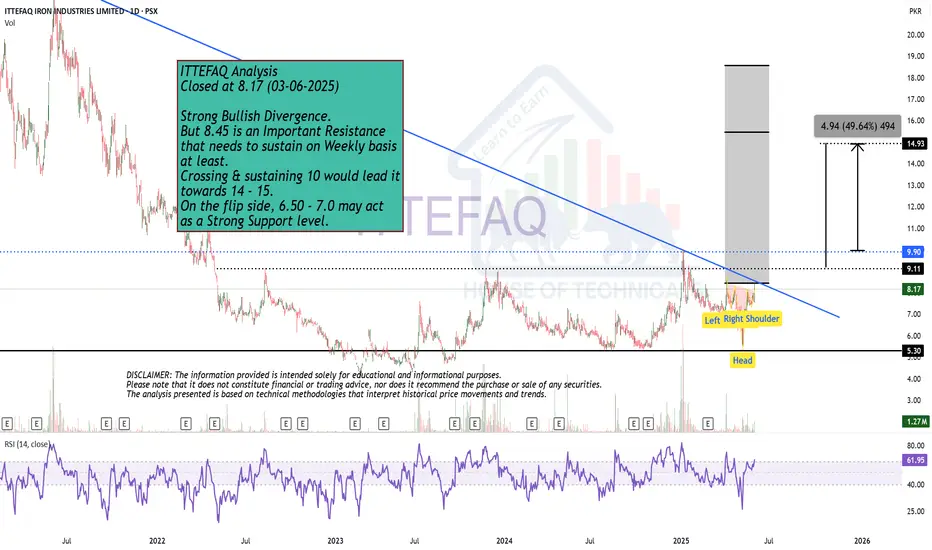
Strong Bullish Divergence. Closed at 8.17 (03-06-2025)
Strong Bullish Divergence.
But 8.45 is an Important Resistance
that needs to sustain on Weekly basis
at least.
Crossing & sustaining 10 would lead it
towards 14 - 15.
On the flip side, 6.50 - 7.0 may act
as a Strong Support level.
MUTHOOT FINANCE at Best Resistance !! This is the Daily Chart of MUTHOOT FINANCE .
MUTHOOTFIN is currently trading near its resistance range around the 2700 range.
MUTHOOTFIN has completed its upward move as per its natural price behavior, with the rise reaching up to the 2700 range.
If This level is sustain , then we may see lower prices in MUTHOOTFIN.
Thank You !!

GBPNZD Important Resistance and SupportThe pair is heading towards the resistance at 2.363, which has not been tested by the sellers, so there are still many sellers waiting in this area. The uptrend could extend to 2.276, the highest peak of last month.
If the resistance at 2.263 cannot be broken, then 2.238 is the sideway border of the pair, which helps support the price increase. When it breaks out, it confirms a reversal to the downtrend.
The price reaction zone can be noted around 2.229 before touching the strong support zone at 2.220.
Support: 2.238, 2.229, 2.220
Resistance: 2.263, 2.276

$Eth Breaks Key Resistance! Is $4100 Coming Next? Ethereum has officially broken above its previous resistance at $2900 and is now aiming for the critical $3000 psychological level. Here's a step-by-step breakdown of what to expect next, including MACD, RSI signals, and CPI data impact.
🔹 Step 1: Breakout Confirmation
Ethereum has successfully broken above the $2900 resistance level — this area is now acting as immediate support.
🔹 Step 2: Next Short-Term Target – $3000
ETH is expected to hit the round number resistance at $3000, which is the next major level to watch. This is the first price target.
🔹 Step 3: MACD & Stochastic RSI Support Bullish Move
MACD is crossing to the bullish side, showing increasing momentum.
Stochastic RSI is also favoring bullish continuation — indicating a likely move to $3000 and beyond.
🔹 Step 4: Possible Rejection Zones
If ETH faces rejection near $3000 or $3500, especially if Bitcoin shows weakness or stalls, expect a pullback.
🔹 Step 5: Target 2 – $4100 if Breakout Continues
If ETH convincingly breaks above $3000 and sustains momentum, $4100 becomes the next major target. This level aligns with the previous high and potential macro continuation.
🔹 Step 6: Watch CPI Data Impact
A positive CPI reading will strengthen bullish sentiment and help ETH push toward $4100.
A negative CPI surprise might trigger a reversal — but even in that case, a short-term hit of $3000 remains likely.
Key Levels to Watch:
Support: $2900, $2800
Resistance: $3000 (Target 1), $3500 (Interim), $4100 (Target 2)
Ethereum's price structure looks bullish above $2900, supported by technical indicators and macro optimism. The $3000 level is within reach, and if momentum continues, $4100 is the next upside target. Keep an eye on BTC behavior and CPI release for confirmation or reversal signals.

MICROSOFT - Simple Analysis WIN ! Its Bearish Ahead ! MAGIC Microsoft - Lets explore the magic of Technical Analysis / Price action.
Microsoft is currently testing the daily resistance level and it will be more matured once the bearish candle / rejection candle is formed. We see a bearish divergence at this level which is a strong confluence for the bearish trend a head.
forgot to mention, a perfect bookish - Bearish Crab pattern is forming, which is a forming a Potential Reversal Zone (PRZ).
we expect our entry after confirmation on the break of HL - 447 level and then we can plan our TPs accordingly.
Please like and comment!

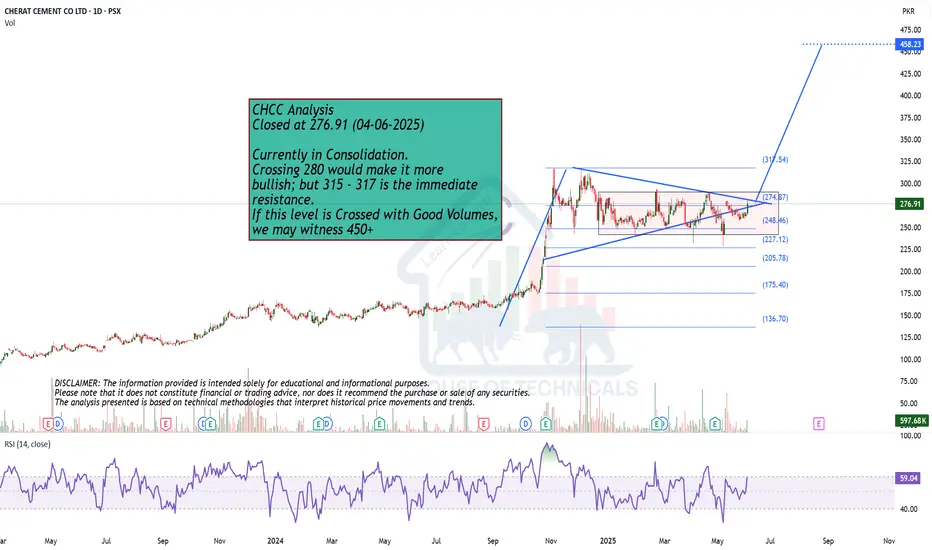
Currently in Consolidation.
Closed at 276.91 (04-06-2025)
Currently in Consolidation.
Crossing 280 would make it more
bullish; but 315 - 317 is the immediate
resistance.
If this level is Crossed with Good Volumes,
we may witness 450+
Making HH HL.
Closed at 40.45 (04-06-2025)
Making HH HL.
Bearish Divergence played well &
dragged the price from 44 - 45 to around 33.
Printed HL & started moving upside.
If 45 is Crossed & Sustained, we may witness
new Highs around 55 - 57.
However this time, Stoploss should be 33.50
on Closing basis.

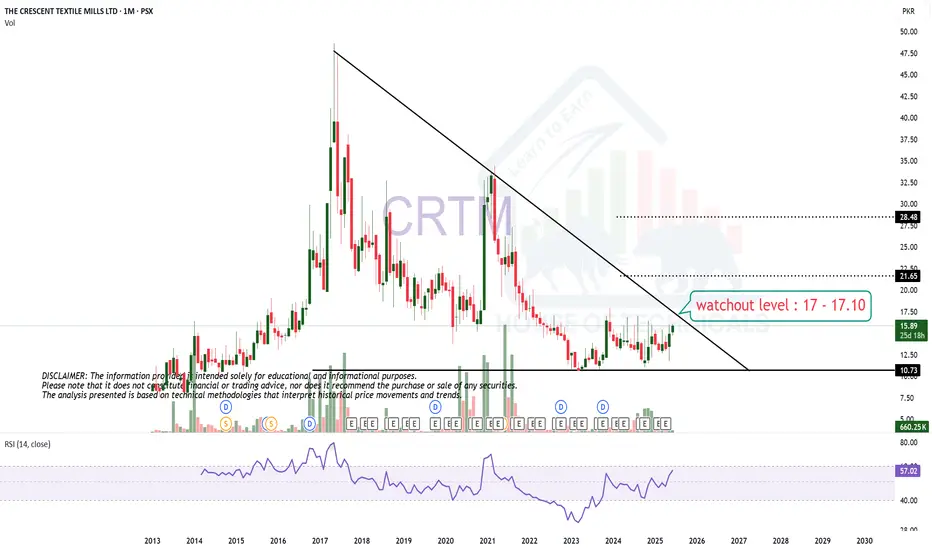
Watchout LevelWatch out level for CRTM is around 17 - 17.10 which is actually a Strong Resistance point.
Crossing & Sustaining this level will lead it towards 21 initially.
$Btc Bearish Flat Pattern Forming?Bitcoin Bearish Flat Pattern Forming? Potential Short Setup to $97K-$98K if Rejected at $106K
📉 BTC recently hit a new all-time high around $112K, followed by a series of higher lows near $110K, $108K, and potentially $106K. If price gets rejected at $106K, a bearish flat pattern may play out—triggering a high-probability short opportunity toward the $97K–$98K support zone. However, a clean breakout above $107K will invalidate this setup.

Higher High Higher Low intact!BFBIO Closed at 185.09 (25-05-2025)
Important to Cross & Sustain 188 - 189
o Monthly basis; only then it may move towards
215+
On the flip side, Important Support seems to be
around 164 - 169 and then 156 - 157

Bullish on bigger tf but Strong Resistance ahead.
Bullish on bigger tf.
Strong Resistance around 128 - 129
If this Resistance is Crossed & Sustained
on monthly basis, we may witness upside
towards 200+

Wait for the Resistance to Cross!hidden Bullish divergence.
but there is a bearish div. so wait for the resistance to break first.

Wed 7th May 2025 XAU/USD Daily Forex Chart Buy SetupGood morning fellow traders. On my Daily Forex charts using the High Probability & Divergence trading methods from my books, I have identified a new trade setup this morning. As usual, you can read my notes on the chart for my thoughts on this setup. The trade being a XAU/USD Buy. Enjoy the day all. Cheers. Jim
Note: This isn’t a great setup as price is already at the previous high and the MACD is just below the zero level. But I had to take it because I am committed to my MSH (multi sequence hedging) strategy. So if you are a traditional type trader, then standing aside on this trade would probably be the smart thing to do.

Bitcoin is Showing a New Trend!!!Hey Traders, in today's trading session we are monitoring BTC/USDT for a selling opportunity around 95k, Bitcoin is trading in a downtrend and currently is in a correction phase in which it is approaching the trend at 95k support and resistance area.
Trade safe, Joe.
