PFE 1H T2 level Upthrust in 1/2 correction and resistance levelDaily chart formation
Trend trade 3IBK
+ short balance
+ resistance level
- expanding CREEK
+ volumed 2 Ut
- month support level
Hourly chart:
Conservative trend trade 3IBK
+ short impulse
+ 1/2 correction
+ resistance zone
+ T2 level
+ volumed 2Ut
Resistance_level

MA 1H trend trade break under ice bar volumed testDay chart conditions:
Trend trade 1IBK
+ short balance
+ CREEK level
+ resistance level
+ 1/2 correction
Hourly chart:
Conservative trend trade 1IBK
+ short impulse
+ 1/2 correction
+ resistance level
+ BUI test
+ volumed 2Ut
+ better price level entry
Calculated affordable stop
1 to 4 target

Short Doge !The Price going to resistance in 23.60% level becaue the rsi in oversold range (If the price Break The Resistance thats Good time to join 1:3 RR )

BTC WEEKLY UPDATE.Hello everyone,
Please, support my work with like,
and drop your suggestions in the comment section.
Thank you

GOLD: Rise of Gold and collapse of US$OANDA:XAUUSD
There is no doubt that Gold is safe heaven for buy
But in few day's gold have went abnormally high , which quit uncertain movement
Just to cool down price action , Gold can hit resistance at 2033 and will be back to 2010 mark
Long term gold will remain bullish , for a short term Pull back or correction is inevitable
❤️ Please, support my work with follow ,share and like, thank you! ❤️

It's NOT Perfect, but would you say NO to 309pips of Profits? It's NOT Perfect, but would you say NO to 309pips of Profit Potential?
The Bearish 5-0 Patterns has completed on the Daily Chart(right), the doji candle looks great for aggressive trader for a shorting opportunity, the RSI didn't went overbought, and that cause this setup to be not as perfect as we want it to be.
Alternative ways to engage the trade, is to wait for the market to retest at 83.60 on the 4-hourly chart or the 1-hourly chart. When the retest happens, it will produce an RSI Divergence that allow us to engage the trade, that produce a Lower Risk with a Higher Returns.
If you are looking for a buying opportunity, 82.60 is the level you can wait for a retest of support or a double bottom with RSi Divergence.
Which side of the trade would you choose?
Shorting opportunity or Longing opportunity?


Single Target - Intraday Little Short SetupBINANCE:EOSUSDT
It is a trial.
If it will not break the line probably we will reach the break retest target.
It is not that big thing I know but it is worth to try.
May the force be with you.

AUDJPY H4Hello traders, AUDJPY is setting up for a downside move watch AUDJPY in a yellow box mentioned area with according to your strategy and look for a short position opportunity.
i am looking price action in a mentioned yellow box area for a sell setup trade if my trading condition or strategy allow me to trade it but if price break the yellow box upside then i will be looking for a sell setup opportunity around white box previous support become resistance area, this is my view and analysis about this pair AUDJPY.
This is just analysis, not the exact trade or any kind of signal that proven with wining or losing % so be sure trade with your own according strategy do not depend on my analysis, this analysis is just a scenario and i would love to be wrong because i will learned from it and come back stronger.
I wish you good luck and good trading.

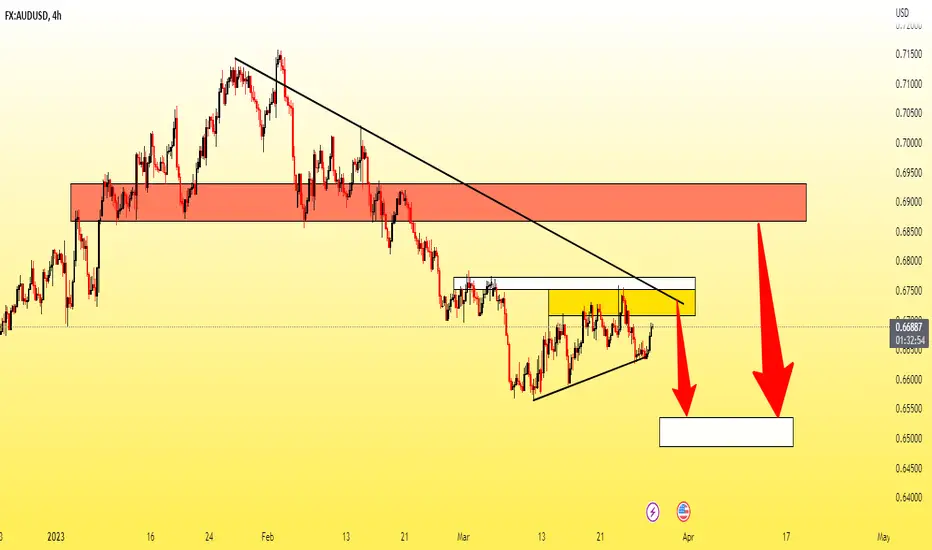
AUDUSD H4Hello traders, AUDUSD is setting up for a downside move, i am waiting for price to enter in a yellow box mentioned area and looking price action there for a short position opportunity but if things doesn't go that i wanted and price break the previous lower high then i will be watching the red box resistance area for a next short opportunity.
This is just analysis, not a proven trading system that would work a 100%
maybe 100% work in something but in trading this sounds like unusual.
i wish you good luck and good trading.

TSLA might break the $200 resistance,(once again!) today!There seems to be an ascending triangle formation with a resistance level around $200.
Pay attention to the down trend. My stop loss is at $185.
Should we break the $200 we should see an uptrend up to the next resistance level $210-$212. I'm leaving m short position when we reach $209.
Happy trading!

EUR/USD - Bearish PennantA bearish pennant is forming at 15min time frame after we saw EUR/USD drop yesterday nearly 1% after rallying to the 1.09000 resistance level, Can it go back to below 1.06000 where it was a week ago and then eventually reaching the support level near 1.05500 - 1.05000.

Resistance Analysis in Bottoming Stocks: IDXX, OKTAResistance Analysis in Bottoming Stocks: Looking Ahead to Q1 2023 Earnings
Stocks that are slowly crawling their way out of the correction of 2022 are now moving up to challenge the more difficult resistance levels from the intermediate-term downtrend. These resistance levels are sideways trends that developed during the downtrend of 2022 to the bottom low.
Most stocks that are showing improvement quarter over quarter have completed bottoms, such as IDXX.
Those that do not, such as OKTA, are often stocks that had anomalies in their revenue/earnings growth during the pandemic due to stimulus checks artificially inflating their sales to the point there was no possible way that the company could maintain such high revenues that were way off the normal growth levels annually.
IDXX has been trending up out of a bottom with sideways trends 2 times now. This is best seen on a weekly or 4 day chart. The stock has not reached the next strong resistance level yet but is probably going there during the next month as it reports in early May. If it continues sideways during the month of April, then the report is not likely to show a significant improvement over the financial data from last quarter.
The All-Time High will be Very Strong Resistance as it occurred at the peak of the pandemic's speculative gains.
The Moderate Resistance is one tier down from the top's all-time high. It can be more easily overcome as it is not a longer sideways trend and there was no sideways trend at that level on the way up to the top in the final months of 2021.
The Strong Resistance lowest red line is stronger because of the sideways trend from 2020 - 2021 and the sideways trend during the 2022 downtrend.
OKTA has an entirely different trend moving upward. The stock has not completed the bottom and first resistance level to complete the bottom is Very Strong Resistance. The next tier up is Moderate Resistance. The next Very Strong Resistance is the rounding top highs of 2021.

FED Interest Rates and it's mechanism BINANCE:BTCUSDT
In the United States, the federal funds rate is the interest rate at which depository institutions (banks and credit unions) lend reserve balances to other depository institutions overnight on an uncollateralized basis. Reserve balances are amounts held at the Federal Reserve to maintain depository institutions' reserve requirements. Institutions with surplus balances in their accounts lend those balances to institutions in need of larger balances. The federal funds rate is an important benchmark in financial markets.
The effective federal funds rate (EFFR) is calculated as the effective median interest rate of overnight federal funds transactions during the previous business day. It is published daily by the Federal Reserve Bank of New York.
The federal funds target range is determined by a meeting of the members of the Federal Open Market Committee (FOMC) which normally occurs eight times a year about seven weeks apart. The committee may also hold additional meetings and implement target rate changes outside of its normal schedule.
The Federal Reserve uses open market operations to bring the effective rate into the target range. The target range is chosen in part to influence the money supply in the U.S. economy
Financial institutions are obligated by law to hold liquid assets that can be used to cover sustained net cash outflows. Among these assets are the deposits that the institutions maintain, directly or indirectly, with a Federal Reserve Bank. An institution that is below its required liquidity can address this temporarily by borrowing from institutions that have Federal Reserve deposits in excess of the requirement. The interest rate that a borrowing bank pays to a lending bank to borrow the funds is negotiated between the two banks, and the weighted average of this rate across all such transactions is the effective federal funds rate.
The Federal Open Market Committee regularly sets a target range for the federal funds rate according to its policy goals and the economic conditions of the United States. It directs the Federal Reserve Banks to influence the rate toward that range with open market operations or adjustments to their own deposit interest rates. Although this is commonly referred to as "setting interest rates," the effect is not immediate and depends on the banks' response to money market conditions. Separately, the Federal Reserve lends directly to institutions through its discount window, at a rate that is usually higher than the federal funds rate.
Future contracts in the federal funds rate trade on the Chicago Board of Trade (CBOT), and the financial press refer to these contracts when estimating the probabilities of upcoming FOMC actions.
When the FOMC wishes to reduce interest rates they will increase the supply of money by buying government securities. When additional supply is added and everything else remains constant, the price of borrowed funds – the federal funds rate – falls. Conversely, when the Committee wishes to increase the federal funds rate, they will instruct the Desk Manager to sell government securities, thereby taking the money they earn on the proceeds of those sales out of circulation and reducing the money supply. When supply is taken away and everything else remains constant, the interest rate will normally rise.
The Federal Reserve has responded to a potential slow-down by lowering the target federal funds rate during recessions and other periods of lower growth. In fact, the Committee's lowering has recently predated recessions, in order to stimulate the economy and cushion the fall. Reducing the federal funds rate makes money cheaper, allowing an influx of credit into the economy through all types of loans.

US30 Headed upwards? 21.03.2023 US30 Just broke important resistance levels and it might be headed
towards new levels at 32640.
The Stock market has been extremely volatile recently and the indices show upward moves in general.
__________________________
Information Regarding Important News and Figures can be found here in our Economic Calendar: mau.bdswiss.com/economic-calenda...
Risk Warning: Trading in CFDs is highly speculative and carries a high level of risk. It is possible to lose all of your invested capital. These products may not be suitable for everyone, and you should ensure that you fully understand the risks taking into consideration your investment objectives, level of experience, personal circumstances as well as personal resources. Speculate only with funds that you can afford to lose. Seek independent advice if necessary. Please refer to our Risk Disclosure.
BDSwiss is a trading name of BDS Markets and BDS Ltd.
BDS Markets is a company incorporated under the laws of the Republic of Mauritius and is authorized and regulated by the Financial Services Commission of Mauritius ( FSC ) under license number C116016172, address: 6th Floor, Tower 1, Nexteracom Building 72201 Ebene.
BDS Ltd is authorized and regulated by the Financial Services Authority Seychelles (FSA) under license number SD047, address: Tenancy 10, Marina House, Eden Island, Mahe. Payment transactions are managed by BDS Markets (Registration number: 143350).

EURUSD Consolidation End? 21.03.2023The EURUSD has been in range for some time now.
Low volatility during the morning session might be a good indicator of high volatility during the day.
The next estimated resistance level is 1.0745 in case the market breaks the range resistance 1.730.
The next estimated support level is 1.07035 in case the market breaks the range support 1.069.
__________________________
Information Regarding Important News and Figures can be found here in our Economic Calendar: mau.bdswiss.com/economic-calenda...
Risk Warning: Trading in CFDs is highly speculative and carries a high level of risk. It is possible to lose all of your invested capital. These products may not be suitable for everyone, and you should ensure that you fully understand the risks taking into consideration your investment objectives, level of experience, personal circumstances as well as personal resources. Speculate only with funds that you can afford to lose. Seek independent advice if necessary. Please refer to our Risk Disclosure.
BDSwiss is a trading name of BDS Markets and BDS Ltd.
BDS Markets is a company incorporated under the laws of the Republic of Mauritius and is authorized and regulated by the Financial Services Commission of Mauritius ( FSC ) under license number C116016172, address: 6th Floor, Tower 1, Nexteracom Building 72201 Ebene.
BDS Ltd is authorized and regulated by the Financial Services Authority Seychelles (FSA) under license number SD047, address: Tenancy 10, Marina House, Eden Island, Mahe. Payment transactions are managed by BDS Markets (Registration number: 143350).

Ethereum -> More Bullish MovesHello Traders,
welcome to this free and educational multi-timeframe technical analysis .
On the weekly timeframe you can see that Ethereum is currently breaking above a quite obvious previous weekly resistance area which is exactly at $1700.
You can also see that we are approaching the next resistance at $1900, so I do expect a short term rejection towards the downside to retest the previous $1700 resistance, now turned support, and then from there I think we will see the next impulse towards the upside.
On the daily timeframe you can also see that everything looks extremely bullish, I am now just waiting for a retest of the $1700 support and some bullish confirmation before I think we will see the next rally towards the upside.
Thank you for watching and I will see you tomorrow!
You can also check out my previous analysis of this asset:


Silver will move! Are you ready?Good morning fellow traders
With recent bank failures, precious metals have a strong backing in demand, therefore looking for a long swing position makes more than just sense. As Gold is pushing for its 3rd weekly advance, silver has been consolidating firmly around 22 USD. We saw some rejections, one happening yesterday with the rate hikes being priced in by the ECB, yet we still are holding the consolidation. This gives me confirmation that 1. we have resistance at 22 and 2. with pretty erratic bounce-offs, Silver has been recovering every time. Therefore I will be looking for an entry on Silver today, hopefully positioning myself for a Swingg trade on the white metal.
Please join me on my trade! Here is my game plan:
- Gold needs to trade in the same direction as Silver (I am already long Gold)
- Silver needs a clear break above 22 but not pushing up further than 20.30
- We should get a clear move here, yet it should not be a big move
- Silver needs to bounce off 22.2 area and retreat to 22
- 22 needs to be held, not much slippage under 22 allowed
- Entry upon reclaim of 22
- Target1: 22.60
- Target2: 23
- Stoploss: 21.6 area
Smooth execution on this trade could allow you to find an entry swing position that could allow you to get great profits. Be sure that you understand the idea before executing, if you have any questions, please do not hesitate to leave a comment or text me directly.
Make sure to leave a follow and like if you enjoy my content!
Have a good one legends!
Best
CH


HOW TO TRADE FIBONACCI RETRACEMENTS: THE SHORT GUIDEHey there, traders. One of the common tools we use for technical analysis are Fib retracements and a lot of you been asking on how to use them properly. Well, today is your lucky day :)
Fibonacci Retracement is a technical analysis tool that is widely used by traders to identify potential levels of support and resistance in financial markets, including forex markets. The tool is based on the mathematical sequence known as the Fibonacci sequence, which is a series of numbers in which each number is the sum of the two preceding ones. The Fibonacci Retracement levels of 0.5 and 0.618 are two of the most important levels used in this tool. In this article, we will discuss how to use these levels for trading forex markets.
Understanding Fibonacci Retracement Levels
Before we dive into the specifics of using the 0.5 and 0.618 levels, let's briefly review the concept of Fibonacci Retracement. The tool is based on the idea that markets tend to retrace a predictable portion of a move, after which they may continue in the same direction or reverse. The retracement levels are calculated using the Fibonacci sequence, and they represent potential levels of support or resistance. The key levels are 0.236, 0.382, 0.5, 0.618, and 0.786.
Using 0.5 and 0.618 Levels for Trading Forex Markets
The 0.5 and 0.618 levels are particularly important because they are close to the midpoint of a move, and they are based on the golden ratio, which is a key number in mathematics and nature. The 0.5 level represents a 50% retracement of a move, while the 0.618 level represents a 61.8% retracement.
To use these levels for trading forex markets, you can follow these steps:
Step 1: Identify a Trend
The first step is to identify a trend in the market. You can do this by analyzing the price action on a chart and looking for a series of higher highs and higher lows in an uptrend, or lower highs and lower lows in a downtrend.
Step 2: Draw Fibonacci Retracement Levels
Once you have identified a trend, you can draw the Fibonacci Retracement levels using a tool provided by your trading platform. You will need to identify the high and low points of the trend, and then draw the retracement levels from the high to the low in an uptrend, or from the low to the high in a downtrend.
Step 3: Watch for Reversals at 0.5 and 0.618 Levels
The 0.5 and 0.618 levels are potential levels of support or resistance, and they can act as turning points in a trend. If the price retraces to one of these levels, you should watch for signs of a reversal, such as a bullish or bearish candlestick pattern, or a divergence in an oscillator indicator or any other personal confirmation for potential entry.
Step 4: Confirm with Other Indicators
To increase the probability of a successful trade, you should confirm the potential reversal with other technical indicators, such as a moving average, a trendline, or a momentum indicator, check with the fundamentals and most importantly confirm that it aligns with your original bias regarding the pair. This will help you to avoid false signals and improve your trading accuracy.
Step 5: Enter the Trade and Set Stop Loss and Take Profit Levels
Since the entry was at the "Golden zone", the exit would be around the 0% Fib level. Yes, you just missed half of the trend, but it's a consistent tool that can help you get that edge over the market that you need.
We hope you found this useful and please let us know on what you would want us to cover next!

