Dow futures drop below Cosmic Gravity resistanceE-mini Dow Jones futures price fell below Cosmic Gravity "Resistance Channel" (😎) while "Basis Line" turned pink, indicating a possible bearish reversal. Another market correction may happen if price fails to break above "Resistance Channel".
Resistance_level

Gold is going down againThe correlation between GOLD and USDX now is ready to react to the extremely positive NFP data today, check the related idea for more info

XAUUSD trading block short So the indicator created, which is in Beta, essentially detects trading blocks that act as areas of buying or selling with considerable amounts of accumulated volume.
Overall trend is short but because of the bullish block a may be a little more cautious before trading. A+ setups only

ETH Reach important resistanceHello friends.
after 1 week Rally , Etherum Reach its important resistance level , Near 1700.
i see a reaction to Trendline , pink line i drawn on the chart.
also MA200 is here too...
so i think ETH will fall to at least 1450 , where there are 1450 support level
and 50% fibonacci retracement level.
if the situation is permanent , Price will bounce from this level approch 1700 again.
hope have good investments and trades.
dont forget to have a Stoploss and control your risks.
GOOD LUCK.

BTC Scalping AnalysisHello guys.
i think i saw a good bullish divergence in RSI and price in 4H time frame.
What do you think about that?
is this a pullback to 20000 level??
Share me your opinion
thanks

Gold Pullback potentialHi friends.
Unfortunately we have bad times in iran and im so sorry about that.
i couldnt post any analysis for 2 weeks and i hope you accept my excuse.
God bless all IRANs people.
As you can see i think we have a strong Resistance level approch.
and also a valid trend line.
this Resistance level overlap with trend line and after going up to around 1680
the price will react and make a pullback.
wait for price to pullback compeletely and after you receive confirmation
(mostly bearish candlestick patterns) , you can go SHORT.
and in addition we saw the 55MA crosses 100MA and 100MA crosses 200MA
and this is a death cross.
thank you all.
PRAY FOR US WE HAVE VERY VERY BAD TIMES IN IRAN.

AspenJSE:APN has been consolidating since June, the stock is now at an area of value, at a potential resistance level. Waiting to see if it can break above, it'll be interesting above R165/share.

A number of GBP pairs at key weekly resistance... A possible stall area of the recent upside. Maybe even some GBP selling...


BTC USD long opportunity 29/10dear investor our anaysis today on 1 hour chart we found opportunity for long position if the price break the hirozantel line and break this important rsistance then it give us very clear confirmation for moving up , also this confiramtion depend on ou strategy ( RT MAAX ema cross strategy ) you see the strategy already guve us long postion opportunity depend on :the price moving up 200 ema and we find crossover between 20 , 50 ema and the price moving up all of htem ,,
and depend on adx indicator you see on the chart it give us a long signal ,,
so we hope our idea it clear and we hope all the best for our investor with profitable trade
thanks


$TSLA's TA - The Path for the Last Mile's Rally.Price action wise, Tesla seems to be running out of steam.
June's pump was likely for Elon's sale for $TWTR's purchase.
There is nothing much literally left for the bulls, save for a last small buyback and purchase.
i) Fibonacci .382,
ii) 200 hourly ema &
iii) 234 resistance line
might prove as short term resistances.

HDFC BANK*At 15 min timeframe, price is at support of 200 - EMA.
HDFC will also open near 1460(whole number) and Volume profile is also strong on this price.
If price open AT 1460 then first resistance rectangle(1465-1468) and may give sharp fall till 1444.
We can take new entry from this level(1444) to day's high OR may be it break this level(1465-1468) create a support zone and give the target of 1475 and then of 1486.
Profit:-
1. From 1465 to 1486 is 1.30%.
2. From 1444 to 1453/1465 is .05% or 1.48%.
3. From 1444 to 1435 is .07%.
NSE:HDFCBANK
NOTE:- Take help from volume.

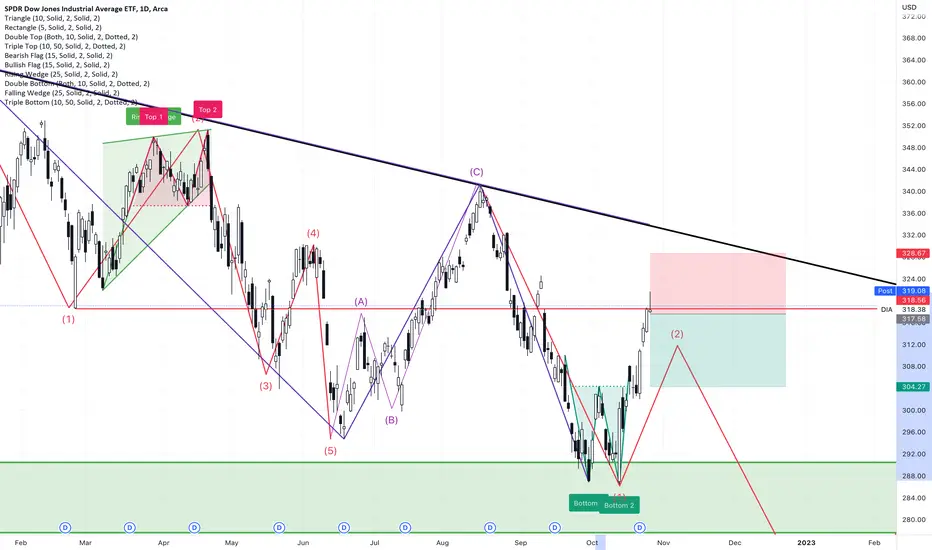
DIA daily bearish hammer at resistance and double bottom targetOrder SELL DIA ARCA Stop 317.58 LMT 317.58 will be automatically canceled at 20230401 01:00:00 EST
DIA daily bearish hammer at resistance and double bottom target expect retest of the neck at least.

GBPCAD...30 min bullish view..Converted resistance to support with fibo 0.23 level may be strong point to use it to complete the up move and end of pullback to take long trade with good R/R ratio after formation of bullish engulfing candle as a sign to be in...be safe...

MARA: Targeting 14.50 (RED)While prices have failed to gain momentum higher in recent attempts to stay above $12 (ORANGE), this time appears to be different. I'd be looking for prices to track higher towards 14.50 (RED). Aspen S/R's in action.

LUNA CLASSIC The values I mentioned are the main support and resistance levels. the important point here is the 0.0006 level and the 0.00018 level. can be considered as short and close targets. It is not investment advice at all.

USDCHF ready to shortWe can see USDCHF has hit the daily resistance area and is ready to make a break to the short side.
Selling to around .97 and then watch from there.

Thu 20th October 2022 EUR/NZD Daily Forex Chart Sell SetupGood morning fellow traders. On my Daily Forex charts using the High Probability & Divergence trading methods from my books, I have identified a new trade setup this morning. As usual, you can read my notes on the chart for my thoughts on this setup. The trade being a EUR/NZD Sell. Enjoy the day all. Cheers. Jim

TGT weekly bearish hammer in resistance selling zoneSell Stop 144.66 LMT 144.66 GTC
Buy Limit 123.64 GTC
Buy Stop 162.07 GTC
TGT weekly bearish hammer in resistance selling zone if we clear this hammer from below can run into next support 1.2R

SPX500 LONG (3 DRIVE PATTERN TO IMBALANCEPrice is forming a three-drive pattern into the Imbalance where it will clear Buyside liquidity. Waiting to see retracement to internal liquidity imbalance @ 3667 then potential impulse up during new york. your coments will be very much appreciated

UTHR daily bearish hammer in selling resistance zoneOrder SELL UTHR NASDAQ.NMS Stop 209.45 LMT 209.45 will be automatically canceled at 20230401 01:00:00 EST
UTHR daily bearish hammer in selling resistance zone
