STOVE KRAFT, AGAIN TOUCHED THE TREND LINEi am waiting for a breakout by stove kraft, but it touched its major downtrend line, and now its gainig momentum(since, there are larger bars in the volume).
by the way, if you look the trend line from its IPO time(drawn in larger black line), the stock is sitting at the least point(support line), so if you are waiting for a breakout or not, you can still buy the stock, and earn till it reached its resistance line.
Resistance_level

Thur 15th September 2022 GBP/JPY Daily Forex Chart Sell SetupGood morning fellow traders. On my Daily Forex charts using the High Probability & Divergence trading methods from my books, I have identified a new trade setup this morning. As usual, you can read my notes on the chart for my thoughts on this setup. The trade being a GBP/JPY Sell. Enjoy the day all. Cheers. Jim

"W" Pattern breakout and Resistance break out Canara bank guve a very good breakout out of important resistance now we recommend to everyone to buy it .
Buy Canara bank at 252
Target 262 273 299.80
Sl 238

EURCHF:BEARISH POSITIONS BELLOW 0.9786OANDA:EURCHF
Hello folks, this is my analysis brought to you after deeply analyzing the EUR/CHF Forex pair from a technical and fundamental perspective:
Pivot point: 0.9786
Stop loss :0.9822
Take profit: 0.9604
Current price at the moment of generating this post: 0.9742
Risk/Reward Ratio : 1.84
If this post was useful to you, do not forget to like and comment.❤️
Trade Safely,
Best Regards,
Yasser Tavarez

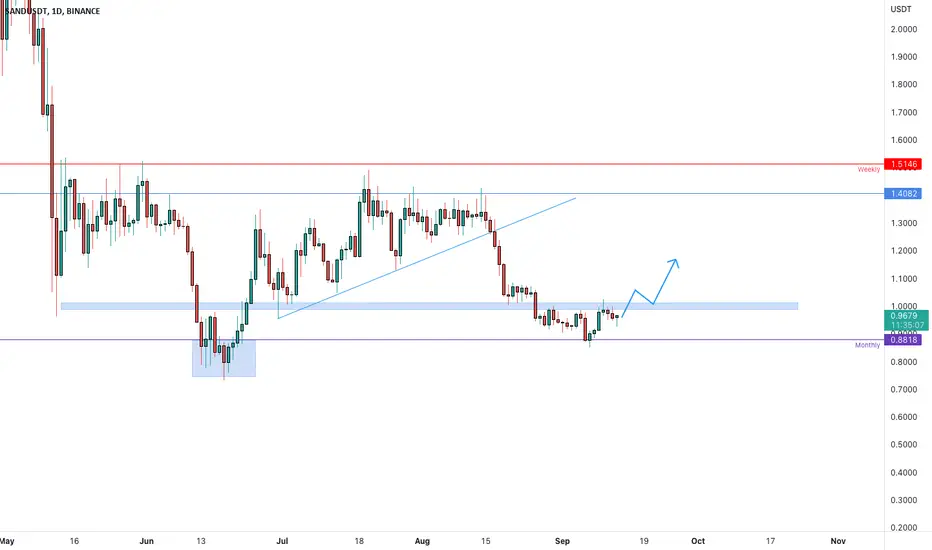
SANDUSDT is testing the resistanceThe price had a breakout from the dynamic support after a retest of the weekly resistance and daily resistance on the 1.4-1.5$ area.The price comes back on the monthly support area on 0.88$ where the previous impulse started
How to approach it?
IF the price is going to have a breakout from the daily resistance (1$) and retest it as new support, According to Plancton's strategy , we can set a nice order
–––––
Keep in mind.
🟣 Purple structure -> Monthly structure.
🔴 Red structure -> Weekly structure.
🔵 Blue structure -> Daily structure.
🟡 Yellow structure -> 4h structure.
–––––
Follow the Shrimp 🦐
GMT to CRASH* ETH to overshine SOL
- GMT built on SOL
* War and electricity problems will discourage investors and users
SOL uses PoH which is more ineffiecent than PoS
GMT reminds of a future type sports/IT app. However, in these circumstances its the last investment to be made.

ORACLE finally pushed back from the support lineTarget horizon: 1-2 months
Target: $84
Stop order: $72
Technical analysis
The share price has pushed away from the local support line. Idea for the growth of the paper with a target of $84. The profit/risk ratio is 3.00.
Fundamental factor.
Oracle is a U.S. corporation, the second-largest software producer by revenue, the largest producer of software for organizations, and a major provider of server hardware. The company will report financial results for the first quarter of fiscal year 2023 today, Sept. 12. Analysts expect revenue of $11.33 billion and earnings per share of $1.08. If the report beats analysts' exp ectations and the company's management gives a good outlook, the market could put that positive value on the company.

BTC OPEN YOUR EYES !!!!!! looook againbtc can move to 11000 12000
if btc can break the channel open long
i think we going down becarefull

EURCAD: BEARISH POSITIONS BELLOW 1.3138 (Updated)
THIS IS AN UPDATE FROM PREVIOUS ANALYSIS SINCE STOP LOSS WAS NOT PLACE ACCORDINGLY TO THE ACTAL ANALYSIS ON THE PREVIOUS ONE FX:EURCAD
Hello folks!!!,
This is my analysis brought to you after deeply analyzing the EUR/CAD Forex pair from a technical, trend and fundamental perspective:
Pivot point : 1.3138
Stop loss : 1.3200 (Updated)
Take profit : 1.2914
Entry Price : 1.3113 (Updated)
Risk/Reward Ratio : 1 : 3.2
If this post was useful to you, do not forget to like and comment.❤️
Trade Safely,
Best Regards,
Yasser Tavarez

Mon 12th September 2022 USD/CAD Daily Forex Chart Sell SetupGood morning fellow traders. On my Daily Forex charts using the High Probability & Divergence trading methods from my books, I have identified a new trade setup this morning. As usual, you can read my notes on the chart for my thoughts on this setup. The trade being a USD/CAD Sell. Enjoy the day all. Cheers. Jim

TATA STEEL 1DTata steel is near the resistance zone and could possibly make a move to the downside within few weeks. This could be an opportunity to sell Tata steel

Boeing Company continues to grow and no trend change is expectedHorizon: 1 month
Target: $190
Potential of the idea: 20.41%
Entry volume: 10%
Stop order: $148
Technical analysis
The upward trend continues, the entry on the correction is relevant. With the volume of the position of 10% and placing a stop order at $148, the risk on the portfolio will be 0.62%. The profit/risk ratio is 3.29.
Fundamental factor
The Boeing Company is the world's leading aerospace corporation and the largest manufacturer of passenger aircraft. Q2 2022 reports showed that the company has been able to significantly reduce losses. Going forward, a return to profit generation could serve as a driver of the company's value growth.

DOCU is very likely to break the upper edge of the triangleHorizon: 2-3 weeks
Target: $90
Stop order: $50
Technical analysis
The paper came to a strong support level. It is worth opening a position from the current level at 5% of the portfolio.
Fundamental Factor.
DocuSign, Inc. - an American company headquartered in San Francisco, California. The company offers organizations solutions for managing electronic agreements with an e-signature service. DocuSign will release a financial report Thursday, Sept. 8, after the market closes. Analysts expect revenue to rise to $602.219 million and earnings per share to $0.424. If the report beats analysts' expectations and the company's management gives a good outlook, the market could put this positive value on the stock.

URA etf Ready to breakout from resistanceURA ETF Ready to breakout from multi month resistance resistance. This group is one of the leading groups next to solar.

Granules Pain is not over yet!!!Looks like pain is going to stay
Inverted hammer at trendline resistance
Can come to 290 quite soon

Eurusd AnalasysisEurusd broke trendline and going upwards there is resistance near (the previous support was broken at this level )1.01000 if it breaks that then there is a trend line resistance near 1.01500
lets see what happen when it reaches the resistance
fundamental : US increasing the interest rate so the dollar was stronger than euro

EURGBP weekly Sell PositionHello ! According To My Research , EURGBP Will Go Down . So You Can Open Sell Position EURGBP on Weekly Resistance Area . I Hope It Will Fall Soon .Thank You

NASDAQ INDEX SHORT TERM ANALYSIS (A CALL OPPORTUNITY!!)The total evaluation for the NASDAQ chart is concurrently bearish over the past few months, but remained bullish in an overall decades of terms. Please be mindful of your risk management and trade accordingly with fundamentals and proper market structure (this includes familiarity towards candlesticks, indicators, etc.)
There is a very good chance we will pump right above the point of control where the volume is at its strongest, this is called a "REACTION RALLY" to the dump we just suffered the past weeks. This is especially stronger since we are sitting on a support that we just bounced around June and May 2022, this is the 3rd back-test and re-test which can serve as a strong notion for a long/call position. Simultaneously, this pump can also push crypto to 19,800$-20,200$ and ETH to 1,720$-1,750$ only fo r EVERYTHING TO GO DOWN conveniently on a bad CPI report on September 13.
Quite coincidental am I right? Its approaching resistance and there's a cpi report, maybe too obvious of a pattern for market makers but fear not, I recognized this and wanted to share it to you all!
If you are wondering what are the jitteries on the circles and everything, the full chart can be found in my profile. Its in the same NASDAQ name but in a longer term of analysis, the same information and movement can be similar
to the SP500 therefore it is not necessary for me to make another chart regarding it.
----------
Like the chart? Comment on it, boost it, bookmark it, save it. Its yours -- for free!

Amazon tests the resistance levelThe full-fledged uptrend left for correction and testing of the broken resistance at $125. After testing, the trend is likely to continue. With a 10% position volume and a stop bid at $121.50, the risk on the portfolio will be 0.5%. The profit/risk ratio is 3.74.
Amazon's Q2 2022 profits fell, but company executives gave an optimistic outlook for the cloud technology business.
If you're not ready to invest on your own yet, we recommend that you carefully study the Sirius website, read and familiarize yourself with all the information.

Astral 52 week highJSE:ARL printed a 52 week high but the stock is at or coming to an area of value. I have a long position and waiting to see what happens at this level. I would like to see the stock move above R220/share, where I'll add onto the current position.

Double bottom?NZDUSD appears to be becoming bullish. We currently have a double bottom on the 4 hour and bullish divergence according to the RSI.
Hopefully we see a nice push to the upside keeping an eye on the 0.67150 resistance level. We’ll see what happens.

GoldI've been looking at that imbalance this week, and now that it has been filled I'm going bearish for Gold.
I believe we can treat this as a resistance.
I'm anticipating the 1703.87 low taken out first.
Then completing the run for 1693.80
We're also around a high for the DXY and we've been taking out consecutive highs there.
I'm using this as a hint for Gold.

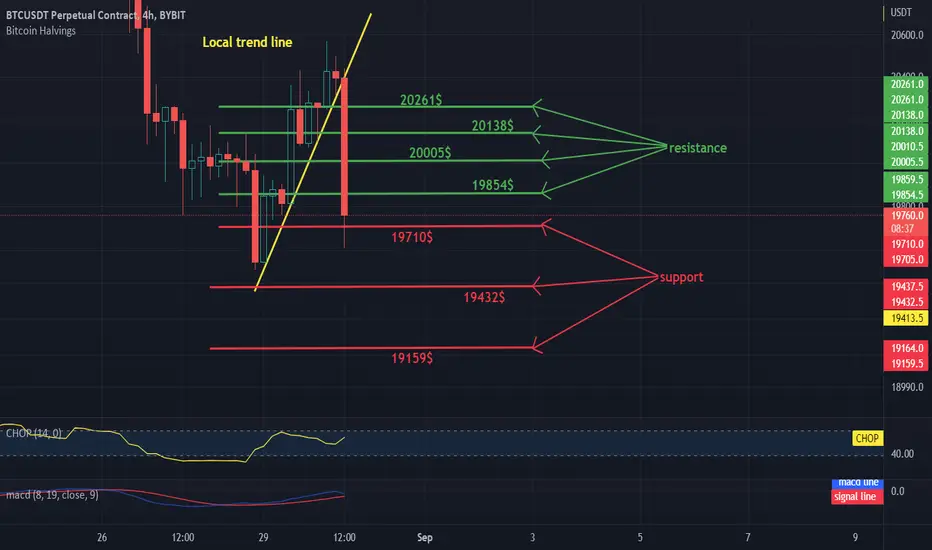
Daily BTC to USDT review on 4H intervalHello everyone, let's take a look at the BTC to USDT chart in 4 hours. As you can see, the price is moving above the local downtrend line.
Let's start with the designation of the support line and as you can see the first support in the near future is $ 19,710, if the support collapses, the next support is $ 19,432, $ 19,159.
Now let's move from the resistance line, because the first resistance is $ 19,854, if you can break it, the next resistance will be $ 2,0005, $ 20,308 and $ 20,261.
Looking at the CHOP indicator, we can see that we have a lot of energy in the 4H range, and the MACD indicator shows the local upward trend.