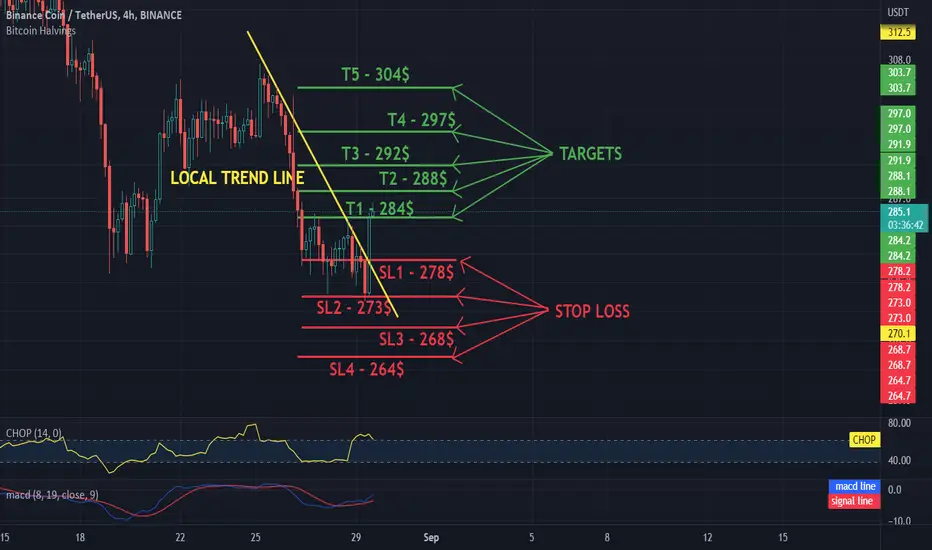
Daily BNB to USDT review on 4H intervalHello everyone, let's take a look at the 4H BNB to USDT chart as you can see the price is moving above the local downtrend line.
Let's start by setting goals for the near future that we can consider:
T1 - $ 284
T2 - $ 288
T3 - $ 292
T4 - $ 297
and
T5 - $ 304
Now let's move on to the stop loss in case of further market declines:
SL1 - $ 278
SL2 - $ 273
SL3 - $ 268
and
SL4 - $ 264
Looking at the CHOP indicator, we can see that in the 4H range we have a lot of energy, while the MACD indicator shows a local upward trend.
Resistance_level

I did not expect the upward trend to continue.
But unfortunately, the upward trend will continue.
Soon we will see the price crossing this resistance level.
The bullishness of this chart is clearly seen in the words of the Federal Reserve Chairman.
Of course, these are just my personal opinions.

$SMMT Next Target PT 2 and higherSummit Therapeutics Inc., a biopharmaceutical company, discovers, develops, and commercializes medicines to treat infectious diseases in the United States and Latin America. It conducts clinical programs focusing on Clostridioides difficile infection (CDI). The company's lead product candidate is ridinilazole, an orally administered small molecule antibiotic that is in Phase III clinical trials for the treatment of CDI. It also offers SMT-738, for combating multidrug resistant infections primarily carbapenem-resistant Enterobacteriaceae infections; and DDS-04 series for the potential treatment of infections caused by the Enterobacteriaceae. The company was founded in 2003 and is based in Cambridge, Massachusetts.

HDFC BANKOur Yesterday Target Complete🎉🎉🎉
Now we wait next correction
today HDFC BANK Closed Price is 1468.70
next Resistance is 1472.05
next Support is 1446.70
next position is short position.
SL=1472.05 And TARGET=1446.70
we know target is high
and i think target complete in 2-3 days.
but wait and watch market.

BTC relies on support at $ 23,021Hi everyone.
Today with yellow lines we have marked the channel in which the BTC price is currently moving.
As you can see, we have two important zones:
-first is the support line on which the price is currently based at $ 23,021, then we have a support zone ahead of the price which ranges from $ 20,957 to $ 17,669, if the price drops below the designated zone, we can expect further drops to around 12,000 dollars.
- the second is a resistance zone, we have from $ 24,696 to $ 26,196. A break from this zone may result in further increases towards the resistance at $ 28,754.
Currently, the price on our channel is shifting nicely to the side, which could potentially be used for short-term licks.
Also noteworthy is the CHOP indicator, which indicates that we have a lot of energy, and the MACD indicator, which indicates that we have entered a local downward trend.
Remember, however, that this is not investment advice.

Kotak BankKotakbank made triangle pattern on hourly charts & trading @ multiple resistance zone of 1848-1850 if it sustains here for few more minustes or buy above above 1855.
With mentioned stoploss & targets.

Break strong resistance But NRD bearing at above 150 or if it close above 150
Thn our target was 155 159 164 175
Sl 128

USOIL CHART AND MARKET BREAKDOWN!!!An update from the last video explaining what the current chart prices of USOIL are saying and showing us. PRICE IS APPROACH KEY MONTHLY AND WEEKLY SUPPORT RANGE.. PREPARE FOR YOURSELF WITH TWO OUTCOMES of the scenario as explained in the video below.

Tue 16th Aug 2022 XAU/USD (Gold) Daily Forex Chart Sell SetupGood morning fellow traders. On my Daily Forex charts using the High Probability & Divergence trading methods from my books, I have identified a new trade setup this morning. As usual, you can read my notes on the chart for my thoughts on this setup. The trade being a XAU/USD (Gold) Sell. I'm also leaving the partial Buy trade on for some protection. Enjoy the day all. Cheers. Jim

CME Bitcoin Futures Breakout! 28,000 Next?From May12 - June 12, CME Bitcoin Futures saw a support level of ~28,000, which was broken on June 12 with a GAP lower.
We have recently seen a CONSOLODATION PENNANT, formed with higher lows, and lower highs!
Higher lows: ~18,500 June 30, ~18,830 July 13, ~20,700 July 26. The UPTREND line is drawn from ~18,830 to~20,700.
Lower highs: ~24,300 July20, ~23350 July 22, ~23,000 July 27. The DOWNTREND line is drawn from all 3.
The BREAKOUT occurred once the CME Bitcoin Futures broke through ~23,000!
How to measure upside potential after a BREAKOUT of a PENNANT:
Calculate the distance from the widest point, and add to the BREAKOUT point. This would give us ~28,800.
Why is ~28,800 significant? THIS WOULD FILL THE GAP MADE ON JUNE 12! GAPS tend to be filled before a market makes a pivot!
Takeaways:
Previous SUPPORT of ~28,000 is now new RESISTANCE. This is going to be a difficult level to chew through!
Possible STOP levels for longs:
~21,500 (continuation of UPTREND line of PENNANT.
~Uptrend will be violated if ~20,700 is broken with conviction. This would now be a lower low, which is the definition of a DOWNTREND.
FEEL FREE TO REACH OUT WITH ANY TECHNICAL ANALSYS OR FUTURES QUESTIONS!
WE APPRECIATE OUR FOLLOWERS! LIKE/COMMENT/FOLLOW! ❤️

Bank Nifty Spot could try to touch 39130NSE:BANKNIFTY
Bank Nifty Spot could try to touch 39130, then it would take to correction of 300-500 points. (As per my analysis) . What's your opinion?

ZECUSDT is testing the weekly resistance
The price is in the consolidation phase between the monthly and weekly resistance
On the 4h timeframe the price had a breakout and retest the previous resistance as new support.
how to approach it?
IF the price is going to have a breakout from the weekly resistance and retest as new support, According to Plancton's strategy , we can set a nice order
–––––
Keep in mind.
🟣 Purple structure -> Monthly structure.
🔴 Red structure -> Weekly structure.
🔵 Blue structure -> Daily structure.
🟡 Yellow structure -> 4h structure.
–––––
Follow the Shrimp 🦐

Zydus Lifescience testing Historic ResistanceZydus Life-science at important level of resistance,
the stock took support from historical support zone and has consolidated the down fall with a good stretch of time. It has gone through a good accumulation and has made a good support base.
now the stock has positioned itself to an up move after making series of higher lows from support zone.
the stock has tested historical resistance multiple times during this consolidation.
the stock has given an impressive quarter results beating the estimates. which is the catalyst for the movement.
targets mentioned on the chart is based on fib levels taken from previous high to low levels.
the volume popup is supporting the price action
the stock may retest the B/O and a successful B/O will give a handsome gains with 1:1.4 risk reward.
Tgt 2 is for a medium to long term view.
this is not a call / recommendation.
Please do your own research and drop your inputs in the comment section.

$SPX - Overbought or Trendline Breakout?Technical Analysis (TA)
The daily chart momentum indicators are showing signs of SPX being overbought with 1 of 3 indicators on the weekly showing early signs of being overbought.
We are testing the descending line and there is a possibility of breakout or rejection here.
With daily indicators being overbought a dip to 4080 would be welcomed to reset the indicators for a push above 4200 with more momentum than we are currently experiencing.

This IS L&T stock analysis L&T stock breakout the horizontal resistance with high volume .
The stock has maintained the previous falling wedge chart pattern breakout continues, another opportunity after horizontal resistance breakout.
SL- 1764
TP1- 1977
TP2- 2050

EURUSD might go bearish As seen the resistance has been tested multiple times but the market could'nt break above.Markets about to hit resistance zone again and my hypothesis tells me that markets gonna go bearish/short.

MAYApproaching key levels with Tl & res, bit of confluence. ADX at 30 with pdi above ndi is always helpful. Would like to see a close above the ema's

MichfX | EURUSD in the trading zone for short positions
EURUSD over trend has been bearish for a while. It has bee lately in the consolidation phase and has reached my trading zone where i have been planning to open partially short positions. I will be also looking into peneration and retest of zone 1.01280 before opening more short positions.
Share your opinion in the comments and support the idea with like.

USDCAD Is Pointing Lower Within Wave C/3Hello traders, we have another important week for global markets as speculators are going to focus on CPI report from the United States, to see if prices are coming down or no. This data will be released on Wednesday, so until then we may not see a log of changes regarding the current trends. We see still stocks in a strong recovery mode with room for more upside while USD can see a sell-off, especially vs commodity currencies which are very strong. AUD, NZD and even CAD can see more upside, despite lower crude. But if crude would stabilize we think that USDCAD has a very good chance to break the support.
From an Elliott wave perspective, we see three legs up, possibly already a completed correction on the intraday chart. Break below wave b swing near 1.2815 calls 1.27.
Grega
If you like what we do, then please like and share our idea!
Disclosure: Please be informed that information we provide is NOT a trading recommendation or investment advice. All of our work is for educational purposes only.

Powerful Breakout At AAPL With 80% Chance Of The Market Going UpT.R.S (Triangle Of Resistance And Support)
1- As you can see the market tried to break
The Resistance line at 4 different Points,
and On the 5th black point he break the R line succefuly .
2- For the Support Line, we have 4 important Points
which they played the role of a solid support Points.

USDJPY sell setupUSDJPY currently trading at critical resistance area
look for bearish confirmation lower time frame in the mentioned circle area and sell USDJPY after confirmation with your own money management
patience is the key

BNB- Serious Resistance is NowClose to 319 Resistance (Fib level 0,61) it's ideal (to me) for a short position.. not to mention the flag which can bring volatility soon.
At the same time check my previous posts/ideas for my other set-ups and most importantly look at this:
Mondays are Red🩸 Ends are Weak💤 Yet we Rise✔️
We might as well have patience and yes: the market will most likely continue to rise but not on a straight line.
DYOR and learn how to trade: it does pay out eventually.
One Love,
The FXPROFESSOR
