XMRUSDT is testing the resistance The price is in the accumulation phase below the daily and weekly resistance on 226$
As you can see on the daily timeframe the price created a double bottom in 140$ area, created a W pattern retested it for a new bullish impulse until the current resistance.
on the 4h timeframe, the price is creating a channel between the 209 and 226$
How to approach?
The price needs to have a CLEAR breakout from the weekly resistance, According to Plancton's strategy , we can set a nice order
–––––
Keep in mind.
🟣 Purple structure -> Monthly structure.
🔴 Red structure -> Weekly structure.
🔵 Blue structure -> Daily structure.
🟡 Yellow structure -> 4h structure.
–––––
Follow the Shrimp 🦐
Resistance_level

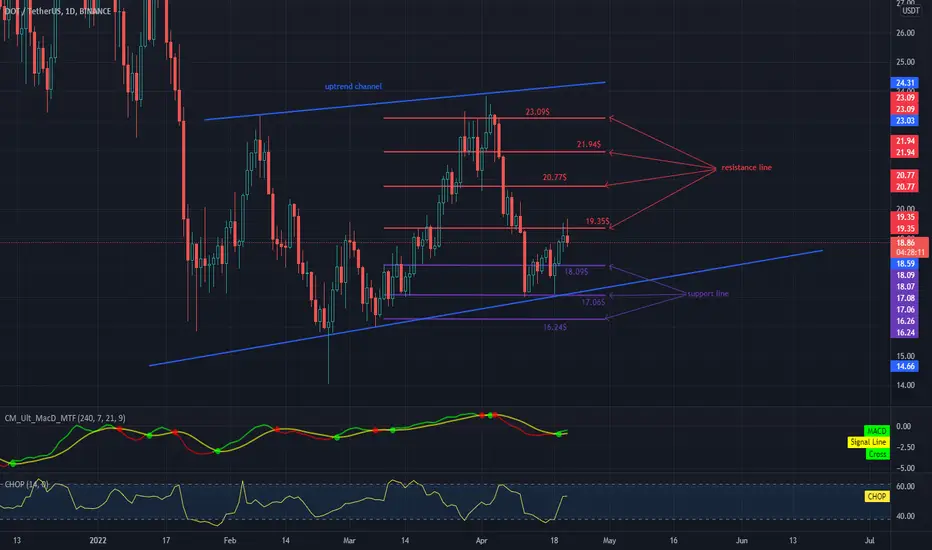
DOT possible breakout?Hello everyone, let's take a look at the DOT to USDT chart over the 1 day timeframe. As you can see, the price is moving in an uptrend channel marked with blue lines.
Let's start by determining the support lines with the Trend-Based Fib Extension tool and as you can see, the first support in the near future is $ 18.09, if the support breaks down, the next ones are $ 17.06 and $ 16.24.
Now let's move from the resistance line as the first resistance is $ 19.35, if you can break it the next resistance will be $ 20.77 and $ 21.94 plus $ 23.09.
Looking at the CHOP indicator, we can see that in the 1-day range we are starting to gain more and more energy, and the MACD indicator shows that an uptrend has started.
Tk - Principle of PolarityNYSE:TK
Please correct me if I am wrong. I am just a beginner
What I see:
- 8-4-22 We broke out of a symmetrical triangle.
- The breakout occurred on above average volume.
- The breakout was followed by a small rally, up to the high of 19-1-22, TK then pulled back to a former resistance level near the breakout point, hopefully this former level will become support.
Today (21-4-22) and the following days will tell us if the Principle of Polarity is valid on this chart. What are your expectations for Teekay Corporation?
This is no financial advice.

$TGT Resistance The move for the inverse head and shoulders pattern has almost completed and at the peak of its full move there is a double top.


1000SHIB ANALYSIS1000SHIB is repeating the rectangular pattern as it did from June - October 2021 on daily timeframe.
Keep an eye on it after breakout we will see the same huge uptrend.
For quick profit, buy at the support (red) of the rectangle and sell at the resistance level (green) with a tight stop loss.


Bitcoin - Key levelsAs stated on a previous Idea, BTC/ USDT is trading on a Modified Schiff Pitchfork since 2020.
BTC/ USDT is currently trading inside an ascending channel (White). The Upper Channel Line is the multi month trendline (Bold Yellow) that we broke in January.
If we reclaim the 0.236 Fibo and the level 1.5 (Purple Trend) of the Modified Schiff Pitchfork as support, we could expect a move to the upside, the first stop would be the 0.382 Fibo and we should be very cautious around this level, a huge Overlap is waiting us as resistance, combined with the 200 SMA Daily and the multi month trendline / Upper Channel Line.
If BTC can't reclaim the 0.236 Fibo and the level 1.5 (Purple Trend) of the Modified Schiff Pitchfork, we could expect a rejection to the lower level of the Modified Schiff Pitchfork (Pink Trend and Red Trend)

Can GOLD break and reach 2050$ again??Hi everyone
After the accumulation that we had for almost a month on XAUUSD, We can finally see the price breaking through 1965$ resistance level.
Now we have a support level of 1910$ beneath and a resistance zone on 2050$
above.
Considering the possibility of staying in this channel and not having another correction in price( I believe after 5 bullish candles in Daily we can see correction), we may see the price touches the 1965$ level and start reaching 2050$ which can also be a strong resistance level.

USDT.D UPDATE! What's my strategy now? Hello everyone, if you like the idea, do not forget to support with a like and follow.
Welcome to this USDT DOMINANCE update. USDT.D is continuously bouncing that's why BTC and Alts continuously falling.
Currently, USDT.D is trading near the 4.60 level. As you see in the chart, USDT.D once again trying to reach its major resistance line. We have seen multiple times in the past that after touching this resistance line USDT.D is rejected and starts falling.
Now the question is this time it rejects or breaks out?
Look as of now no one knows. I'll tell you what's my plan now. My simple strategy is when USDT.D reaches near the resistance line (4.75-4.85 level) I start taking entry in many Alts and hold. If in any HTF chart (Daily or weekly) USDT.D closes above this resistance line (4.80 level precisely) then I close all my longs and convert all my holdings into USDT.
Until USDT.D does not reach my levels I do not open any positions and wait patiently.
This is my strategy.
Maybe your's is different.
Share your strategy in the comment section so we all take benefit from it and learn.
If you like this idea then do support it with like and follow.
Thank You!

Bullish Divergence The Bitcoin price has created a lower low but the RSI hasn't followed hence creating a higher low which shows us there is a bullish divergence expected. Crossover on the MACD further confirms this momentum switch. I'd expect us to potentially push price back towards the $45300 level before we see any further price movement downwards. We also could break this resistance and confirm the bullish scenario again back towards $50k.

BTC price is by support.Hello everyone, let's take a look at the BTC to USDT chart over the 1 hour timeframe. As you can see, price is moving above the local uptrend line.
Let's start with the line of support and as you can see the first support that the price is currently based on is $ 42,882, if the support breaks down, the next is $ 41,277 and $ 39,644.
Now let's move from the resistance line, as you can see the first resistance is $ 42,989, if you can break it, the next resistance is $ 44819, the next resistance is $ 45,483 and $ 46,092.
Looking at the CHOP indicator, we can see that within 1 hour we start to recover energy.

Elliott Wave Analysis: ETHUSD Is Trading In Wave CHello Crypto traders!
Today we will talk about Ethereum, its price action from technical point of view and wave structure from Elliott Wave perspective.
ETHUSD is in recovery mode and from Elliott Wave perspective we can see a three-wave A-B-C Elliott wave corrective rally in progress. The main reason why we are looking for a corrective rise is because of wave B Elliott wave triangle in the middle. Triangles cannot occur in wave 2, so it should be an A-B-C.
Wave C is a motive wave and it should be completed by a five-wave cycle, where final wave (5) of C is still missing.
So, from technical point of view, we can easily see more gains till the end of the week, ideally towards projected 3600-4000 resistance area, from where we will have to be aware of a reversal down again.
Be humble and trade smart!
If you like that we do, then please like and share our idea!
Disclosure: Please be informed that information we provide is NOT a trading recommendation or investment advice. All of our work is for educational purposes only.

Aussie Is Approaching Potential Resistance Ahead Of RBAHello traders!
Today we will talk about Aussie (AUDUSD) in which we see slow price action and corrective wave structure since end of January that can be now approaching important and strong October 2021 highs resistance area ahead of important RBA.
From Elliott Wave perspective, we are tracking a complex 7-swing A-B-C-X-A-B-C elliott wave corrective rally which can be nearing the end, as we see it trading in final stages of wave 5 of (C). The main reason can be a break out of wave 4 elliott wave triangle pattern that suggest final leg before a reversal.
From technical point of view, we see it coming into important channel resistance line connected from the lows and interesting Fibonacci levels that can stop anywhere here in the 0.7550 - 0.7650 resistance zone.
Trade well!
If you like that we do, then please like and share our idea.
Disclosure: Please be informed that information we provide is NOT a trading recommendation or investment advice. All of our work is for educational purposes only.

COTIUSDT is testing the daily resistanceThe price had a breakout from the descending channel and created a rounded bottom above the weekly support.
on the 4h timeframe, the price is testing the 0.3$ resistance and the market is in a consolidation phase between the weekly and daily structures.
The price already retested a Fibonacci level of the 0.382 Fibonacci level
How to approach?
The price needs a new breakout from the confluence zone, above the 0.31$ with the retest. So if the price is going to have a breakout, According to Plancton's strategy , we can set a nice order
–––––
Keep in mind.
🟣 Purple structure -> Monthly structure.
🔴 Red structure -> Weekly structure.
🔵 Blue structure -> Daily structure.
🟡 Yellow structure -> 4h structure.
–––––
Follow the Shrimp 🦐

DOTUSDT is testing the monthly resistanceThe price is testing the monthly resistance, as you can see on the upper chart, the price got rejections for that area in the past. 23.5$ is a key level for DOT.
on 4h Timeframe, the price is creating an ascending channel.
How to approach?
The price could have a pullback on the 4h support on 22.30$ before a new breakout from the 23.4$ (monthly resistance.). So if the price is going to have a breakout, According to Plancton's strategy , we can set a nice order
–––––
Keep in mind.
🟣 Purple structure -> Monthly structure.
🔴 Red structure -> Weekly structure.
🔵 Blue structure -> Daily structure.
🟡 Yellow structure -> 4h structure.
–––––
Follow the Shrimp 🦐

BTCBitcoin is moving inside this channel and now it has reached the channel ceiling and reacted and technically the price is reduced unless something fundamental happens.
The future is the past…
Have a good trade ;)

CAKEUSDT is testing the resistanceThe price had a breakout from the daily dynamic resistance and now is trying to have a breakout from the static resistance.
On the 4h timeframe the price is below a supply zone on 7$.
How to approach?
The price needs to create a new bullish impulse and breakout from 7$ and retest that area as new support. According to Plancton's strategy , we can set a nice order
–––––
Keep in mind.
🟣 Purple structure -> Monthly structure.
🔴 Red structure -> Weekly structure.
🔵 Blue structure -> Daily structure.
🟡 Yellow structure -> 4h structure.
–––––
Follow the Shrimp 🦐

MANA Strong resistanceMANA found strong resistance at $2.77, in the last 7 days. Price action suggests a further fall before the pump.
Decentraland is one of the Kings in Metaverse, so I will be not surprised if we see a 10X, in the long run, of course.
To go long, wait for a possible correction at $2.29 - 2.19.
If price don’t reach these levels a nice entry is between $2.82 – 2.72, when price break and retest this zone.
Investing is a probability game.
Try for consistency, there is no perfection in this.
Not financial advice. Always do your own research.

ETHUSDT is testing the previous resistance as new supportAccording to my previous analysis, the price got a rejection exactly on the daily resistance as I told you. The resistance on 3400$ is so strong and the price needs new liquidity to create a clear breakout from it. At the moment the market is overextended, and we could see a retracement before the new bullish impulse.
On the 4h timeframe, the price is following my previous drawing and the market is testing the previous 4h resistance as new support. The price needs to hold it.
So, IF the price is going to grab new liquidity and gain momentum, we could see a new bullish impulse above the 3460 (new higher high) and if the price is going to retest the previous resistance as new support, we could see a new bullish impulse, where the next resistance could be on 3700.
Otherwise, if the price is going to lose the 3140$ we could see a retest of 3k as new support.
––––
Keep in mind.
🟣 Purple structure -> Monthly structure.
🔴 Red structure -> Weekly structure.
🔵 Blue structure -> Daily structure.
🟡 Yellow structure -> 4h structure.

ALPHAUSDT is testing the 4h resistance 🦐The market is testing the Monthly key level on 0.28$ after a big bearish momentum
on the 4h timeframe the price got rejection from the 4h resistance with a false breakout above the structure.
How to approach?
The price needs to have a new breakout from the 4h resistance and retest it as new support. IF the price is going to have a breakout, According to Plancton's strategy , we can set a nice order
–––––
Keep in mind.
🟣 Purple structure -> Monthly structure.
🔴 Red structure -> Weekly structure.
🔵 Blue structure -> Daily structure.
🟡 Yellow structure -> 4h structure.
–––––
Follow the Shrimp 🦐

TRXUSDT is going to test the monthly resistanceThe price created an Adam and Eve pattern on the daily timeframe the now the market wants to test the monthly resistance on 0.78$
On the 4h timeframe the price had a breakout from the pennant and retest it as new support before the bullish impulse.
How to approach?
The Market is extended right now, and we could see a retracement on the weekly support on 0.72$ we could see a consolidation phase before the new breakout above the monthly resistance. According to Plancton's strategy , we can set a nice order
–––––
Keep in mind.
🟣 Purple structure -> Monthly structure.
🔴 Red structure -> Weekly structure.
🔵 Blue structure -> Daily structure.
🟡 Yellow structure -> 4h structure.
–––––
Follow the Shrimp 🦐

IOTXUSDT is testing the 4h resistanceThe price had a breakout from the bull flag and retest the 4h resistance on 0.10$.
This area is very strong, if you look on the left you can see that the price got bounces and rejections from it, it means that the market "suffers" on this area
How to approach?
The price needs to have a new breakout from the resistance and confirm it. As you can see, the breakout is not enough, before the price had a false one, for that reason we are following Plancton's rules to open a new position. So, IF the price is going to confirm the flip, According to Plancton's strategy , we can set a nice order
–––––
Keep in mind.
🟣 Purple structure -> Monthly structure.
🔴 Red structure -> Weekly structure.
🔵 Blue structure -> Daily structure.
🟡 Yellow structure -> 4h structure.
–––––
Follow the Shrimp 🦐
