Resistance break in renuka sugar with the support of rsi A very good resistance in breakout in renuka sugar and they also have big support of rsi bcs a good breakout was also done in rsi with heavy buying
Buy it at 51.50
Target 55.60 56.65 59.60 63.20
Sl 41
Resistancebreak

EURJPY Bullish BiasEURJPY has broken both trendlines and settled above the pivot point suggesting bullish continuation towards the resistance at 143.200.
Main Scenario:
If the price mantains stability above the pivot, we can open buy positions with targets at 141.330 and 143.2.
Note: Technical indicators display slight bearish divergence on lower timeframe warranting caution.
Alternate Scenario
If the price breaks and consolidates below the pivot, we can expect bearish price movement towards 136.824.

Birla corp showing signs of trend reversal Possible resistance breakout and trend reversal!
Looks like construction material stocks are booming and it is time for Birlacorp now!
Staytuned!

ABFRL - 20% ROIAll details are given on chart. If you like the analyses please do share it with your friends, like and follow me for more such interesting breakout charts.
Disc - Am not a SEBI registered. Please do your own analyses before taking position. This post is only for educational purposes and not a trading recommendation.

BANKBARODA - 20% ROIAll details are given on chart. If you like the analyses please do share it with your friends, like and follow me for more such interesting breakout charts.
Disc - Am not a SEBI registered. Please do your own analyses before taking position. This post is only for educational purposes and not a trading recommendation.

ZECUSDT is testing the weekly resistance
The price is in the consolidation phase between the monthly and weekly resistance
On the 4h timeframe the price had a breakout and retest the previous resistance as new support.
how to approach it?
IF the price is going to have a breakout from the weekly resistance and retest as new support, According to Plancton's strategy , we can set a nice order
–––––
Keep in mind.
🟣 Purple structure -> Monthly structure.
🔴 Red structure -> Weekly structure.
🔵 Blue structure -> Daily structure.
🟡 Yellow structure -> 4h structure.
–––––
Follow the Shrimp 🦐

ETH heading strong resistance and good support levelshello all
i think we breakout from a range area and surpass the 1280 resistance.
now we reach 1650 resistance and the market react to it.
so i think we have a pullback to 1300 area and after that toward 1650 again
and repeatedly react to 1650 resistance and after that will go for 2000 resistance.
also maybe we have a 50% correction of this impulse wave that shows the 1300 level too.
Etherum has good fundamentals according to merge upgrade.so this targets are reachable
in coming months.
share me your opinion in comments.

Textbook x3Within a 4 days time MATIC resistances have turned support 3 times offering plenty of entry points for fruitful Long set-ups.
Many traders who use technical analysis hear phrases that suggest a "broken support level will become a future area of resistance" or that a "previous level of resistance will become a support." For beginner traders, phrases like this sound like they're spoken in another language, and even many experienced traders never fully understand or appreciate this intriguing role reversal. This article will attempt to shed light on the importance of support and resistance levels and illustrate why traders should take particular note when they reverse roles.
Link
One Love,
the FXPROFESSOR

BNBUSDT broken out of falling wedgeBNBUSDT has broken out of the falling wedge pattern, am not bullish yet unless for scalp, because we are still in the corrective pattern imo.
Resistance at 230 area is still strong, there's possibility that BNB continue its correction downward to psychological 200 area, before continue to the upside.

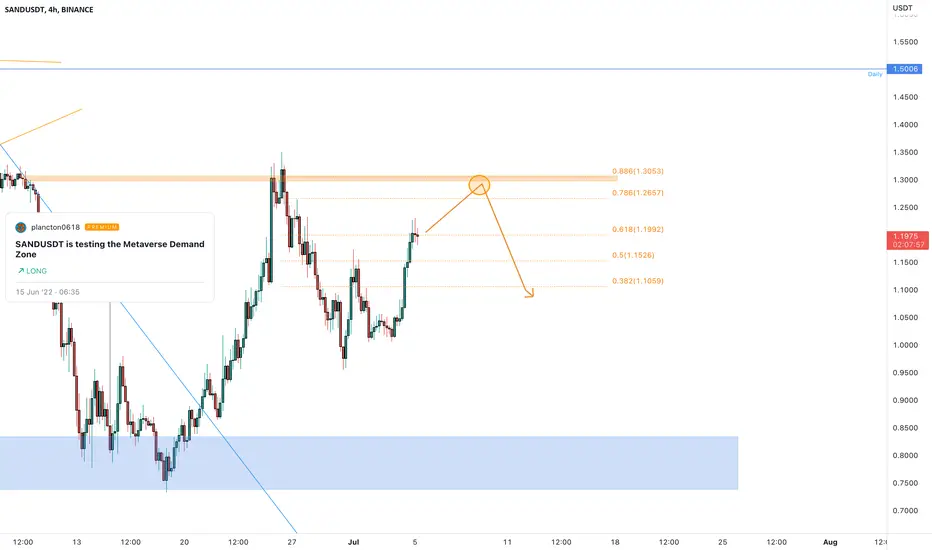
SANDUSDT is going to retest the resistanceThe price had a nice reaction from the daily support as I told you in my previous analysis on 0.8$.
The price could retest again the 0.786 - 0.886 Fibonacci level on the 4h timeframe and got a rejection.
a RETEST is NOT ENOUGH for a short position, the price needs to satisfy our rules
How to approach?
IF the price is going to have a reject from the key level, According to Plancton's strategy , we can set a nice order
–––––
Keep in mind.
🟣 Purple structure -> Monthly structure.
🔴 Red structure -> Weekly structure.
🔵 Blue structure -> Daily structure.
🟡 Yellow structure -> 4h structure.
–––––
Follow the Shrimp 🦐
ETCUSDT is testing the 4h resistanceThe price bounced exactly in the 1.127 Fibonacci Extension on 17.25$ and the market started with a triangle on 4h timeframe.
now the price is testing the 4h resistance at 24.5$ where the price got a rejection a few days ago.
How to approach it?
the price needs to have a new breakout from the resistance and retest the resistance as new support. According to Plancton's strategy , we can set a nice order
–––––
Keep in mind.
🟣 Purple structure -> Monthly structure.
🔴 Red structure -> Weekly structure.
🔵 Blue structure -> Daily structure.
🟡 Yellow structure -> 4h structure.
–––––
Follow the Shrimp 🦐

XMRUSDT is testing the resistance The price is in the accumulation phase below the daily and weekly resistance on 226$
As you can see on the daily timeframe the price created a double bottom in 140$ area, created a W pattern retested it for a new bullish impulse until the current resistance.
on the 4h timeframe, the price is creating a channel between the 209 and 226$
How to approach?
The price needs to have a CLEAR breakout from the weekly resistance, According to Plancton's strategy , we can set a nice order
–––––
Keep in mind.
🟣 Purple structure -> Monthly structure.
🔴 Red structure -> Weekly structure.
🔵 Blue structure -> Daily structure.
🟡 Yellow structure -> 4h structure.
–––––
Follow the Shrimp 🦐

Genus power : On the Verge of All time high Level BreakoutGenus Power
Can it break the all time Levels, keep watching

Cheap call options - Swing and Squeeze UpI am seeing about 27% short interest in FUBO, but I do not trade on this. My technical reasons are sound, and short interest may drive stock higher if it moves up. There is a large sell block today, 22k, at $8.03, which may clear this week for stock to move higher. Call options are very cheap so I suggest taking 14Apr and later expiry. This stock has not gotten attention yet (unlike other meme stocks) but I think it will. Buying here below 8 gives you a very low risk swing trade with a tremendous reward potential.
Weekly chart
> RSI and stochastic both are exiting from oversold levels and may see buyers in the next few weeks
> Ovals highlight previous move up which could repeat, technically speaking
> During price rise marked by oval RSI held over 40, so this this time with it coming from below 30 there may be more buying power
> Set 8.40 alert - over this could see a sustained move higher
Daily chart
> Bullish divergence complete (green lines), followed by strong move over the downtrend line
> Stochastic %K gave a warning for more upside price action (rectangle), and %D still has to move higher
> Looking for RSI to move over 50 and stay, to support more upside
> Green arrow marks a bullish 3 candle move that helped 10ema move over 20sma
On 30min chart, 20sma is above the 200ma and the cloud. You can draw a support line from the highs on 18 & 23 March.

Inverse Head and Shoulder In 15 Minute NiftyVery decisive moment we can see in Nifty.
Get ready to make.

Oberoi RealityGet ready to board OBEROIRLTY departs above 915, Oberoirlty about to break very strong resistance with got rejected multiple times.
Buy only above 915 with mentioned stoploss & target.


CiplaCipla Breaking out of multiple time resistance zone of 902-905.
Could be bought with mentioned sloss & tgts.

CCL pdtsCCL Pdts broke out of very strong 5 months resistance.
Could b bought with mentioned sloss & tgts.

TatasteelTatasteel is breaking out resistance zone of 1120-1124.
Could b bought with mnetioned sloss & tgts.

PLTR - LongBreak out over resistance . Bullish trend since positive earnings.
Price action needs to break long term descending triangle and have it act as support to confirm.
ADX < 40 so not a strong uptrend.
RSI > 50, good time to buy on the support levels.

MIME, new all time highs.MIME broke out of the late 2020 to early 2021 resistance of $59.24.
It has been beating its earnings expectations consistently with only a few misses and is expected to do even better in the coming year.
Looking at the long term price action of MIME, it's on a steady up trend. I think MIME may consolidate a bit, testing the broken resistance as support, before moving higher.
Trade Idea
Look for buying opportunities around the $59.24 area if you're looking for a small discount.
Otherwise, you can get in now and ride the wave!

Will ST challenge all time highs?After using the highs from 2015 and 2018 ($56.28) as support, ST is now approaching the resistance of $61.13. Also note that ST has been ranging from year-to-date between $56.28 and $61.13.
Judging from the price action, it seems like ST may break and close above $61.13 in the coming week.
A rejection from $61.13 could have ST test the support of $59.90
Look for buying opportunities:
* Around the $59.90 area
OR
* After a daily close above $61.13
