Smart Money Concepts in Action: XAUUSD Tests Strong Resistance Market Context and Structure
On the 1-hour chart, XAUUSD (Gold) has been in a bullish market structure, forming consecutive Breaks of Structure (BOS)—a clear sign of buying pressure and upward momentum. These BOS points mark moments when the market forms new highs, confirming bullish continuation.
However, as price approaches the 3370–3380 zone, it reaches a well-defined resistance/supply area. This zone has previously rejected price and can be viewed as a region where institutional selling may occur.
🧠 Smart Money and Liquidity Concepts
From a Smart Money Concepts (SMC) perspective, price often moves to areas of liquidity—zones where buy stops (above highs) or sell stops (below lows) are collected. In this chart:
Price pushes up towards 3370, potentially grabbing liquidity above recent highs.
This move could be a liquidity sweep, where the market fakes a breakout to trap retail traders before reversing.
Such behavior often occurs near institutional zones, suggesting a possible distribution phase—where large players offload positions before a move in the opposite direction.
⚙️ Resistance Analysis: Why 3370 Matters
The 3370–3380 area has acted as a ceiling in the past.
Price is currently reacting near this level, showing early signs of rejection.
This zone aligns with previous order blocks, where institutions may have placed sell orders.
In educational terms, this shows how supply zones can act as natural turning points in a market, especially when price approaches them after an extended move.
📦 Support & Potential Downside
If a reversal happens from this resistance, the next key support zone lies between 3300–3320. This level has historically acted as demand and could be revisited for price rebalancing or order filling.
📝 Educational Summary
This XAUUSD chart provides a great learning opportunity in observing:
How Break of Structure (BOS) confirms trend direction.
The role of liquidity zones in trapping retail traders.
How smart money operates around key levels like 3370.
The importance of combining structure, zones, and reaction for confluence.
Resistancezones

JPYUSD Technical Analysis | (MMC) in Play + Target🟦 1. Structure & Price Action Overview
The chart is of JPY/USD on the 2-hour timeframe, showing a clear picture of price movement over several weeks.
We see three major market phases:
Range/Resistance Phase (Left side of chart)
Uptrend Phase (Middle – rising channel)
Reversal Setup (Right side – potential bearish move forming)
📈 2. Uptrend Channel (Accumulation to Expansion Phase)
From around May 13th, price started forming higher highs and higher lows, respecting a bullish channel (light blue shaded area).
This is a classic ascending channel, often seen during a controlled uptrend where buyers are still in control but momentum is slowing.
The channel took price directly into the resistance zone (marked in purple at the top).
🚫 3. Resistance Zone Rejection (Key Supply Zone)
Once price hit the resistance zone (~0.00705), it failed to break higher.
This level had previously caused sharp drops, so it's a well-established supply zone.
Price was rejected and dropped sharply, breaking out of the ascending channel – a strong bearish signal.
🔄 4. Mirror Market Concept (MMC) – Curve Bending Pattern
After the initial drop, price attempted a bounce, but couldn't even reach previous highs.
The curved arrow labeled "Curve Bending" shows how the market is “bending” its momentum – not pushing upward anymore but turning into a reversal.
This forms the mirror of the previous rise – indicating the market is ready to “mirror” that previous bullish leg, but to the downside.
🔄 5. SR Interchange (Support Flipped Resistance)
The previous demand zone (around 0.006950–0.007000), where buyers pushed price higher during the uptrend, is now acting as resistance.
This is called an SR Flip (Support becomes Resistance) – a very reliable technical sign of trend reversal.
🎯 6. Bearish Target Projection
Based on MMC and symmetry of past movements, the chart is projecting a strong drop toward the 0.006800 support zone.
This zone is also historically significant and acted as a demand area earlier.
The black arrow and target box show this expected move, which aligns with the mirror structure.
🧩 Conclusion & Trade Plan
Bias: Strong Bearish
Confirmation : Channel break + rejection at resistance + curve bending
Trigger: Price fails to reclaim 0.00700 and breaks below 0.006930
Target: 0.006800
Invalidation : Clean break & hold above 0.007050
🛡️ Pro Tips:
Don’t just jump in — wait for bearish confirmation (like a bearish engulfing candle, or a failed retest).
Always set your SL (Stop Loss) above the resistance zone (~0.007050).
Let the setup come to you — don’t force trades.

XAUUSD – Rising Wedge Breakdown in Play? | Bearish Setup Alert🧠 Market Analysis
Gold (XAUUSD) has shown incredible bullish strength in recent months, driven by geopolitical tensions, inflation uncertainty, and increased demand for safe-haven assets. However, every trend experiences a pause or correction — and that’s where we may currently be.
📊 Pattern Overview: Rising Wedge Formation
One of the most prominent technical patterns right now is the Rising Wedge. This is a bearish reversal pattern that occurs when price action consolidates upwards in a narrowing range, indicating waning bullish momentum and an imminent breakdown.
In this chart:
We see a clear series of higher highs and higher lows, forming two converging trendlines.
The upper trendline acts as dynamic resistance, while the lower one has been supporting price until now.
The wedge has now broken to the downside, signaling the potential start of a new short-term downtrend.
🔍 Key Technical Elements Explained:
🔵 1. Major Resistance Zone
Marked in the blue rectangular box, this zone has acted as a historical pivot area — both as support and resistance in the past.
The market respected this zone multiple times.
Price action tends to hesitate or reverse in such regions due to large institutional order flows.
🧠 2. Black Mind Curve Resistance
Unlike flat trendlines, the "Black Mind Curve" represents a curved, psychological dynamic resistance — often based on market sentiment, Fibonacci arcs, or logarithmic regression.
It reflects the market’s natural rhythm and is respected due to the hidden behavior of algorithmic trading systems.
Price just rejected this resistance after touching it during the wedge formation — a strong bearish clue.
🔄 3. Retest in Progress
After breaking out of the rising wedge to the downside, price is now retesting the broken wedge support.
This is a common price behavior known as the “kiss of death” — a final tap before continuation.
If the price fails to reclaim this broken support zone, it confirms a bearish continuation is on the table.
🎯 Trade Plan: Entry, Target & Stop
Trade Element Details
Bias Bearish
Entry Idea On confirmation of retest rejection (e.g., bearish engulfing candle)
Stop Loss (SL) Above the recent high or resistance – near $3,413.58
Take Profit (TP) First major support near $3,153.70 (SR Interchange)
Risk-Reward Ratio Estimated between 1:2 to 1:3, depending on entry
🔥 Bonus Target: If momentum increases, an extended drop toward $3,100–$3,080 is possible — where deeper demand lies.
🧘♂️ Trading Psychology & Risk Management:
Let’s face it: Even the best setup can fail — which is why discipline is your edge.
Confirmation is Key: Never short just because of a pattern. Wait for structure + candlestick confirmation (e.g., bearish engulfing, shooting star, etc.).
Emotions Kill Accounts : Don’t let greed convince you to skip stop-losses or over-leverage.
Let Price Come to You: If you missed the perfect entry, don’t chase. The market always gives second chances.
🧠 Educational Insight : What Makes This Setup Powerful?
This setup is a confluence trade, meaning:
You’re not relying on one signal, but multiple confirmations:
Rising wedge (pattern-based)
Resistance zone (horizontal S&D)
Curved dynamic resistance (psychological + advanced trendline)
Retest + rejection behavior (price action)
These stacked layers of confirmation increase the probability of a successful trade.
📌 Final Thoughts:
Gold is showing all the technical signs of a short-term bearish correction, despite the broader bullish narrative. For smart traders, this is an opportunity to catch a swing short with a clear entry, stop, and target.
The key to winning here? Patience and confirmation.
You don’t have to predict the market — just react to it with logic and discipline. Let the setup unfold naturally, and let the trade come to you.
💬 What’s Your Take?
Are you shorting Gold here or waiting for more confirmation?
Have you used curved resistance lines before in your analysis?
Drop your thoughts below — and if this helped you, smash the like button, share with others, and follow me for more high-probability setups!

NAS100USD: Rejection Block & Breaker Converge for Sell SetupMarket Context:
In today’s analysis of NAS100USD, we note that although the market has been trading within bullish institutional order flow, current price action is presenting multiple signs that a bearish reversal may be underway. Institutional behavior appears to have shifted, particularly after liquidity was swept and price began to respect resistance zones.
Key Observations:
Premium Buy Stop Sweep:
Price action swept the swing high rather than breaking it cleanly, indicating a stop raid. This is a common smart money tactic used to engage with buy stop liquidity in premium pricing before reversing.
Rejection Block Formation:
A sharp rejection followed the liquidity sweep, leaving behind a Rejection Block—a powerful institutional resistance zone. This suggests the institutions placed sell orders against willing buyers and are defending this level.
Market Structure Shift:
We observe a break in internal structure to the downside, further confirming that the prior bullish order flow may now be transitioning into a bearish phase.
Breaker Block Retest:
Price has retraced into a Breaker Block, where institutions typically revisit prior zones of buying to mitigate exposure and initiate new sell positions. This zone is reinforced by alignment with the previous buy stop sweep, providing a high-value confluence area for short opportunities.
Trading Plan:
Entry Strategy:
Await confirmation within the breaker on the lower timeframes. Once confirmed, these zones offer a strong institutional case for short positioning.
Targets:
Focus on discount liquidity pools as the primary objective. Selling from premium levels with the intention of targeting undervalued zones mirrors institutional execution models.
Stay aligned with smart money behavior—observe, confirm, and act with precision.
Happy Trading!
The Architect

EMCURE PHARMA | Approaching Key Resistance | Breakout or Triple ⚙️ Technical Setup Highlights:
Price is testing a resistance zone around ₹1100, which has been rejected twice before (as indicated by black arrows).
Volume has picked up on the recent move up — indicating buying interest.
RSI is turning up from near the 50 level, signaling positive momentum.
📈 Trade Plan:
🔹 If Price Breaks Above ₹1110-1120 with Volume:
Buy above ₹1120 (wait for a breakout candle with volume)
Target 1: ₹1180
Target 2: ₹1240
Stoploss: ₹1070 (just below the breakout level)
🔻 If Price Rejected at ₹1100-1120 Zone Again:
Sell near ₹1100-1110 (on bearish reversal candle confirmation)
Target: ₹1020
Stoploss: ₹1130
🎯 Ideal Strategy:
Wait for confirmation — either a clean breakout above ₹1120 or a rejection signal at resistance. Avoid trading within the zone.
for educational purposes only

DXY at Make-or-Break Level Ahead of Trade Deal UncertaintyGood day Traders,
Take a moment to go through my outlook of DXY.
Currently, DXY is moving within a clearly defined ascending channel, showing a short-term bullish correction after the sharp drop seen last week. Price is respecting the channel's boundaries, making higher highs and higher lows, characteristic of a pullback phase in a broader bearish move.
However, attention is now drawn to the resistance zone around 103.80 – 104.19 zone. This area coincides with:
1. Top of the channel (confluence resistance)
2. A harmonic pattern completion zone or reversal block
3. A previous structural support-turned-resistance area
In my view, the recent price action suggests a potential reversal at or just above this zone, leading to a new bearish leg that could see DXY breaking below the current trend channel and targeting sub-102.56 and 102.00 levels.
From the fundamentals, it appears that optimism around a trade deal is helping the USD recover short-term. The market may be pricing in hope, not reality. If sentiment shifts, or deal details (between US and China) disappoint, a swift reversal is highly likely—aligning with the anticipated turn near 104.00 from the technicals.
I think this makes the current zone a high-alert area for dollar bulls and bears alike. A fake-out to the upside into this supply zone could trap late buyers before the larger macro and technical forces push the dollar back down. By implication, we then expect to see a slight drop then rally on EURUSD, GBPUSD etc.
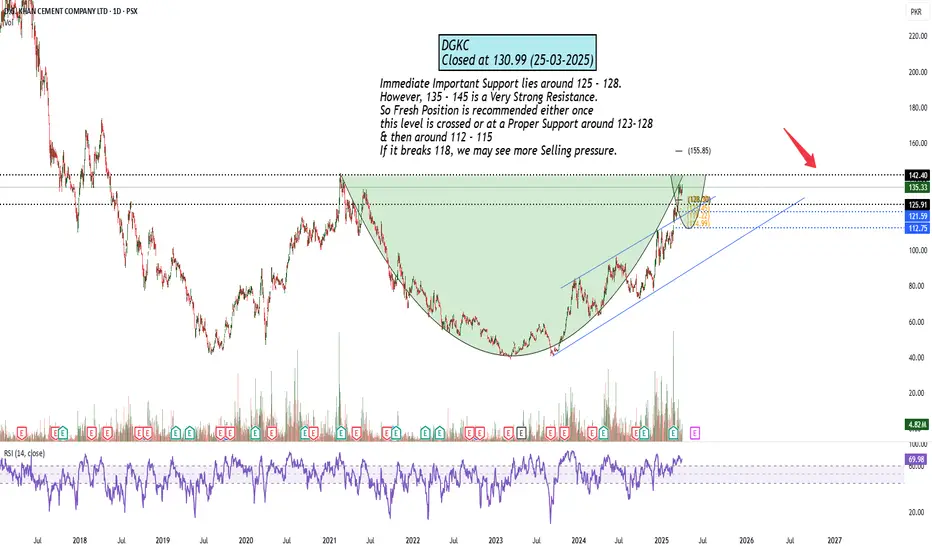
Cheers and Happy trading!

135 - 145 Important Resistance ZoneImmediate Important Support lies around 125 - 128.
However, 135 - 145 is a Very Strong Resistance.
So Fresh Position is recommended either once
this level is crossed or at a Proper Support around 123-128
& then around 112 - 115
If it breaks 118, we may see more Selling pressure.
Will BTC drop to further supports?Hello everyone, I invite you to review the current situation on BTC. When we enter the one-day interval, we can see how the BTC price is moving under the local downtrend line. What's more, we can see here how we broke the uptrend line at the bottom, but we are still above the main uptrend line.
Currently, we can see how the price is based on support at $ 79,339, but if we leave this support at the bottom, we still have strong support at $ 72,294, which is located at the golden FIB point 0.618, under it we can see the main trend line passing and then support at $ 62,217.
Looking the other way, in a situation when the trend reverses, we can expect resistance at $ 85,562, then resistance is visible at $ 90,843, the next significant resistance is at $ 97,888, behind which we already have a very strong resistance zone from $ 103,060 to $ 109,481.
On the MACD indicator, we can observe the continuation of the ongoing downward trend, in which at the moment there is no signal for the price to return. However, it is worth looking at the EMA Cross 50/200 indicator here, which, despite a strong decline, still maintains an upward trend, which may have a positive impact on the price in the coming weeks.

What's next for BTC? Will the correction go lower?Hello everyone, I invite you to review the situation of BTC, which has currently had a -15% price correction. This is a natural correction in the growth cycle, and what's more, much larger corrections at 20% or 30% levels often appeared in bull cycles.
Let's start with how the price moved in the local growth trend channel, in which we can see how dynamically we went down to the lower zone of the channel, which translated into a further drop in price reaching the support level at $ 91,712. In such a situation, it should be taken into account that very often leaving the channel gives a movement close to the channel height, which could cause the BTC price to drop to the support level at $ 84,072.
If the current rebound from the level of around $92,000 ends the current correction, however, here we see how the level of $95,004 poses effective resistance for the price, only when it is broken again will it go further to the area of $101,000, and then again move towards the strong resistance zone from $106,000 to $108,000. On the RSI, taking into account the 12H interval, we have a visible descent with crossing the lower limit, which in previous situations gave rise to renewed price increases.

XRP is flying towards the sky!!XRP is emerging from the triangle with a huge upward movement, the price increase itself reaches 165%, which gives a very good result among the leading cryptocurrencies.
You can see here how the price is dynamically approaching a very strong resistance zone from the level of $1.42 to the level of $1.61. This is a very important zone that should be monitored, because moving upwards from this zone will open the way to the previous ATH, but if the zone rejects the increase, we will be able to see the price quickly return to around $1.06, and then we can see the level around $0.8.

FTM/USDT Long-TermI invite you to take a quick look at the FTM to USDT chart over a one-weekend period. As we can see, the price moved upwards from the downward trend channel with dynamic movements.
Currently, we can see that we are moving between two zones, there is a strong support zone from $0.61 to $0.52, and a second resistance zone from $0.84 to $0.97.

Will ETH repeat BTC's strong upward move?ETH in a key place, currently fighting with strong resistance at the level of $3,247, this is a key place before the upward movement to around $3,561, which is the last place before the movement towards a very strong resistance zone from $3,948 to $4,102, which is a key place before the establishment of the new ATH.
Looking the other way, there is currently a strong upward movement, which may give a moment of relief and here there is support at $2,816, then there is strong support at $2,546, and then the price could go back even to around $2,117, which in the current situation is an unlikely move at this point.

GBPUSD Week 38 Swing zonesLast 2 weeks have proven while its a good plan to keeps losses small and swing for big wins.
Sometimes you swing and miss, but thats ok.
Based on calculations SZ are set of W38, but price action determines trades
USZ: 299 - 330
LSZ: 901 - 850

ETH-USDT 12HInterval Chart ReviewHello everyone, let's take a look at the ETH to USDT chart on a 12-hour time frame. How can we see how the downtrend channel has been defined for us, in which we are at the lower border.
Let's start by determining the support line and here you can see how the support at $2,823 has been broken and we are currently approaching the strong support at $2,626, while when we start going further, the next support is around $2,392.
Looking the other way, there is resistance at $2,922, and then the price will again have to face the resistance zone from $3,098 to $3,225.

BTC/USDT 4h Interval ChartHello, I invite everyone to a quick review of BTC to USDT pair, taking into account the four-hour interval. as we can see, the price has moved upwards from the downward trend line.
After unfolding the fib retracement grid, we can determine a strong resistance zone from $62,799 to $64,952, only the upward exit from this zone can give room for an upward movement towards $68,000.
Looking at the second stone, we will determine the support places in a similar way. And here you can see support at the level of $61,000, then the second support level is visible at the price of $59,594, and the next support is at the price of $57,355.
It is worth looking at the RSI indicator here, which shows a strong movement beyond the upper limit, which translates into a loss of growth power and may change the direction of the price.

FTM/USDT 1D Interval Hello everyone, I invite you to review the FTM chart in pair with USDT on a one-day time frame. Let's start by identifying the main downtrend channel in which the price is systematically falling with the blue lines. However, locally we can also determine a downward trend line, which currently shows how the price is struggling to go higher.
Going further, we can see how strongly we are approaching a very important support point, which is currently the main support for the price at $0.31.
Looking the other way, it is worth determining the resistance that FTM must face. And here you can see how we are approaching the resistance zone from $0.52 to $0.61, then there is strong resistance at $0.75, and then the price will have to face a very strong resistance zone from $0.84 to $0.97.
It is worth looking at the RSi indicator here, where we can see a reflection from the lower border with room for continued growth, but here we can see how there is currently a fight to maintain the place where we could repeatedly observe reflections in one and the other direction.

BTC undergoing correctionHello everyone, let's take a look at the BTC to USDT chart on a one-day time frame. As we can see, the price rebounded from the upper border of the downward trend channel, and what is more, we can see how the local downward trend line was broken inside the channel.
Let's start by determining the support line and here there is a strong support at the level of $65,372, at which the price currently holds, then there is support at the level of $61,397, the third support at the price of $58,444, and further support at the lower border of the downward trend channel at the level of $54,792 .
Looking the other way again using the trend based fib extension tool, we can determine resistance. However, here it is worth starting by marking a strong resistance zone which the price cannot overcome from $70,105 to $73,515, then there is resistance at $76,267 and then at around $80,000.
Looking at the RSI indicator, we can see how we have approached the place where we could previously observe a change in direction, while on the STOCH indicator we are moving towards the lower border, which may also indicate an upcoming change in direction.

GBP-USDThe gbp-usd impulse moves downward and now retraces at 50-61.8% fib retracement level. That is mentioned in the chart and the market gets down from the 1.27500 level. If the market respects that level then the market will go down to 1.26800 level.

XAU-USD (Gold)The gold pair moves in a vertical upward price channel and gives respect to their upper and lower trendlines. If the market loses its momentum on the ATH level of gold then it's a chance to move down and some retracement it. There is a big zone on the ATH T.F of gold that is 2400-2430. And if the market respects that zone then we see to reject price to lower trendline at 2380.

XAU-USD (Gold)The gold pair moves in a vertical upward price channel and gives respect to their upper and lower trendlines. If the market loses its momentum on the ATH level of gold then it's a chance to move down and some retracement it. There is a big zone on the ATH T.F of gold that is 2400-2430. And if the market respects that zone then we see to reject price to lower trendline at 2380.

BTC/USDT 4HInterval Chart ReviewHello everyone, let's look at the 4H BNB to USDT chart, as we can see the price has been moving in a sideways trend channel for a long time and currently we can see the price moving near the upper border of the channel, which is staying just above the local uptrend line.
Let's start by setting goals for the near future that we can include:
T1 = $594 - $611
T2 = $635
AND
T3 = $662
Now let's move on to the stop loss in case of further market declines:
SL1 = $570
SL2 = $542
SL3 = $519
AND
SL4 = $492
When we look at the RSI indicator and the STOCH indicator, we will see that there is still room for a continuation of the current downward movement.

ETH/USDT 4HInterval ChartHello everyone, let's take a look at the ETH to USDT chart considering the four-hour time frame. As we can see, the earlier entry into a long position resulted in an increase of about 6% at this point, at this point we can see an attempt to break out of the downward trend line, which could result in an upward movement towards the red zone. However, support for the coming days will be the previous resistance level around $3,000.

DXY (dollar index)The dollar index moved in a triangle pattern. Last week, the market tested his upper trendline. If the market tests the upper trendline then it is 106.500 level. Another thing is there is a resistance and supply area at 107.00 level. if the market does not respect the upper trendline then further move to 107.00 level and then reject.
