Potential Sharp Decline Looms for EUR/USD as USD StrengthensThe significant recovery of the US Dollar (USD) has interrupted the EUR/USD's rebound process after it reached a peak around 1.0690 on Thursday. This currency pair declined below the 1.0640 level in Friday's Asian trading session.
Based on technical analysis, the technical indicators are supporting the downward trend. The price of this pair is gradually recovering; however, it is still constrained by the SMA line. Additionally, the Relative Strength Index (RSI) is trading around the 40 level. If the price drops to this level, there is a possibility of a sharp decline.
Resistence

simple resistanceprice is testing last big resistance $30
fomo buying and sentiment have reached its limit with resistance at $30
if this level don't breakout with big support news then silver may have peak, like it bottom in auugst 2022 light years ahead of fed first rate cut
buy the rumor sell the news
old trend of rate cut is over
get ready for new trend of fiscal policy

"EUR/USD Continues Decline Below 1.0640 Amid Fed CommentsIn Friday's Asian trading session, EUR/USD continued to decline below the 1.0640 level after reaching a peak near 1.0690 on the previous Thursday. Comments from officials at the Federal Reserve (Fed) provided some support for the US Dollar, driving down the EUR/USD pair.
On the 4-hour chart, we observe that prices have tested all the SMA lines, indicating that the downward trend is gaining strength. This suggests that selling pressure is increasing in the market and the US Dollar is strengthening significantly against the Euro.

Gold Surges Past $2,400 After Israel-Iran EscalationThe price of gold has undergone a new wave of increase, surpassing the $2,400 mark in the Asian trading session on Friday following Israel's retaliatory attack on Iran.
Based on technical analysis, we observe that the upward momentum of gold continues after crossing the SMA 20 line. The Relative Strength Index (RSI) trading above the 60 level indicates that the upward trend is developing strongly and may persist in the future.

Gold Shows Signs of Recovery, Targets $2,400 MarkGold experienced a volatile session on Wednesday, dropping to $2,354 in the US trading session. Despite the price decrease, there are signs of a mild recovery. Expectations are high for gold to surpass the $2,400 mark.
Based on technical analysis, the price is gradually recovering and heading upwards. If the price continues to rise and surpasses the 60 level, it could be predicted that the price will reach the psychological threshold of $2,400 and continue its upward momentum to the previously established peak of $2,431.

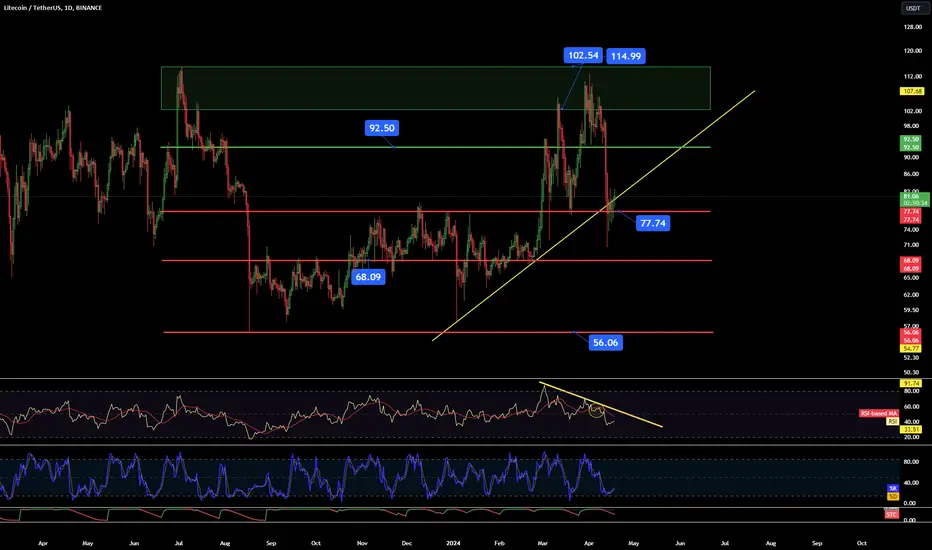
LTC/USDT 1DInterval ChartHello everyone, let's take a look at the LTC to USDT chart on a one-day time frame. As you can see, the price had a dynamic decline and a temporary descent below the upward trend line, but has now returned to the trend line level.
Let's start by determining the support line and as you can see, the price dropped and quickly returned to support around the level of $77.74, then there is an important support level at $68, and then a very strong support level at $56.
Looking the other way, you can see how strong the resistance level is again at $92.5, which may stop the price from rising again to the resistance zone from $102.5 to $115.
Looking at the RSI indicator, we can see how we remain in a downward trend and the confirmation of a return to the downward trend, while the STOCH indicator bounced off the lower end of the range with room to give a greater increase in the current price rebound.
Analyzing Bitcoin'sTrend: Corrections and Recovery SignalsOverall, Bitcoin (BTC) is still maintaining an upward trend. However, there are signs indicating that a correction is taking place. Looking at the chart, BTC is undergoing a correction process and showing signs of recovering from the downward phase. It is expected that the price may decline towards the vicinity of the 20-period Simple Moving Average (SMA), close to the 0.5-0.618 Fibonacci level.

USD/JPY Rebounds: Japan's Intervention Boosts USD/JPYThe strong recovery of the USD/JPY pair is attracting attention, reflecting Japan's intervention to temporarily address the weakness of the Japanese Yen (JPY).
Technically, on the chart, the strength of the upward momentum is clearly evident. The Relative Strength Index (RSI) is stabilizing around the 60 level, indicating a significant upward trend of this currency pair. Additionally, the price is gradually adjusting on the Simple Moving Average (SMA), signaling a positive indication of the potential continuation of the upward trend.

Bitcoin Correction Signals Shift to Bullish TrendOverall, BTC is experiencing a mild correction phase and showing signs of transitioning into an upward trend.
Based on technical analysis, on the chart, we see that the price of BTC is expected to continue testing the SMA 100 zone, especially at the 0.5 - 0.618 Fibonacci levels.

Strong Momentum: Japanese Intervention Boosts USD/JPYThe USD/JPY pair is currently demonstrating a strong upward momentum, attracting significant attention from investors. This increase is driven by momentum from Japan, particularly through interventions by the Japanese government and the Bank of Japan (BoJ).
Looking at the chart, we observe that the Relative Strength Index (RSI) is trading above the 60 level, a positive sign indicating that USD/JPY is on a strong upward trajectory.
However, investors need to exercise caution and continue monitoring economic conditions and fluctuations in monetary policy to make informed investment decisions.

GBP/USD's Rise Outlook, Targeting 1.2500 Resistance LevelThe British Pound (GBP) extended its gains to 1.2480 in Thursday's European trading session. The GBP/USD pair is experiencing a period of heightened increase, propelled by a strong adjustment in the US Dollar, alongside growing expectations that the Bank of England (BoE) will postpone interest rate cuts.
The GBP/USD pair is rebounding from the 1.2400 level and focusing on surpassing the psychological resistance level of 1.2500. The Relative Strength Index (RSI) is currently trading above the 60 level, a positive sign indicating that GBP/USD may continue its strong growth trajectory in the near future.

GBP/USD Extends Recovery Amid Dollar WeaknessThe GBP/USD is extending its recovery rally towards the 1.2500 level in Thursday morning's European session. This currency pair continues to be supported by the prolonged weakness of the US Dollar along with low-interest rates of US treasury bonds.
On the 4-hour chart, we observe that the GBP/USD has crossed above the 20-period Simple Moving Average (SMA), signaling positive signs of price recovery. If prices continue to rise and surpass both the SMA 50 and SMA 100, we can expect a stronger upward movement.

EUR/USD Seizes Recovery Opportunity Amid Dollar PressureThe EUR/USD currency pair is seizing the opportunity for recovery after a period of sharp decline. This resurgence is being strongly driven by the downward pressure on the US Dollar, opening up a wide door for the Euro to push prices back towards the highs.
The target for the EUR/USD pair is the vicinity of the SMA 50 area, close to the 0.5-0.618 Fibonacci level. This marks a significant step in restoring strength and momentum for the Euro, laying the groundwork for further growth phases.

EUR/USD Surges in Asian Trading, Driven by US Dollar WeaknessThe EUR/USD currency pair has surged higher, reaching the level of 1.0672 on Thursday at the start of the Asian trading session. This recovery is being strongly propelled by the downward pressure on the US Dollar, opening up a wide door for the Euro to recover and increase in value.
Looking at the chart, we can easily observe the transition from a downtrend to an uptrend. It is predicted that prices will continue to rise and reach the area near the 0.5 - 0.618 Fibonacci retracement level, closely approaching the Simple Moving Average SMA 50.

Chart Analysis: USD/JPY Correction and Test of SMA 20Although USD/JPY is still in an upward trend, the market is currently experiencing a notable correction phase.
Looking at the chart, it's evident that prices are rebounding and undergoing a downward adjustment, resulting in a certain level of volatility. It is expected that prices will test the SMA 20 moving average area before resuming a stronger upward momentum.

Bullish Outlook: GBP/USD Targets Psychological 2.500GBP/USD is holding its latest increase above 1.2450 in the European trading session on Wednesday. On the 1-hour chart, we see a positive signal as GBP/USD has surpassed both the simple moving averages SMA 20 and SMA 50. The prediction is that the price will surpass the SMA 100, which is a sign of a strong uptrend. And the target is aimed at the psychological level of 2.500.
Additionally, the Relative Strength Index (RSI) is increasing towards the 60 level, indicating a positive sign of the strength of the upward momentum. This increase could be a sign of further price increase before the market enters the overbought zone.

Short-Term Outlook: Potential Upside Correction in EUR/USDOverall, EUR/USD is currently reflecting a downward trend due to the strong growth pressure of the US dollar (USD). This pressure has pushed prices down near the 1.0620 level in the early Asian trading session on Wednesday.
However, technical analysis suggests that the market may experience a short-term upward correction. The possibility of prices rising to touch the SMA 50 area and approaching the 0.5 - 0.618 Fib zone indicates support for short-term price declines against the strong pressure of the US dollar (USD).

Chart Analysis: Gold's Downward Trend and Potential ReboundGold hit its lowest price of the week at 2,354 USD in Wednesday's US trading session, failing to surpass the 2,400 USD mark. The inability to reach the 2,400 USD milestone has cast uncertainty over Gold's upward momentum, leading to a decline in its price.
Looking at the 1-hour chart, we can observe the downward trend of the gold price based on trading below the Simple Moving Averages (SMA). Despite signs of adjustment and recovery, the market remains unstable. Predictions suggest that the price may recover to the SMA 100 level before continuing its sharp decline.

Technical Analysis: Downtrend in GBP/USDOverall, GBP/USD is still maintaining a downward trend. This currency pair continued to decline during Wednesday's US trading session.
Based on technical analysis, the Relative Strength Index (RSI) is currently trading around 40, which is often a sign that prices will continue to decline sharply.
In this context, investors need to be cautious and carefully consider their trading decisions, as the downward trend may persist and strengthen in the near future.

Analyzing Market USD/JPY: Japanese Intervention Risks At the beginning of Wednesday, the USD/JPY pair continued to hover below 155.00, a clear signal of the strength of the Japanese Yen. This stability is primarily supported by underlying risks of impending intervention from Japan. A slight decline in the US Dollar and US Treasury bond yields is also weighing on this currency pair.
However, chart analysis reveals that the price is still supported by an upward trend, bolstered by technical indicators such as the Relative Strength Index (RSI) and the Simple Moving Average (SMA). If the price breaks above the defensive level of 155.00, we could witness a strong upward momentum for this currency pair.

EUR/USD Analysis: Downward Momentum Holds as Dollar (USD) StrenOverall, EUR/USD is still maintaining a downward trend. EUR/USD has dropped to near the 1.0620 level at the beginning of the Asian trading session on Wednesday. This indicates the strength of the US Dollar compared to the Euro in recent times.
However, when looking at the technical charts, we can see some positive signals suggesting that the price may be preparing for a corrective phase. It is predicted that the price will test the SMA 20 area before it could bounce back and continue the downward trend.

Technical Analysis: Gold Market Continues Upward TrendDespite the fluctuations, Gold has maintained a stable upward momentum due to the crisis and political tensions in the Middle East region.
Investors continue to bet on the Federal Reserve's interest rate cut in July, currently placing bets at around a 41% likelihood.
Based on technical analysis, the upward trend of Gold appears likely to continue. On the 4-hour chart, the price of Gold is supported by the SMA 20 line and technical indicators such as the RSI also show positive signals. This suggests that the Gold market may continue its upward trend in the near future, providing opportunities for investors.

Chart Analysis: Rising Risk of Gold Price DeclineOverall, the price of Gold is still maintaining its upward momentum. In the Asian trading session on Tuesday, the price of gold continued to rise below the $2,400 mark.
However, political tensions in the Middle East are gradually easing, and strong economic data from China could potentially slow down the pace of gold's ascent.
Looking at the 4-hour chart, we also see an increasing risk of decline. The support level of the Simple Moving Average SMA 20 is currently at $2,356, while longer-term SMAs are indicating a loss of some upward momentum. Predicted that if the price surpasses the SMA 20 level and continues to decline towards the support levels of SMA 50 and SMA 100, there is a possibility that the price of gold will start a significant downward trend.
