AAVEUSD 1D ChartHello everyone, I invite you to review the current situation of AAVE in the USD pair. When we enter the one-day interval, we can see how the AAVE price will see a return above the main upward trend line, but here we can see that we are still below the formed downward trend line, which in the event of further increases may prove to be a strong resistance.
Here we can see how the current rebound is fighting the resistance at $ 256, only when the level is positively tested, resistance will be still visible at the price of $ 290, this will be a strong resistance right next to the downward trend line, only a positive exit from the top and staying above this trend line can lead to movement towards resistance at $ 339.
Looking the other way, we can see that when the trend reverses, we first have a support zone from $ 233 to $ 211, however, if this zone is broken, we can see a quick return of the price to the support area at $ 174.
The Stoch RSI indicator shows that despite the current upward movement, there is still room for the upward movement to continue.
Resistence

Still Positive
Immediate Resistance is around 149 - 150.
Sustaining this level will move it towards
170.

Bitcoin Chart Pattern Signals Possible Dip Before Pump!🚀 Hey Traders! 👋
If you’re finding value in this analysis, smash that 👍 and hit Follow for high-accuracy trade setups that actually deliver! 💹🔥
📉 #BTC – Potential Inverse Head & Shoulders in Play
Bitcoin is showing signs of a classic inverse head and shoulders formation on the daily chart. However, it's facing heavy resistance near the neckline around the $106,000 zone.
🧠 Possible Scenario:
A correction toward the GETTEX:92K –$93K range could complete the right shoulder before a potential breakout. If we see a clean bounce from that level, bulls might reclaim momentum.
⚠️ Invalidation:
A daily close above $106,000 would invalidate the structure and signal early continuation.
💬 What do you think of this setup? Drop your views and analysis in the comments below!

ETH is fighting in a strong resistance zone!Hello everyone, I invite you to review the current situation on ETH. When we enter the one-day interval, we can see how the ETH price came out on top from a strong downward trend.
Here we can see how the current bounce brought the movement closer to a very strong resistance zone from $ 2,090 to $ 2,310, in which we can currently observe a fight for further upward movement. Only when the price comes out on top, it can go towards resistance at $ 2,740, and then move towards strong resistance at $ 3,070.
Looking the other way, we can see that when the trend reverses, we first have support at $ 1,837, then a very strong support zone from $ 1,610 to $ 1,404 is visible, however, if this zone is broken, we can see a quick decline to the support area at $ 1,071.
On the RSI indicator we can see how strong the ETH price movement is visible intensively on the indicator and here we can see how we are approaching the upper limit, which could potentially slow down the movement or give a temporary relief.

LINK/USDT 4H Chart ReviewHello everyone, let's look at the 4H chart LINK to USDT, in this situation we can see how the price was moving in a downward channel, from which we saw an exit to the top and the formation of a new local uptrend line.
Let's start by defining the targets for the near future that the price has to face:
T1 = 15.08 USD
T2 = 16.87 USD
Т3 = 17.93 USD
Т4 = 19.07 USD
Now let's move on to the stop-loss in case the market continues to fall:
SL1 = 13.98 USD
SL2 = 13.12 USD
SL3 = 11.74 USD
SL4 = 10.76 USD
SL5 = 9.48 USD
If we look at the RSI indicator we can see how the price correction gave a strong rebound on the indicator, which could potentially give strength for new growth.

CAD/JPY Rally Could Fade Near Resistance – Watch for ShortsThe CAD/JPY pair is currently trading within a well-defined descending trendline. Multiple rejections are visible around the 108.300, 105.864, 105.434, and 105.044 levels, confirming strong bearish control over the medium term.
Price has recently bounced from a critical horizontal support near 101.246, forming a short-term bullish move toward the descending trendline. We are now approaching a confluence zone near the 103.800–104.000 area, where the downtrend line intersects. This zone is a potential supply area and could act as a strong resistance.
Trade Idea: Sell Setup Near Trendline (103.800–104.000)
Target: 102.532, 101.250
Invalidation: Break and close above 104.200

$TOTAL Crypto Market Cap BULL TRAP AlertBULL TRAP 🚨
New money has been coming into the market as shown on the Crypto CRYPTOCAP:TOTAL Market Cap, hence why you haven’t seen “rotations” in coins, but it appears to be drying up.
There’s been major resistance at the 200DMA, which is just below the previous ATH at $3T, and PA is being squeezed between the 9DMA.
Combine this with a heated RSI, it appears to be a bear flag in the making.
The trendline from Oct. ’23 gives confluence with the 50DMA as support.
*The only savior I see at this point is price smashing through the 200DMA and flipping support into the green accumulation box.
Regardless, this move is coming to an end later this week to test support or breakout.
Again, I’ll reconfirm my stance that this is the most obvious bull trap I’ve seen all cycle. Although I hope to be wrong 🥲
Having said that, after support is confirmed on the move, we are going to VALHALLA 🚀
Bookmark this 🤓

SOL/USD 1W Chart ReviewHi everyone, let's look at the 1W SOL to USD chart, in this situation we can see how the price came out sideways from the downtrend line which gave a bounce, however here it is worth paying attention to the trend line that was in force before the last price peak and here we can see that the price is still below this line.
Let's start by defining the targets for the near future that the price has to face:
T1 = 171 USD
T2 = 195 USD
Т3 = 218 USD
Т4 = 252 USD
Now let's move on to the stop-loss in case the market continues to fall:
SL1 = 134 USD
SL2 = 119 USD
SL3 = 95 USD
If we look at the RSI indicator, we can see how the bounce gave a return to the lower part of the range which still indicates that we have a lot of room to continue the started increases.

$BTC Bull Trap Clear As DayI’m probably the biggest 3-Year perma-bull on this app, and even I can tell this is most likely a bull trap.
This is either the beginning of the long awaited parabola, or else we’ll correct back down to at least the 200DMA in the next week, or the 50DMA within the next month.
Lack of volume on the move and RSI becoming overheated gives me feels for the latter
Remember, never trust a weekend pump 💯
Bookmark this.

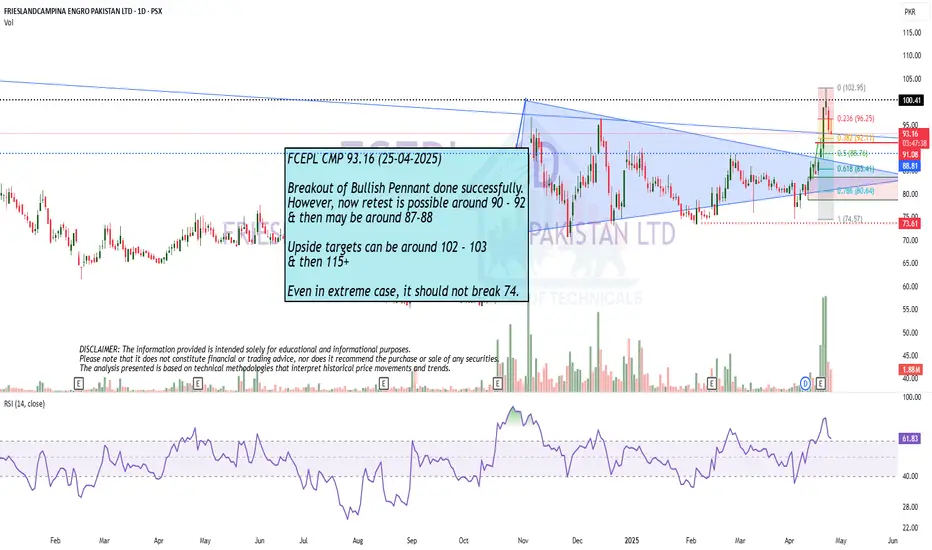
Breakout of Bullish Pennant done successfully.
Breakout of Bullish Pennant done successfully.
However, now retest is possible around 90 - 92
& then may be around 87-88
Upside targets can be around 102 - 103
& then 115+
Even in extreme case, it should not break 74.
NIVABUPANIVABUPA showing resistance breakout with decent volume and can go up to the recent arc curve depth ie approx 18%. It is very strong on weekly chart as well. Closing below 85 may change the view. keep it in your watchlist

ETH gives a strong exit from the descending channel!Hello everyone, I invite you to review the current situation on ETH, because you can see a significant rebound at the level of 30% from the last low. When we enter the four-hour interval, we can see how the ETH price moved in the local downtrend channel, from which we got an exit at the top, such a scenario often gives increases at the level of the channel height, which would bring the price closer to the levels of $ 2100.
Here you can see how the current rebound brought the movement closer to the resistance at the level of $ 1830, and then resistance is visible at the price of $ 1950, where the ETH price must then face a strong resistance zone from $ 2060 to $ 2100, where there could potentially be an upward movement after leaving the channel as in this case.
Looking the other way, you can see that when the trend reverses, we first have support at the level of $ 1730, but if it is broken, the ETH price may continue to fall and return to a strong support zone from $ 1480 to $ 1380.
It is worth paying attention to the MACD and RSI indicators because you can see how in the 4H interval we have gone beyond the upper limits of the ranges, which may translate into visible price consolidation on the chart in order to cool the situation.

Will BTC emerge from the local downtrend channel on top?Hello everyone, let's look at the 1D BTC to USD chart, in this situation we can see how the price is moving in a downtrend channel in which we can currently observe an attempt to exit on the top. In such a situation, it must be borne in mind that often exiting the channel gives energy for growth close to the height of the channel itself, which in this situation could give a valuation in the region of $ 100,000 for 1 BTC.
However, before this happens, the price must positively exit the channel and break the first resistance line at $ 88,800, and then a significant level at $ 94,200.
Looking the other way, when the price bounces off the upper boundary of the channel and starts to fall again, we have a visible support zone from $ 85,150 to $ 83,000, and then a second very strong zone from $ 77,200 to $ 74,100.

Currently Near Resistance.67 - 68 is a Very Strong Resistance.
We may witness Selling pressure towards
55 -58.
Though it is Currently Bullish, but Fresh
Entry is not recommended unless 68 - 69
is Crossed & Sustained with Good Volumes.

Will BTC emerge from the descending channel on top?Hello everyone, I invite you to review the current situation on BTC. On the one-day interval, you can see how the price is moving in the downtrend channel in which there is again a fight with the upper boundary of the channel. At this stage, you can also see how the EMA Cross 50/200, they have come very close but still indicate the maintenance of a long-term upward trend.
Here you can see how the price has currently bounced off the resistance zone from $ 86,503 to $ 87,934. Only an upper exit from this zone will open the way towards the second important zone at the levels of $ 93,959 to $ 96,142, and then we have visible strong resistance around $ 101,800.
Looking the other way, you can see that in the event of further declines, we have support at $ 80,550, then you can see an important zone that previously maintained the price decline from $ 74,340 to $ 71,380, in a situation where this zone is broken, we can see a quick decline to around $ 65,360.
The MACD indicator shows an attempt to switch to an upward trend, it is worth watching whether there is enough energy for further movement.

LTC/USDT 1W ChartHello everyone, I invite you to review the current situation on LTC. When we enter the one-week interval, we can see how the price is struggling to return above the upward trend lines.
Here you can see how the current rebound is going towards resistance at $ 82.82, then resistance is visible at $ 95, but an important resistance point will be around $ 115.
Looking the other way, you can see that the price has gone below the support level at $ 70, however, we could see a quick rebound, in a situation where the price continues to go down, the next very strong support is around $ 50.
It is worth looking at the RSI indicator, which shows another descent in the week interval to the level where we could previously see strong price rebounds, which could potentially repeat itself.

Will the support zone keep BTC falling?BTC has once again bounced off the upper border of the downtrend channel. Here, it is worth remembering the long-formed gap around $74,500, which was closed during the last decline.
Here, you can see how the price fell into a strong support zone from $77,742 to $73,980, but if this zone is broken, we can again see a strong decline around also very strong resistance and the lower border of the channel at $68,590.
Looking the other way, you can see that the increases were stopped by the resistance zone from $84,000 to $86,700, only breaking out of this zone at the top will give the possibility of growth towards strong resistance at $94,300.
The RSI is still in the lower part of the range and is again heading towards the lower borders, but here the price has formed a lower low, which can still give another reaction.

Will ETH finally change direction?ETH is approaching support at $1,559, but here you can see how the price has fallen below the upward trend line, which could have resulted in a stronger rebound. When support is broken, you can still see a strong support level at $997, to which we can see a decline.
Only when the trend changes direction will ETH have to face resistance levels at $1,889, then $2,151, and then $2,560 before we see any major upward movements.
The Stoch RSI indicator shows us moving along a line where we could previously observe strong price rebounds, while the RSI indicator itself, taking into account the interval of one weekend, shows us approaching the level we last touched during the bear market bottom.

Weekly Closing not Good but..Weekly Closing not Good but
the Stock is Still Bullish on Bigger
Time Frames.
Price dropped with Low Volumes.
Weekly Important Support seems to
be around 42.50 - 44.10
49-50 is an Important Resistance as
of now.

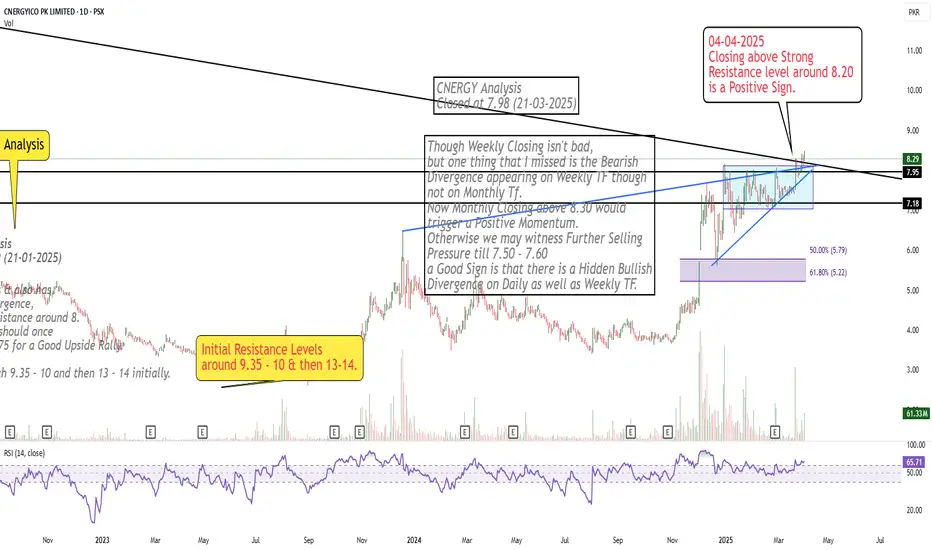
Crossed Important Resistance Area
Closing above Strong
Resistance level around 8.20
is a Positive Sign.
$MSTR $320 resistance retest Short term calls. Looking for a move to the upside to retest a resistance level of $320 area and see how it reacts. Crypto could be an outlier amidst tariff rhetoric.
WSL

GOLD → Growing economic risks increase interest ↑FX:XAUUSD rallied aggressively due to high interest driven by rapidly rising economic risks, mainly related to Trump's tariffs. For selling, the risk is very high, with the stock and cryptocurrency market declines only adding to the interest in the metal
Markets are taking refuge in defensive assets amid WSJ reports of Trump's possible tariff hike of up to 20% for most US trading partners. This could trigger inflationary pressures and stagflation, weakening the dollar and bond yields, which supports the gold price.
This week all eyes are on Trump's speech on Wednesday, PMI, NonFarm Payrolls and Powell's speech
Technically, it is not worth selling now as it is high risk, and for buying we should wait for a correction to key support levels
Resistance levels: 3127
Support levels: 3103, 3091, 3085
We are not talking about any trend reversal now. It is worth waiting for a local correction or consolidation, the market will mark important levels, liquidity zones or imbalances against which you can build a trading strategy. Gold will continue to grow because of the strongly increasing risks.
Regards R. Linda!

Gold/EUR Analysis –Bearish Continuation from Channel Resistance📉
Market Structure & Trend
The chart represents a descending channel where price has continuously rejected from the upper boundary.
Multiple lower highs and lower lows indicate a bearish trend.
Gold/EUR has once again reached the channel resistance and failed to break above, suggesting a strong sell opportunity.
Key Technical Levels
🔴 Resistance:
2,809 - Local resistance where price has faced rejection multiple times.
2,849 - Major resistance level, a break above this could invalidate the bearish outlook.
🟢 Support & Target Levels:
2,790 - Short-term support; if broken, further downside is expected.
2,740 - First key target where previous demand is present.
2,660 - Major support and final bearish target if selling pressure continues.
Trade Setup & Strategy
📍 Sell Below: 2,790
🎯 Target 1: 2,740
🎯 Target 2: 2,660
❌ Stop-Loss: Above 2,810
Conclusion
Bearish bias remains strong as long as price stays below 2,809.
A breakdown below 2,790 could accelerate selling pressure.
Traders can look for bearish confirmation signals (e.g., break of structure, candlestick patterns) to enter short positions.
Would you like a refined strategy based on lower timeframes?
