Daily BTC 4HChart - resistance and supportHello everyone, let's look at the BTC to USDT chart on a 4-hour timeframe. As you can see, the price is holding at the local uptrend line.
Let's start with the support line and as you can see the first support in the near future is $ 26829, if the support is broken then the next support is $ 26637, $ 26408, and then we can see a drop to around $ 25718.
Now let's move to the resistance line, as you can see the first resistance is $ 26952, if you manage to break it, the next resistance will be $ 27133, $ 27311 and $ 27912.
Looking at the CHOP indicator, we see that there is energy for the continuation of the move, the MACD remains in a downtrend, while the RSI has room for the price to go up more in the short term.
Resistence

ASTRUSDTASTRUSDT break through the long term resistance with strong bullish move.
Will ASTRUSDT sustain the momentum?

Daily ETH 4HChart - resistance and supportHello everyone, let's look at the ETH to USDT chart on the 4-hour time frame. As you can see, the price is moving in the downtrend channel.
Let's start with the support line and as you can see the first support in the near future is $1754, if the support is broken then the next support is $1695, $1650 and then we have a support zone from $1601 to $1533.
Now let's move to the resistance line, as you can see the first resistance is $1924, if you manage to break it the next resistance will be $2035 and $2127.
Looking at the CHOP indicator, we see that there is a lot of energy on the short interval, the MACD is on the verge of returning to the downtrend, while the RSI is moving in the middle of the range, which makes it difficult to clearly determine the direction of the price.

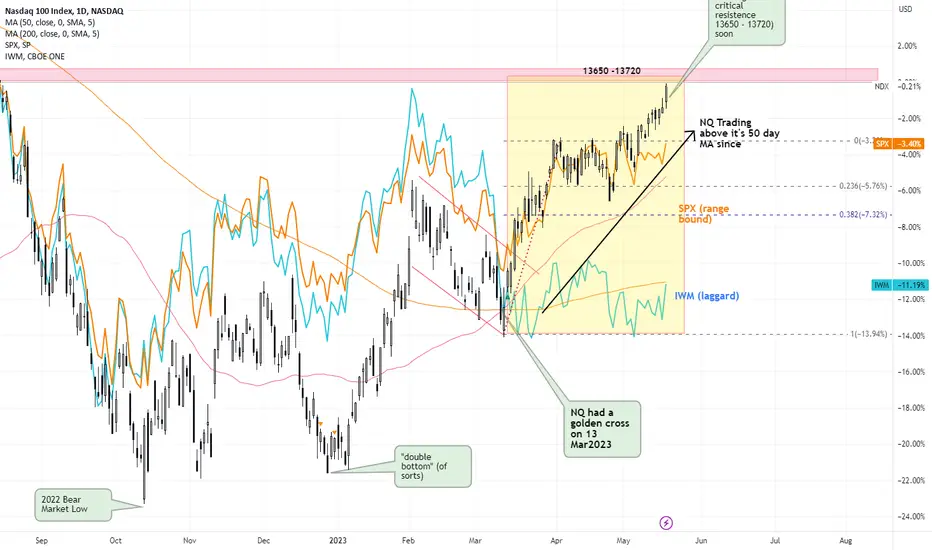
NQ - Bull intact but approaching near term resistence Despite a generally choppy market since February this year, Nasdaq had a Golden Cross on 13 March which turned out to be sustainable and some encouraging signs are also observed since:
1. NQ began to lead the other indices (namely SPX and IWM), a sign of a "risk off" sentiment as it means more money had been piling back into "riskier" tech & discretionary stocks
2. NQ had stayed above it's 50 day moving average (> 2 months now) with rather "shallow" retracements no more than 38% of each mini swing.
3. However, SPX was mostly stuck in a range for the past 1.5 months (despite being above it's 200 day MA), hence it can still make trading the wrong stocks rather frustrating.
4. IWM (Russell 2000, ie., small caps) has been the laggard, still unable to rise (much, if at all). This is normal during an "early" bull market.
Small caps usually begin to rise in a more sustainable manner when the bull market is well underway, and should they start to get extremely bullish, then it is usually a sign that a market top might be in the horizon.
Now that Nasdaq has been taking leadership (especially the FAANGS) for the past 2 months+, the sentiment remains sanguine.
Some caution now as it is approaching a critical resistence zone 13650 - 13720 (prior peak in Aug2022), and some pullback in the near term will not be too surprising
The depth of the next retracement going forward will give a clue if the uptrend is still intact.
Should NQ be able to clear this resistence zone (13720) eventually, then the overall market sentiment could get a good boost (including the small caps). Perhaps the resolution of the Debt Ceiling could be the catalyst?
But until then.
Just my take. Let's see :)
Disclaimer: Just my 2 cents and not a trade advice. Kindly do your own due diligence and trade according to your own risk tolerance and don't forget that money management is important! Take care and Good Luck!
Daily BTC 1DChart - resistance and supportHello everyone, welcome to Thursday's Cryptocurrency Review. Let's start by checking the current situation on the BTC pair to USDT, taking into account the one-day interval. First, we will use the blue lines to mark the uptrend channel in which the BTC price is moving at the lower limit.
Now we can move on to marking the places of support in the event of a correction. And here in the first place we have support that currently holds the price at $ 26692, then it is worth marking a strong support zone from $ 25298 to $ 23979, however, when we fall below this zone, we can see a drop around $ 22002.
Looking the other way, in a similar way, using the fib retracement tool, we can determine the places of resistance. First, the price has to break through the strong resistance zone from $ 29050 to $ 29887, when it manages to break it, we have strong resistance at $ 31053. When it manages to overcome it, the price will be able to move towards the resistance at $ 34324.
Next, it is worth looking at the EMA Cross 10 and 30, which so far indicate a downtrend.
Please pay attention to the CHOP index which indicates that most of the energy has been used, the MACD indicator indicates the maintenance of the local downtrend, while the RSI after rebounding, a small price increase will give a visible movement on the indicator, which may pull the price lower around the previously defined support zone.

SOL/USDT 4HChart - resistance and supportHello everyone, let's look at the SOL to USDT chart on a single day time frame. As you can see, the price is moving below the local downtrend line.
Let's start with the support line and as you can see the first support in the near term is $19.84, if the support is broken then the next support is $18.16 and $16.01.
Now let's move on to the resistance line, as you can see the first resistance is $21.20, if you manage to break it, the next resistance will be $22.10, $22.87 and $23.62.
Looking at the CHOP indicator, we see that there is still energy to continue the move, the MACD remains in a downtrend, while the RSI, despite the rebound, still has room for the price to go lower.

USDCAD - NEW BEARISH MOVE📉Hello Traders👋🏻
The USDCAD Price Reached a Resistance Line
The Price Failed To Create New Higher High📈
So, I Expect a Bearish Move📉
i'm waiting for Confirmation...
-----
TARGET: 1.33480🎯
___________
if you agreed with this IDEA, please leave a LIKE, SUBSCRIBE or COMMENT!

BNB/USDT 4HInterval Resistance and SupportHello everyone, let's look at the BNB to USDT chart on a 4-hour time frame. As you can see, the price is moving above the local uptrend line, however, on the EMA Cross 10 and 30 we see an attempt to return to the downtrend.
Let's start with the support line and as you can see the first support in the near future is $309.7, if the support is broken then the next support is $305.6, $302.2 and $299.
Now let's move on to the resistance line, but here we will first mark the $313 to $315 resistance zone, then we have the second $317 to $319 resistance zone, then strong resistance at $321.2
Looking at the CHOP indicator, we see that the collected energy is used for the initiated price correction, the MACD indicates a transition to a local downtrend, while the RSI shows a rebound, however, there is room for the price to go lower.

BTC WEEKEND PLAN! A QUICK UPDATE!!Hello everyone, if you like the idea, do not forget to support it with a like and follow.
Welcome to this quick BTC update. Currently, BTC is trading around the $26.8k level. It is forming a descending channel in 1hr time frame.
If we look at the higher time frame then it breaks below the important support of $26.8k which is a bearish sign for me. Now, the next important support area is around $24k- FWB:25K
Now, if we look at the lower time frame then there is a possibility that we see a quick bounce on Sunday to trap more retailers and dump again next week.
Observe the chart carefully to know more.
Invalidation:- If we got a weekly close above $27.2k
If you like this idea then do support it with like and follow.
Also, share your views in the comment section.
Thank You!

Daily BTC 4HChart - resistance and supportHello everyone, let's look at the BTC to USDT chart on a 4-hour timeframe. As you can see, the price has moved above the local uptrend line, and the EMA Cross 10 and 30 are on the verge of entering an uptrend.
Let's start with the support line and as you can see the first support in the near future is $ 26723, if the support is broken then the next support is $ 26129 and $ 25661.
Now let's move on to the resistance line, as you can see the first resistance is $ 27534, if you manage to break it, the next resistance will be $ 28002 and $ 29382.
Looking at the CHOP indicator, we see that there is still some energy left for further movement, the MACD maintains the local uptrend, while the RSI is approaching the upper limit, which may slow down the growth and give a recovery.

BNB/USDT 4HInterval Resistance and SupportHello everyone, I invite you to review the BNB chart in pair to USDT, on a one-day timeframe. First, we will check the EMA Cross 10 and 30, where we can see confirmation of the transition to an uptrend. Now, using the blue lines, we will mark the downtrend channel where the price has been moving for a long time.
Moving on, we can move on to marking support areas when we start a larger correction. And here, the first support is at $307, the second very strong support is at $301, the third support is at $297, and then the fourth support is at $292.
Looking the other way, we see that the price has reached an important resistance zone from $ 314 to $ 318, which so far has no strength to break. However, if it manages to break out of this zone upwards, the next resistance will appear at the price of $322, and then we can see a strong increase to around $335.
At this point, it is also worth marking the local downtrend line from which the price went up.
Please look at the CHOP index, which indicates that we have a lot of energy for further movement, the MACD confirms the local uptrend, while the RSI shows a visible increase, it is worth being careful here, because price corrections often occur at the upper end of the range.

Daily BTC 4HChart - resistance and supportHello everyone, I invite you to review the current situation on the BTC pair to USDT, taking into account the four-hour interval. First, we will use the blue lines to mark the downtrend channel, while locally, we can see that the price has broken the local downtrend line.
Now we can move on to marking the places of support in the event of a correction. And here in the first place we have significant support at $ 26595, but if the support does not hold the price, then we have another support at $ 25998, then third support at $ 25526, and fourth support at $ 25045.
Looking the other way, in a similar way, using the trend based fib extension tool, we can determine the places of resistance. First, we see that the price is fighting a strong resistance at the level of $ 27512, which so far has no strength to break, the next resistance is at the price of $ 27984, when we manage to overcome it, we can see a strong increase in the price around $ 29320.
Please pay attention to the CHOP index which indicates that the energy is gathering strength, the MACD indicator indicates that we are moving in a local uptrend, while the RSI shows an increase in the upper part of the range, so you should watch if we touch the upper limit, which could give a change again downward trend.

DOT/USDT 1D Interval ReviewHello everyone, let's look at the DOT to USDT chart on a one-day time frame. As you can see, the price is moving below the downtrend line.
Let's start with the support line and as you can see the first support in the near future is $5, if the support is broken then the next support is $4.72, and then the third support at $4.50.
Now let's move on to the resistance line, as you can see the first resistance is at $5.56, if it is broken then the next resistance will be at $5.83, the third at $6.05 and the fourth at $6.27.
Looking at the CHOP indicator, we see that the energy is gathering strength, the MACD remains in a downward trend, while the RSI is moving at the lower limit, which affected the slowdown of the correction.

Daily ETH 4HChart - resistance and supportHello everyone, let's look at the ETH to USDT chart on a single day time frame. As you can see, the price is moving below the uptrend line.
Let's start with setting the support line and as you can see the first support which, as you can see, held the price is $ 1737, if the support is broken then the next support is $ 1658, and then $ 1436.
Now let's move to the resistance line, as you can see the first resistance is $ 1918, if you manage to break it, the next resistance will be $ 2034 and $ 2123.
Looking at the CHOP indicator, we see that there is still some energy left for a further move, the MACD remains in a downtrend, while the RSI shows an entry into the lower part of the range, but there is still room for the price to go lower.

GBPUSD short ideaGBPUSD SHORT Opportunity
Hello FX traders, here's a chance to Sell the GBPUSD pair.
Despite the BIG rise recently, the price behavior showed some weakness since the beginning of this year, as it started to show lower highs and lower lows.
What reinforces the expectations of the decline are the fluctuating conditions in the United Kingdom, which will be reflected sooner or later in the pound sterling price against the rest of the currencies.
In this analysis, I rely on the trend line drawn above the price, in addition to the price being the May 2022 peak (1.26500).
The opportunity will be active when the price hits 1.2650
TP1: 1.2470
TP2: 1.2280
SL: 1.2730
Goodluck.

Litecoin - Scenarios To Watch 👀What's up, traders! In today's market breakdown, we're mapping out our latest levels to watch for on the Litecoin 1H chart.
Let's dive right in...
Ticker: LTCUSDT
Date: 05/12/23
Timeframe: 1H
Supply: 83.82-85.24 (1st red zone), 89.07-89.86 (2nd red zone)
Key zone: 81.41-82.00 (grey zone)
Demand: 75.18-77.74 (green zone), 65-67.58 (green zone)
Commentary:
LTCUSDT seems to be one of the few cryptos that have established a low on this move down and continues to respect demand down at these lows. This means it could be one of the tickers to play now that we have established new demand and supply levels.
Currently it seems to be respecting this ~82 level grey zone as supply but if this 75.18-77.74 demand holds up it is only a matter of time that this zone gets broken. There are a few trades we could target from here:
✅ Bullish Scenario 1: you want to see price pull back into the demand zone ~75.18-77.74 and buyers to emerge again for an upside move, possibly into ~81.41-82 key zone or higher into supply at ~83.82-85.24. This is the safer upside play.
✅ Bullish Scenario 2: you want to see price break above ~81.41-82 key (grey) zone, pull back to retest this zone and turn it into demand to catch a break and retest for a further upside move, potentially into supply at ~83.82-85.24.
✅ Bullish Scenario 3: you want to see price rally and break both this key (grey) zone and supply level at ~83.82-85.24, pull back to retest ~83.82-85.24 zone and turn it into demand to catch a break and retest for a further upside move potentially into next supply at ~89.07-89.86.
🟥 Bearish Scenario 1: you want to see price approach this key (grey) zone at ~81.41-82, sellers to regain control as they have done since Wednesday this week, and possibly catch a retest of this zone into demand at ~75.18-77.74 again. This will be the safer downside play if it sets up soon.
🟥 Bearish Scenario 2: you want to see approach supply at ~83.82-85.24, show weakness, possibly retest this zone and reject again for a move down into the grey zone or further down into demand.
🟥 Bearish Scenario 3: you want to see price break below demand at ~75.18-77.74, pull back up to retest and turn this zone into supply for further downside into March lows. There is a demand zone at ~65-67.58 so be cautious of that.
That's all we got for you in this one.
So what do you think? Are you bullish or bearish?
Let us know in the comments below!
We'll see you in the next one.
-The AlgoBuddy Team

Morning star!Given the Morning star candlestick pattern as well as the very strong resistance and the 0.236 fib, there is probably room for upside, just wait and enter the market at the right time...

Daily BTC 1DChart - LONGTERMHello everyone, I invite you to every Friday review of the BTC chart on a one-day interval. Let's start by marking the main uptrend line with a yellow line, and as we can see, the price remains above it despite the current correction. Next, it is worth marking the local downtrend channel in which we are currently moving.
At this point, it is worth separating the upward movement into two stages and we can see that when we spread the Fib Retracement tool on the first one, we will notice that during the first upward movement, the correction reached the level of 0.618 FIB, which was a very strong support for the price. Now we can move on to the second stage of the current increases, but here we will start by marking the uptrend channel from which the price went down, in such a situation you can often observe the price going down by the height of the trend channel, and as you can see we are approaching this place. Now we will spread the Fib retracement grid from low to high to see what level the price can reach in the current correction. As in stage one, the price is approaching a strong support zone from $ 25342 to $ 23964, however, when the price falls below this zone, the next strong support is at $ 22088.
Now we can move on to checking what resistance the price has to overcome in order to continue the bullish trend. However, we will not mark individual resistances, because in this situation, the price must first break through the very strong resistance zone from $ 28832 to $ 32467, only when the price breaks out and then the zone is positively tested, we will be able to see further increases in the market.
As we can see further, the price, despite the correction, remains above the 200 EMA Cross, which indicates the maintenance of a long-term uptrend.
Index Chop indicates that there is still energy to continue the move, MACD remains in a downtrend, while the RSI is approaching the lower limit of the range, which usually indicates an upcoming trend reversal, but please remember that in the short term the price may go lower to the previously marked zone.

BNB/USDT 4HInterval Resistance and SupportHello everyone, let's look at the BNB to USDT chart on a 4-hour time frame. As you can see, the price is moving below the local uptrend line.
Let's start with the support line and as you can see the first support that is currently holding the price is $ 303.4, if the support is broken then we can see the price drop to around $ 274. At this point, it is worth marking a strong resistance zone from $ 304 to $ 297, taking into account the entire upward movement.
Now let's move to the resistance line, as you can see the first resistance is $ 313, if it breaks down, the next resistance will be $ 320.6, $ 326.4 and then we have a strong resistance zone from $ 332 to $ 341.
Looking at the CHOP indicator, we see that there is still some energy for the move, the MACD maintains a downward trend, while the RSI has touched the lower limit, which may give a temporary price increase, but in the longer term I expect a further correction.

Daily BTC 4HChart - resistance and supportHello everyone, as most of the interested have already heard BTC has a very busy network, so we will check what to expect in the coming hours. As you can see, the price is moving below the downtrend line.
Importantly, the price is holding around an important resistance at 0.618 FIB, while the next significant support is at $ 26858, which is seen to have held the price before, followed by a third support at $ 25984.
Now let's move on to the resistance line, as you can see the first resistance is $ 27971 which is likely to be attacked by btc again, the next resistance will be $ 28377 and then we have a strong resistance zone from $ 28711 to $ 29221.
Looking at the CHOP indicator, we see that there is still energy for the next move, in addition, the MACD indicates a transition to a local downtrend, and the RSI returns to the lower part of the range, which may indicate that we may see an upward rebound in the short term. However, in the long run, the price may be pulled down.

LTC/USDT 4HInterval in correctionI invite you to review the LTC chart in pair to USDT, so on the four-hour interval, we will mark the downtrend channel in which the price is moving with blue lines, but here we can observe that during today's review we are witnessing a strong market rebound.
Moving on, we can move on to marking the support areas when the initiated correction begins to deepen. And here, the first support that is currently holding the price is at $77.61, the second support is at $74.9, the third support is at $72.71, and we still have support at $70.46.
Looking the other way, we see that we need to go through a big strong resistance zone from $79 to $83 first, then we have resistance at $85.17 and then move towards $91.41.
Please look at the CHOP index, which indicates that a lot of energy has been collected, MACD indicates that despite the correction, we maintain a local uptrend, while the RSI after today's increase is a strong rebound.

EURAUD - Support Becomes Resistance📉Hello Traders👋🏻
On The Daily Time Frame The EURAUD Price Reached A Support Level (1.63148-1.62212) !
Currently, The Price Broke The Key Level (Support Level Becomes New Resistance Level)
If Price Stays Under The Key Zone,
EURAUD Can Continue The Bearish Move📉
-----------
TARGET: 1.60700🎯
___________
if you agreed with this IDEA, please leave a LIKE, SUBSCRIBE or COMMENT!

Daily BTC 4HChart - resistance and supportHello everyone, I invite you to checking the current situation on the BTC pair to USDT, taking into account the four-hour interval. First, we will use the yellow lines to mark the local triangle in which the price is currently moving.
Now we can move on to marking the places of support in the event of a correction. And here, in the first place, it is worth marking a very strong support zone from $ 28038 to $ 27560 in which the price is currently located, but when we fall below this zone, we can see a drop around $ 26882 and even $ 26022.
Looking the other way, in a similar way, using the trend based fib extension tool, we can determine the places of resistance. First, we will mark the resistance zone from $ 28659 to $ 29195, when it manages to break it, the price will have to break through the resistance at $ 29711, and then the third resistance at $ 30466 only when it breaks out above and then positively tests it, we will be able to see further increases.
Please pay attention to the CHOP index, which on the four-hour interval indicates that there is still a lot of energy for the move, the MACD indicator indicates entering a local uptrend, while the RSI shows a visible rebound and room for the price to go higher.
