XLM MAY 2023 PRICE?XLM will fall around 0.8 around middle of May 2023
I will buy in & rise with XLM!
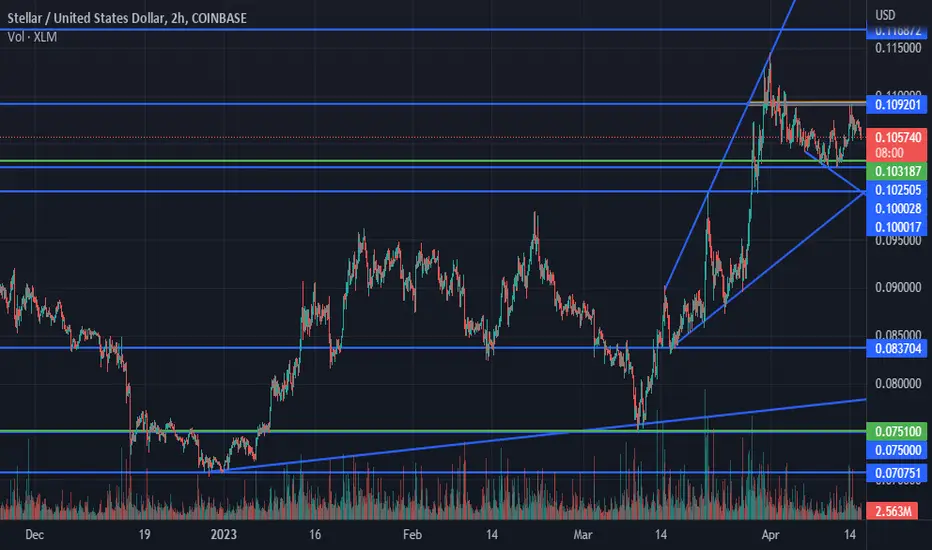
Resistence

ETH MAY 2023 PRICE?ETH will fall around 1,550 around middle of MAY 2023
I will buy in & rise with ETH!

BTC MAY 2023 PRICE?BTC will fall around 23,000 around middle May 2023
I will buy in & rise with BTC!

EURUSD Forecast Navigating Supply and DemandIn our previous EUR/USD technical outlook, we discussed the possibility of the 1.0851 supply level turning into a demand level. On 10th April 2023, the price rejected this level, setting the stage for a push higher.
Chart Analysis: EUR/USD Resistance and Support
The daily EUR/USD chart shows the price reacting off the resistance zone around the 1.10422 level, with a support zone at 1.09098. If this support is invalidated, we can expect the price to test the next support at 1.07088. The 4-hour chart reveals a bearish divergence, and the 1-hour chart indicates a potential pull-back with the MACD below its zero line.
Economic News Impacting EUR/USD
The Euro will be affected by the ZEW economic sentiment and higher Euro Area inflation in the coming week. These factors, alongside hawkish ECB rhetoric, may impact the EUR/USD pair in the short term. The currency pair recently hit a yearly high of 1.1075, but a consolidation period may be needed before further upward movement.
Stay updated on the latest EUR/USD news and analysis by checking out real-time rates, interactive charts, and expert insights.
Upcoming Economic News
Keep an eye on the economic news scheduled for the week, including:
Mon, Apr 17: USD Empire State Manufacturing Index & EUR ECB President Lagarde Speaks
Tue, Apr 18: EUR German ZEW Economic Sentiment
Thu, Apr 20: USD Unemployment Claims, USD Philly Fed Manufacturing Index, USD FOMC Member Waller Speaks, and USD Existing Home Sales
Fri, Apr 21: EUR French Flash Manufacturing PMI, EUR French Flash Services PMI, EUR German Flash Manufacturing PMI, EUR German Flash Services PMI, EUR Flash Manufacturing PMI, EUR Flash Services PMI, USD Flash Manufacturing PMI, and USD Flash Services PMI
By monitoring technical analysis and upcoming news, traders can make more informed trading decisions in the EUR/USD market.


BTC 4/16/2023 10.31 amThe line in the sand is drawn!
BTC must break and hold above 30,500 & the BULL is BACK!
Comment, Like, Share!
THANKS!

XLM 4/16/2023 @ 8.58 amXLM will fall to 0.103264 I will buy in! XLM will rise to 0.1092 I will sell 5.74% move!
Comment, Like, Share!
THANKS!

XLM 4/15/2023 @ 9.51 pmXLM will fall to 0.10 & I will buy in! XLM will rise & I will set some sell stop limits!
:)
Bitcoin Short-Term Support & Resistance AnalysisPrices move because of supply and demand . When demand is greater than supply, prices rise. When supply is greater than demand, prices fall. Sometimes, prices will move sideways as both supply and demand are in equilibrium.
When support and resistance lines are broken, there is a high possibility of a significant uptrend in that direction. Be aware of the stop-loss area when trading on margin
ⓡ Resistance Line 30221$
ⓢ Support Line 28580$
ⓢ Support Line 28216$
ⓢ Support Line 27867$
The above price level represents an important tipping point, not an absolute analysis for buying and selling. You must be careful about your investment decisions.
Thank you for reading my poor analysi

Daily ETH 4HChart - resistance and supportHello everyone, let's look at the ETH to USDT chart on the 4-hour time frame. As you can see, the price is moving above the local uptrend line.
Let's start with the support line and as you can see the first support in the near future is $ 2065, if the support is broken then the next support is $ 2024, $ 1990 and $ 1958.
Now let's move on to the resistance line, and here we first have a resistance zone from $ 2111 to $ 2129, if it breaks out the next resistance will be $ 2182 and $ 2269.
Looking at the CHOP indicator, we see that the energy is gaining strength, the MACD indicates entering a local downtrend, while the RSI remains at the upper limit, which may also indicate the need for a price rebound.

BTC 4/13/2023 @ 3.51 pmIf BTC can hold 30,200, Were in an upward trend micro view BULL MODE!
COMMENT LIKE SHARE!
THANKS!

BTC 4/15/2023 10.47 amIf BTC can hold 30,200, Were in an upward trend micro view BULL MODE!
COMMENT LIKE SHARE!
THANKS!

BTC 4/15/2023 8.18 amBTC must hold 35,000 & stay above for a few days! BEAR MODE!
COMMENT LIKE SHARE!
THANKS!

Pain Points Ahead: Why Ethereum Investors Should Be Cautious Ethereum's recent price movements have been bullish, but I believe that a resistance mark is looming in the next week or so, which could cause the price to head downwards. Consequently, Icaution against buying into Ethereum at this time, as I believe that the downside risk outweighs the potential for upside in the near term. We must also consider the importance of other time frames when interpreting technical indicators like the Ichimoku Cloud, which currently suggests strong upwards momentum.
If Ethereum can break through the resistance point, it may still have the potential for further upside. It is essential to note that market analysis is subjective and can vary based on different perspectives, and investing involves risk. Thus, it is crucial to conduct thorough research, analyze multiple indicators.

BTC 4/14/2023 8.33 pmBTC must hold 35,000 say above for a few days! BEAR MODE!
COMMENT LIKE SHARE!
THANKS!

The Bear Market Looms: Is Ethereum in Trouble?Technical analysis using the Ichimoku cloud indicates that Ethereum is approaching a resistance level around the HKEX:2 ,200 price range. This resistance level suggests that Ethereum's price may experience a pullback or even lower lows from this point.
The Ichimoku cloud is a technical analysis tool that uses a combination of indicators to identify support and resistance levels. It is made up of several lines that provide information about price momentum, trend direction, and potential reversal points. When the price is above the cloud, it indicates that the trend is bullish, while when it is below the cloud, it is bearish. In Ethereum's case, the cloud is indicating resistance around the HKEX:2 ,200 price range, which could result in a pullback or even lower lows from this point.

BTC 4/14/2023 10.45 amBTC should go down and test around 28,500 around 4/16/2023 BEAR MODE!
COMMENT LIKE SHARE!
THANKS!

BTC 4/14/2023 10.42 amBTC should go down and test around 28,500 around 4/16/2023 BEAR MODE!
COMMENT LIKE SHARE!
THANKS!

DOT/USDT 4HInterval Resistance and SupportHello everyone, I invite you to review the DOT chart on the four-hour interval. As we can see, the price is moving in the uptrend channel.
Let's start by marking the support spots for the price and we see that we first have a support zone from $6.46 to $6.21, however if the price goes lower we have a second support zone from $6.01 to $5.80.
Looking the other way, we can similarly determine the places of resistance that the price has to face. And here we see that the price is currently fighting a strong resistance at $6.85 equal to 0.618 Fib. We continue to have a strong resistance at $7.31, once the price breaks it, it will move towards the resistance at $7.90.
The CHOP index indicates that the energy has been used up, the MACD indicates that the uptrend is maintained, while the RSI has crossed the upper limit of the range, which, according to our rule, often ends with a price rebound and so we see a small correction.

Daily BTC 4HChart - resistance and supportHello everyone, I invite you to check the current situation on BTC in pair to USDT, taking into account the interval of four hours. First, we will use blue lines to mark the local uptrend channel in which the BTC price is moving in the upper limit.
Now we can move on to marking the places of support in the event of a correction. And here, in the first place, it is worth marking the support at $ 30592, when we go lower, the second support is at $ 30318, then we have a strong support zone from $ 30072 to $ 29826, and then support at $ 29523.
Looking the other way, in a similar way, using the trend based fib extension tool, we can determine the places of resistance. The price must first break the first resistance at $ 30911, when it manages to break the second resistance is at $ 31311, then $ 31694 and then the resistance at $ 32258.
Please pay attention to the CHOP index which indicates that most of the energy has been used, the MACD indicator indicates the maintenance of the local uptrend, while the RSI is moving above the upper limit of the range, despite slight increases, we can still expect an upcoming rebound that will cool down the indicators before further increases.

Daily BNB 4HChart - resistance and support - shorttermHello everyone, let's look at the BNB to USDT chart on a 4-hour time frame. As you can see, the price is moving above the local uptrend line.
Let's start with the support line and as you can see the first support in the near future is $ 332, if the support is broken then the next support is $ 329, $ 327 and $ 325.
Now let's move to the resistance line, as you can see the first resistance is $ 336, if you manage to break it, the next resistance will be $ 339, $ 341 and $ 343.
Looking at the CHOP indicator, we see that the energy has been used, the MACD indicates an uptrend, while the RSI is moving above the upper limit, which may affect the price correction.

#BTC - Head and Shoulders pattern + HIGH ROOF Resistance.#BTC - Head and Shoulders pattern + HIGH ROOF Resistance.
Can we break it? -> Look at the liquidity and volume which is super super super LOW.
All indicators look like we are reaching this RUN's top. So be careful.
- - - - -
The head and shoulders chart pattern is a popular and easy-to-spot pattern in technical analysis that shows a baseline with three peaks, the middle peak being the highest. The head and shoulders chart depicts a bullish-to-bearish trend reversal and signals that an upward trend is nearing its end.

