Breakout in UnivcablesA stock in a strong uptrend, has given a breakout with volumes. A good buy above 400 with a favorable risk reward ratio
Entry - Above 400
Stop Loss - Below 386
Target 467+
Resistence

QIUSDT Spot Trade!QIUSDT Technical analysis update
Buy zone : Below $0.01222
Stop loss : $0.0104
Take Profit 1 : $0.0139
Take Profit 2 : $0.0165
Take Profit 3 : $0.0210
Take Profit 4 : $0.0268
Spot trade.
Always keep stop loss

Bitcoin Short-Term Support & Resistance AnalysisPrices move because of supply and demand . When demand is greater than supply, prices rise. When supply is greater than demand, prices fall. Sometimes, prices will move sideways as both supply and demand are in equilibrium.
When support and resistance lines are broken, there is a high possibility of a significant uptrend in that direction. Be aware of the stop-loss area when trading on margin
ⓡ Resistance Line 28952$
ⓡ Resistance Line 28549$
ⓡ Resistance Line 28300$
ⓢ Support Line 27881$
ⓢ Support Line 27617$
The above price level represents an important tipping point, not an absolute analysis for buying and selling. You must be careful about your investment decisions.
Thank you for reading my poor analysi

Daily BTC 4HChart - resistance and supportHello everyone, let's look at the BTC to USDT chart on a 4-hour timeframe. As you can see, the price is moving within the triangle marked with yellow lines and is about to leave it.
Let's start with the support line and as you can see the first support in the near future is HKEX:27784 , if the support is broken then the next support is $27400 and $26902.
Now let's move to the resistance line, as you can see the first resistance is $28281, if you manage to break it the next resistance will be HKEX:28587 , $28901 and $29372.
Looking at the CHOP indicator, we see that the energy is very charged, the MACD is on the verge of maintaining an uptrend, while the RSI is in the middle of the range, we have room for an upward exit from the triangle.

BNB/USDT 1HInterval Resistance and Support SHORTTERMHello everyone, let's look at the BNB to USDT chart on a 1-hour timeframe. As you can see, the price is moving below the local downtrend line.
Let's start with the support line and as you can see the first support in the near future is $311.8, if the support is broken then the next support is $308.6, $306.1 and $303.6.
Now let's move to the resistance line, as you can see the first resistance is $313.8, if you manage to break it, the next resistance will be $316.3. $318.4 and $320.4.
Looking at the CHOP indicator, we see that there is still energy left for further movement, the MACD indicates a local uptrend, while the RSI shows a large increase and a temporary price rebound.

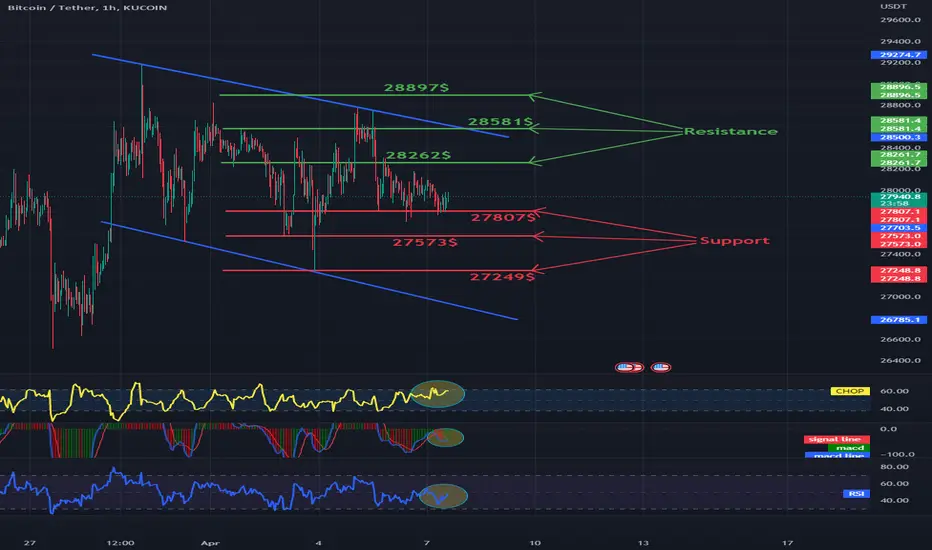
Daily BTC 1HChart - resistance and supportHello everyone, let's look at the BTC to USDT chart on a 1-hour timeframe. As you can see, the price is moving in the local downtrend channel.
Let's start with the support line and as you can see the first support in the near future is HKEX:27807 , if the support is broken then the next support is HKEX:27573 and $27249.
Now let's move to the resistance line, as you can see the first resistance is HKEX:28262 , if you manage to break it, the next resistance will be $28581 and $28897.
Looking at the CHOP indicator, we see that there is a lot of energy, the MACD is on the verge of returning to an uptrend, while the RSI has room for price growth.
Daily ETH 1DChart - resistance and supportHello everyone, I invite you to review the chart of ETH in pair to USDT, taking into account the one-day interval. First of all, using the blue lines, we can mark the uptrend channel in which the price is currently moving.
Now let's move on to marking the places of support. We will use the Trend Based Fib Extension tool to mark the supports, and as you can see, we first have a support zone from $ 1801 to $ 1759, if the price falls below this zone, then the second support at $ 1715, the third at $ 1650, then the fourth support at a price of $1569.
Looking the other way, we can also mark the places where the price should encounter resistance on the way to increases. And here we have the first very strong resistance at HKEX:1978 , the next resistance at TADAWUL:2060 , then the third resistance at HKEX:2126 , and the fourth resistance at $2195.
The CHOP index indicates that there is still some energy left for the next move. The MACD indicator remains in an uptrend. On the other hand, the RSI, despite the rebound, is in the upper part of the range, which may indicate a deeper correction.

EURUSD |Inverted head &Shoulder patternOANDA:EURUSD
Hi , Trader's as you see on chart , in 30 min's and 1 hour TF
inverted head and shoulder is visible , Neckline at 1.0916 is broken and now successfully retested
If market get some liquidity here than possible price can reach to upper trendline at 1.0978
As friday will be holiday , so market will move slowly
At the time of NFP news market can spike up
❤️ Please, support my work with follow ,share and like, thank you! ❤️

MATIC/USDT 4HInterval Resistance and SupportHello everyone, let's look at the MATIC to USDT chart on a 4-hour timeframe. As you can see, the price is moving in the local uptrend channel.
Let's start with the support line and as you can see the first support in the near future is the zone from $1.12 to $1.11, if the support is broken then the next support is $1.09 and $1.05.
Now let's move on to the resistance line, as you can see the first resistance is $1.13, if you manage to break it, then we have a resistance zone from $1.15 to $1.16, then support at $1.17 and $1.19.
Looking at the CHOP indicator, we see that the energy is growing strongly, the MACD indicates a local downtrend, while the RSI has a significant rebound, which creates room for the next increase.

NQ - update: Within "normal" correction (so far)A "correction" can be very much expected after every few days of running up.
The bull is very much intact if NQ can stay above 12,800, with Potential resistence-turned-support @ 12,850.
(worst case support @ 12,500, the most recent pivot low).
The 200 day Moving Average is slightly curving up now too.
As long as one isn't a short term / day trader, just stay the course unless we see a break down of near term supports. So Let's see.
Picking the right stocks is important too, unless the market gets euphoric and every Tom, Dick and Harry stocks starts to run.
Disclaimer: Just my 2 cents and not a trade advice. Kindly do your own due diligence and trade according to your own risk tolerance and don't forget that money management is important! Take care and Good Luck!

Bitcoin Short-Term Support & Resistance AnalysisPrices move because of supply and demand . When demand is greater than supply, prices rise. When supply is greater than demand, prices fall. Sometimes, prices will move sideways as both supply and demand are in equilibrium.
When support and resistance lines are broken, there is a high possibility of a significant uptrend in that direction. Be aware of the stop-loss area when trading on margin
ⓡ Resistance Line 28952$
ⓡ Resistance Line 28549$
ⓢ Support Line 28300$
ⓢ Support Line 27617$
ⓢ Support Line 27229$
The above price level represents an important tipping point, not an absolute analysis for buying and selling. You must be careful about your investment decisions.
Thank you for reading my poor analysi

SOL/USDT 4HInterval Resistance and SupportHello everyone, I invite you to review the SOL chart on a four-hour interval. As we can see, the price moved sideways from the downtrend channel and now we can use the yellow lines to mark the local sideways trend channel.
Let's start by marking the support spots for the price and we see that we first have a support zone from $20.90 to $19.92, but if the price goes lower, we have another support at $19.04, then at $17.68.
Looking the other way, we can similarly determine the places of resistance that the price has to face. And here we can see that the price is currently fighting a strong resistance at $21.10, then we have resistance at $21.60, once price breaks it it will move towards a strong resistance zone from $22.17 to $22.91, once it manages to break the next resistance is at priced at $23.98.
The CHOP index indicates that we have a lot of energy, the MACD indicates that the upward trend is maintained, while the RSI recovered and returned to the middle of the range.

GBPUSD 🐻GBPUSD in 1hr time frame it reached trend line resistance zone and RSI also showing overbought so we may see some downward decline in price.
.
.
.
.
.DYOR!!!!

Daily ETH 4HChart - resistance and supportHello everyone, let's look at the ETH to USDT chart on the 4-hour time frame. As you can see, the price is moving in the local uptrend channel.
Let's start with the support line and as you can see the first support in the near future is $1903, if the support is broken then the next support is $1878, the third is $1858 and then we have a strong support zone from $1838 to $1809.
Now let's move on to the resistance line, as you can see the first resistance is $1954, if you break it the next resistance will be $1992, $2022 and $2052.
Looking at the CHOP indicator, we see that the energy on the short interval has been used up, the MACD indicates a local uptrend, while the RSI has crossed the upper limit, which may give the price a rebound.

Bitcoin Short-Term Support & Resistance AnalysisPrices move because of supply and demand . When demand is greater than supply, prices rise. When supply is greater than demand, prices fall. Sometimes, prices will move sideways as both supply and demand are in equilibrium.
When support and resistance lines are broken, there is a high possibility of a significant uptrend in that direction. Be aware of the stop-loss area when trading on margin
ⓡ Resistance Line 28570$
ⓡ Resistance Line 28317$
ⓢ Support Line 27682$
ⓢ Support Line 27229$
ⓢ Support Line 26693$
The above price level represents an important tipping point, not an absolute analysis for buying and selling. You must be careful about your investment decisions.
Thank you for reading my poor analysi

Daily ETH 1DChart - resistance and supportI invite you to review the chart of ETH in pair to USDT, on a one-day interval. First of all, with the help of yellow lines, we can mark the downtrend channel, which the price overcame, while we are currently moving in the uptrend channel, for which we used blue lines.
Now let's move on to marking the places of support. We will use the Fib Retracement tool to mark the support, and as you can see we have a strong support zone from $1673 to $1552 first, but as we go lower we have a support at $1462 and then a third support at $1372.
Looking the other way, we can also mark the places where the price should encounter resistance on the way to increases. And here we have the first very strong resistance at the price of $ 1828, with which the price has been fighting for several days, when it manages to overcome it, the next very strong resistance is at the price of $ 2028.
The CHOP index, similarly to the BTC situation, indicates that we have a lot of energy for the upcoming move. The MACD indicator is on the verge of entering a downtrend. On the other hand, we see a rebound on the RSI after recent increases.

Daily BTC 1DChart - resistance and supportHello everyone, I invite you to check the current situation on BTC in pair to USDT, taking into account the one-day interval. First of all, we will use the yellow line to mark the downtrend line, which the price has overcome upwards.
Now we can move on to marking the places of support in the event of a correction. And here it is worth first to mark the first support at $25965, then we have the second support at $23905, the third support at $22459, and then the fourth support at $20768.
Looking the other way, in a similar way using the Fib Retracement tool, we can determine the places of resistance. First, we will mark a very strong resistance at $28,794, from which the price bounced several times, but when it comes out higher, we have another very strong resistance at $32,422.
As we can see the EMA Cross 10 and 30 indicate an ongoing uptrend.
Please pay attention to the CHOP index which indicates that we have a lot of energy for the upcoming move, the MACD indicator indicates entering a local downtrend, while the RSI is in the process of a slight rebound, but there is still room for a deeper correction.

US30 : Dj30 Butterfly Harmonic patternCURRENCYCOM:US30
Hi , Trader's , As you can see on us30 chart , bearish Butterfly harmonic pattern is visible
X-A-B-C Leg is completed D led in progress
D leg will complete at Resistance 34100 area
After completion of X-A-B-C-D wave market can give 50-61.8 % retracement
50% retracement will be 33k level
Sell after completion of D wave
use proper risk management

DOT/USDT 4HInterval Resistance and SupportHello everyone, welcome to the DOT chart on today's chart of USDT pair, on a one-day time frame. First, we will use the yellow line to mark the downtrend line from which the price has increased.
Moving forward, we can move on to marking support areas as we begin a major correction. And here we see the price is just below the first support, then we have the $6.11 to $5.93 support zone ahead of the price, the third support at $5.74 and then the fourth support at $5.49.
Looking the other way, we see first resistance at $6.53, then second resistance at $6.86, then third resistance at $7.32
Please look at the CHOP index which indicates we have a lot of energy for the move ahead, the MACD indicates we have entered a downtrend while the RSI is in recovery.

Gold Price is @ major Resistance.As shown in this simple chart that Gold is Trading in between our resistance zone...with 1884 being most important for this whole week...we are watching price behavior in this resistance zone and will look that either 1884 hold or not... minimum in hourly chart.
Take 1884 as a pivot point and you can buy above after an hourly closing...and if it fails to break 1884 then we'll see selling in gold and targets are mentioned in chart...
Good Luck and Trade wisely.

BNB/USDT 4HInterval ShortTerm Resistance and SupportHello everyone, let's look at the BNB to USDT chart on a 4-hour timeframe. As you can see, the price is moving below the local downtrend line.
Let's start with the support line and as you can see the first support in the near future is $309, if the support is broken then the next support is $306.1 and $302.1.
Now let's move to the resistance line, first we have a resistance zone from $312.3 to $314.4, then a second resistance zone from $316.2 to $317.9, a third resistance at $320.5, then a fourth resistance at $323.6.
Looking at the CHOP indicator, we see that the energy is starting to rise, the MACD confirms the local downtrend, while the RSI is moving in the lower part of the range, which may indicate an upcoming price increase.

Daily ETH 4HChart - resistance and support SHORTTERMHello everyone, let's look at the ETH to USDT chart on the 4-hour time frame. As you can see, the price has fallen below the local uptrend line.
Let's start with the support line and as you can see the first support in the near future is $1782, if the support is broken then the next support is $1762, $1741 and $1713.
Now let's move on to the resistance line, as you can see the first resistance is $1823, if you manage to break it, the next resistance will be $1846, $1865 and $1885.
Looking at the CHOP indicator, we see that there is energy to continue the move, MACD confirms the local downtrend, while the RSI shows a rebound, which positively creates room for a future price increase.

DXY - Higher Prices in Sight / Risk OFF
The US-Dollar Index has aligned itself for long-term Bullishness (Risk OFF).
If the DXY goes higher, all other markets will get pressured lower as a result of that (Forex, Indices, Treasury Bonds, Crypto & Commodities) ...
Monthly Timeframe:
Price is respecting the BISI + Discount OB. I like how the wicks tested the BISI and OB by leaving wicks in them, but the bodies of the candles closed outside. That's usually a great indication for a run higher.
As a first target, I'm aiming for the Monthly SIBI. Does price break through it to the upside, BSL priced at 114.800 is the next target. If price breaks through that, I'm aiming for a run above the BSL into 124.000.
Important: If price goes Lower instead, and a Monthly candle Closes Below the BISI (see the image below), we should get a clean run lower to SSL at 88.250. But as long as price remains closed above the BISI, I'm Bullish.
Weekly Timeframe:
Price ran out SSL, and we can further expect a move higher. Orderflow has also shifted bullishly as price traded through a Bearish Orderblock to the upside. We should now see every OB and FVG get supported in the trend higher.
Weekly SIBI in sight on the weekly timeframe.
Daily Timeframe:
Price is currently in a Market Maker Buy Model. The MMBM is completed if price reaches the BSL high at 114.800. Each re-distribution should get mitigated with an accumulation to the upside.
Also see that as price swept the SSL, price created a market shift to the upside and rebalanced the BISI, and continued running higher from there.
The BSL High is a LRLR, Low Resistance Liquidity Run. It's easier for price to take these levels out, and the runs toward these levels are usually met with cleaner runs with less retracements to the opposing direction.
This is my speculation. It is not financial advice. Do your own research and analysis before engaging the market.
