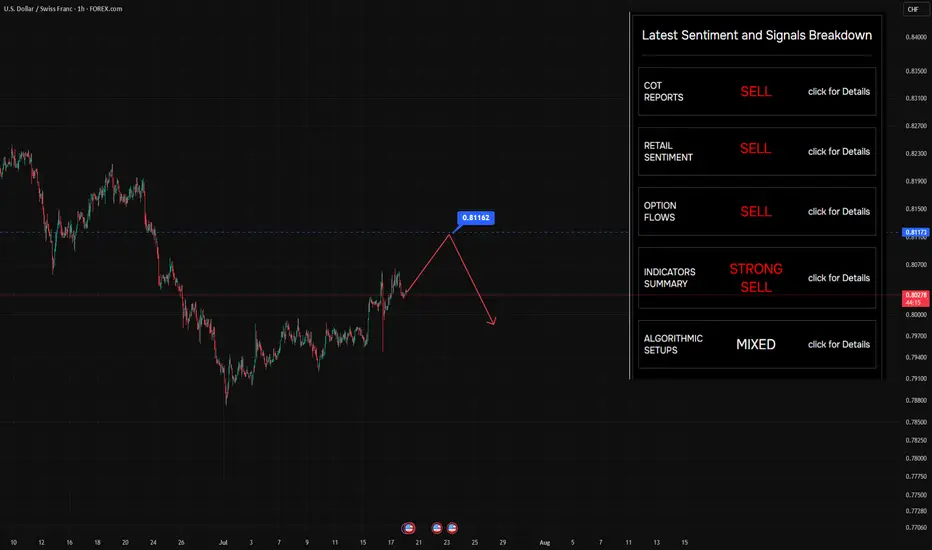
Still looking to sell on rallies — nothing’s changedStill looking to sell on rallies — nothing’s changed. The level on the chart? That’s where buyers jumped in before. Makes sense to target it again.
So… why do we say there are "suffering buyers" at this level?
Let’s rewind a bit (see Chart #2) and imagine price at the point marked on the chart.
At that moment, price had clearly returned to a visible local level — 0.8123 — a zone that naturally attracted traders to jump in on the fly , or triggered limit orders .
But here’s what happened next:
Selling pressure overpowered buying interest — and price moved swiftly lower .
That’s when those buyers got caught.
That’s when the pain started.
🔍 What Makes This Level Special?
Broker data from open sources confirms that open positions are still sitting at this level — meaning a lot of traders are underwater, hoping for a recovery that may never come.
It’s not just technical structure.
It’s crowded sentiment , failed expectations , and trapped capital — all wrapped into one.
🧠 This is what we call a "suffering trader" zone — and it often becomes a magnet for future selling .
📌 Follow along for more breakdowns on flow, positioning, and market sentiment .
Ressistance
$BTC All Eyes on the FVG Zone. CRYPTOCAP:BTC broke out above key resistance and is now retesting the FVG zone near $112K–$115K.
Holding this level could trigger a fresh rally toward $127K–$132K.
DYRO, NFA

XAUUSD SELL OR BUY (READ CAPTION)Hi trader's what do you think about gold
current price: 3340
gold is rest now in resistance zone i think gold retest down side and giving retrcement
resistance zone 3345_3350
target point :3316_3310
stop loss 3362
please like comment and follow thank you

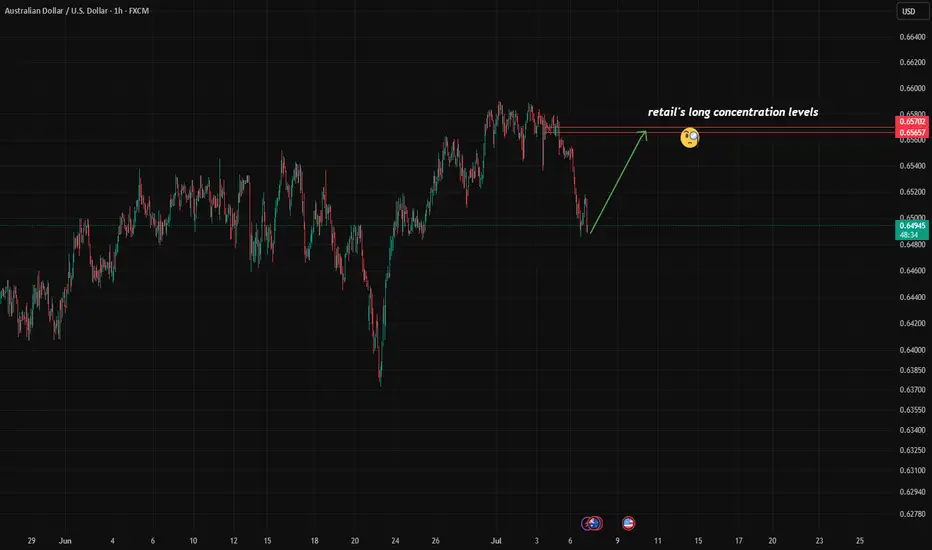
Contrarian Alert: Retail Is Buying, But Should You Sell?So far, there are no significant changes in the options flow suggesting a shift in sentiment or restructuring of previously established bullish positions. The market remains on watch, but interesting signals are coming from other sources.
According to the latest COT reports , institutional players continue to align with the current trend, reinforcing its stability.
However, retail positioning is starting to show signs of a potential reversal , with a noticeable increase in net-long positions and fresh buying activity over the past two days. This often indicates early countertrend interest.
The well-known contrarian principle — "do the opposite" — applies here, although it shouldn't be taken as an immediate signal to short.
For my part, I’ve identified the 0.6565–0.6570 zone as a key level where long positions are concentrated:
A rejection from this zone could offer a solid shorting opportunity.
A break above it would suggest the trend might resume higher.
By that point, updated options flow data and new positioning COT reports may provide further confirmation.
Quietly Building: A Major Options Position in August AUDEye-catching activity in August AUD options with a strike at 0.67 .
The break-even point for this portfolio sits slightly higher, at 0.674 — and judging by open interest, this is the largest position in play.
Quick reminder:
A break-even level like this could act as a synthetic put building zone by adding short futures to their positions. That means profit from downside moves — with limited risk .
But here’s the catch:
This setup alone doesn’t scream “buy” or suggest strong bullish conviction toward 0.674.
However, it’s definitely worth watching — especially if price starts moving in that direction.
Also keep an eye on option unwinds or roll-overs — they often tell us more about how big players see the future path of the asset.
📈 Bottom line:
Not a clear signal yet — but definitely a pattern forming. Stay tuned.
Follow for more edge-driven breakdowns!

Support and Resistance Levels: A Beginner Trader's GuideSupport and Resistance Levels: A Beginner Trader's Guide
Hello!
If you’re just starting your journey in trading, you’ve probably already heard about "support" and "resistance." These terms might sound intimidating, but their essence is simple. Think of an asset’s price as a ball bouncing between a floor and a ceiling. The floor is support , and the ceiling is resistance . Let’s break down how this works and how to use these levels in your trading.
1. What Are Support and Resistance?
- Support is a price level where buyers (bulls) are strong enough to halt a decline.
→ Example: Suppose the GBP/USD price drops to resistance line multiple times but bounces back each time. This line is a strong support level.
- Resistance is a level where sellers (bears) take control, preventing the price from rising further.
Why is this important?
These levels help you anticipate where the price might reverse or continue moving. They’re like road signs on your chart!
2. How to Identify Support and Resistance on a Chart
Start by analyzing price history. Support and resistance levels form where the price has repeatedly stalled.
- Step 1: Open a daily or hourly chart . The larger the timeframe, the more significant the level.
- Step 2: Look for points where the price reversed . For example, lows (for support) and highs (for resistance).
- Step 3: Draw horizontal lines through these points.
→ Visual Example:
On the GBP/USD chart, the price tested the level multiple times and bounced. This is clear support. The resistance level, where upward momentum stalled, acts as resistance.
3. How to Trade Using Support and Resistance
There are two main scenarios: *bouncing off a level* and *breaking through a level*.
Scenario 1: Bouncing Off Support or Resistance
- If the price approaches support, consider opening a long position (buying), expecting a rebound.
- If the price nears resistance, consider opening a short position (selling), anticipating a drop.
Scenario 2: Breaking Through a Level
If the price breaks support or resistance with high volume, it’s a signal to act:
- Breaking resistance → Buy.
- Breaking support → Sell.
→ Example:
GBP/USD breaks above resistance at 2.01050. You enter a short position, placing a stop-loss below 2.04040 order-block.
4. Common Beginner Mistakes to Avoid
- Overloading the chart with lines . Don’t mark every minor swing—focus on key levels.
- Ignoring volume . A breakout without increasing volume is often a false signal.
- Impatience . The price may test a level repeatedly—wait for confirmation before trading.
5. Practice Is the Key to Success
1. Study historical data . Open past charts and practice identifying levels retrospectively.
2. Use a demo account . Test your strategies risk-free.
3. Keep a trading journal . Note why you chose specific levels and analyze your mistakes.
6.Conclusion
Support and resistance levels are your best allies in trading. They reveal market structure and guide your decisions. Don’t get discouraged if it feels challenging at first—practice will sharpen your intuition. Remember, even professionals make mistakes. Focus on risk management and continuous learning.
Good luck! You’ve got this!

Targeting 1.185: Strategies for Navigating Euro Volatility!A few thoughts on the results of the analysis of Friday's stock exchange reports on the euro/dollar pair
We noticed a portfolio that has entered the market with a target of 1.185, and only have 12 days until expiration. With the current volatility at 10.23, the future price at expiration is expected to be in the range of 1.0993 to 1.1849 — a 95% probability. Interesting, right?
Now, let’s consider two possible scenarios.
The first option : if the price is rapidly moving towards 1.185, it might be wise to think about selling the asset. Why? Because this price will act as a strong resistance level. Two reasons:
First , the expected price range is based on a mathematical formula and statistical data. Second , using leverage embedded in options that are deep out of the money (i.e., far from the current price) presents an excellent opportunity to create a synthetic short position without any risk, even if the market continues to move upward! Sounds unreal? Start learning about options, and a new world of opportunities will open up for you. Your perspective on risk and opportunities will change dramatically!
OK, now let's get back to the point of the post. The second option : if the price consolidates above 1.1436 on the futures, this could signal a buying opportunity.
Taking into account other factors (you can dig deeper using our website's data), the current sentiment is quite bullish and the continuation of the uptrend seems more likely than a correction.
Which path will you choose? Share your thoughts in the comments!
That’s where our market research comes in. Think of it as your “bias detector.” We’ve developed and use it daily to get a second opinion on trades. It’s like having a pro trader whisper, “Hey, this isn’t looking good— think twice.”.
P.S. No pressure, just a chance to trade smarter! No Valuable Data, No Edge!

QQQ - support & resistant areas for today Feb 27, 2025So these are the support and resistant points for QQQ. Bounce off on these areas can initiate long or short positions.
This levels are mathematically calculated with future forecasting for the day. Only valid for the day.
If yall want me to post this every morning 9.30am please boost and follow me, so i know it is valuable for yall. If this post doesn't get more than 10 boosts, I will not continue this daily.
Thank you

XAUUSD → Since the trend is still intact, gold may rise evekeeps getting stronger following a minor adjustment. A zone of interest is ahead, and before the price begins to storm the ATH, it can correct to the support.
The escalating risks associated with Trump's tariff battle are driving up the price of gold. He is prepared to keep doing so in spite of the dangers that the US citizens also present. The dollar also received strong support from his statement regarding the Fed, "The Fed made the right decision last week to hold off on cutting rates," while gold, which is on its way to the highs, was unaffected. The tendency is continuing, and as the risks associated with the metal increase, so does interest in it. The Fed announcement and US and Chinese economic data are the main topics.
Technically, the preceding ATH-2790 serves as a crucial support, and gold may test this region once more before extending its upward trajectory. However, it is worthwhile to monitor 2800 in the near future.
Support levels - 2795, 2790
Resistance levels - 2802, 2808
Before the price decides to attack this level once more to consolidate above the support before rising further, there can be a slight correction from 2802 or from the 0.7-0.79 fibo.

RELAXO FOOTWEARS HAVE A STRONG GROUND SUPPORT...NSE:RELAXO trade at 820 level. Stocks take a multiple support at 750-780 range. You can watch for an Upside move at 980 level...

BABA Double Top: GAP FILL AHEADLook for BABA to consolidate some more and bounce off the previous resistance. I think we could see some quick price movement through the gap. Look for a bullish bias and for BABA to fill the gap this week.

Gold Market Analysis: Short-Term Targets and Long-Term OutlookIn the US trading session on Friday, the price of gold (XAU/USD) faced pressure as it sought to reclaim near-record highs around 2,430 USD. Despite a slight decrease, the price of gold remained within its upward trend, supported by safe-haven inflows amid escalating tensions in the Middle East.
Looking at the chart, we can see that the price of gold is experiencing a slight decline while attempting to maintain above the crucial resistance level of 2,400 USD. However, the upward trend remains intact and is expected to continue into the following week. The short-term target is the 2,400 USD mark, with potential further advancement towards the psychological level of 2,431 USD.

USDCHF shortUSDCHF reaching major resistance area on the 1D chart. Possible bearish movement of about 180 pips.

Technical Analysis: Positive Signals for EUR/USD GrowthEUR/USD is holding steady at 1.0850 at the beginning of Tuesday in Europe. This is explained by the weakening of the US dollar (USD), which has pushed the EUR/USD exchange rate sharply higher, once again bringing it back to the 1.0860 area at the start of the week.
Based on technical indicators, we see positive signs for the rise of EUR/USD. The simple moving average (SMA) is adjusting prices and indicating signs of an upward trend. Additionally, the Relative Strength Index (RSI) is trading above the 50 level, which is also a positive sign. This index shows that buying pressure is increasing, potentially adding to the upward pressure on prices in the market.
However, investors still need to carefully consider risk factors, including the global economic situation and political fluctuations. A thorough evaluation of potential profit and risk is the key to making effective investment decisions.

📈Ethereum/BTC Analysis: Potential Shifts in DeFi Dominance🚨🔍Today, we're analyzing Ethereum/BTC in the weekly timeframe, crucial for understanding Ethereum's position relative to Bitcoin, especially amid the DeFi landscape where Ethereum plays a significant role.
💎Towards the end of 2021, ETH/BTC encountered resistance at 0.08511 and has since been undergoing correction. Upon plotting the Fibonacci retracement, we observed a bounce at the 0.382 level, signaling a possible continuation. However, failure to breach the previous high suggests dwindling buyer strength, potentially leading to downward pressure if sellers enter the market.
🔒Simultaneously, we notice a trendline resistance restraining the price, indicating that price has yet to gather enough momentum to break above it.
📊Examining volume since mid-2023, it appears to be in a range-bound state. However, short-term analysis shows decreasing red candle volume as we approach support at 0.05061. We need to observe if a break of this support correlates with a significant increase in volume.
💥RSI oscillator is currently hovering around support at 39.87. A candle closing below both price and RSI support levels could signal the beginning of a new downward trend.
❌Finally, it's essential to note that the current support level we are testing is critical for the vitality of this chart. If breached, Ethereum may underperform Bitcoin, especially during corrections. Therefore, it's unlikely that the Ethereum community, particularly heavy ETH holders, would allow this support to falter easily.

Decline in the Yen (UJ) impacts the Dollar (USD)During the past trading week, the USDJPY currency pair closed at 151.342. This signifies that within the market context, the Japanese Yen has maintained its strength against the US Dollar. Based on these developments, the forecast for the upcoming week is for the downward trend to persist.
From a technical standpoint, charts and technical indicators have indicated a significant decline in USDJPY. This occurrence typically arises when concerns regarding the US economy emerge. Additionally, from a fundamental perspective, economic data has also pointed towards some uncertainties surrounding the US economy, leading to an increase in demand for the Yen (UJ). This could potentially result in a depreciation of the Dollar (USD) against the Yen (UJ) in the upcoming period.

📈Bullish on Shiba: Potential for Strong Rally🚀🔥🔍Today's analysis focuses on Shiba Coin (SHIB) in the daily timeframe, where it has recently experienced a remarkable 417% growth, showcasing its significant potential. SHIB is among the most popular meme coins in the market, boasting a large community of loyal holders.
📈Following such a powerful upward movement, a correction is entirely natural and essential for sustaining a healthy trend. A trend line from the weekly timeframe has been broken, indicating the extent of the 417% movement.
🛒Currently, the price is stabilizing, suggesting that considering spot buying within this range could be prudent. If the price begins to correct, waiting for confirmation candles within the range of 0.000015 to 0.000018 could be a strategic entry point.
💎Alternatively, a scenario where the price finds support upon reaching the SMA25 for its next move is plausible. If the market fails to initiate movement upon reaching the SMA, patience for Fibonacci levels may be necessary.
🚀For futures trading, it's advisable to sideline Shiba Coin and explore other options, considering its tendency for volatile movements and potential for easy liquidation.
🧠💼Just remember, jumping into trades too quickly before the main trigger can be risky. Always manage your money wisely and be aware of the risks involved.


Bitcoin dont get fooled!!I really like to se this scenario taking place for the rest of the week but it can keep runing higher and se some tipe of retracement friday.
Waiting for poweel speaks 16.35 EST today for confirmation.

NAS100Peace be upon you, traders, today I want to clarify this analysis that I did with the sniper strategy. I determined the order block, the meteorology block, and the Fibonacci, in which I relied on the most important levels, which are 50%, 61%, 75%, and finally 79%, which is the most important point because it is the maximum. A point to correct the wave, which point is the best of all.


rectangle pattern If this rectangle is broken in any direction, Bitcoin can move in that direction
Currently, the momentum of the chart is bullish, if Bitcoin continues to move, the chart will be updated by observing other patterns. Support and resistance ranges are clear in the chart
Good Luck

Wait to buy DogeTo reach the next resistance, Dogecoin can have a small correction to the range of $0.065. The next supports and resistances are clear in the picture and there must be enough momentum to break them. The last resistance identified in the image is related to the support that was broken in the previous analysis and it is important
