MMs, Dealers, Institutions and Predictability of RetailLeave discussion below.
This activity is proven in a number of markets.
Retail

Long SMRT TradeGoing long on NASDAQ:SMRT after a technical analysis on the stock.
The stock has been in consolidation for quite a while and could be do for another leg up.
I'm in the trade at $2.94.
Share your opinion, comments and questions. Good Luck!
Risk Level: High.
I will keep updating this post.

UA Inverse Head & Shoulders Breaking out Now!See chart. Note: PRICE MUST BREAK RESISTANCE AT $17.47, IF IT DOES NOT the stock may consolidate in that small range or fall.
If a breakout is confirmed, at the very least I would expect UA to fill the gap between $21.4 and $24.97.

AMZN 10-Day Ahead Prediction 05/21 - 06/04 PeriodArtificial Intelligence/Deep Learning Enabled 10 Day Ahead Predicted values for Amazon Inc ( AMZN ) have been plotted on the chart.
You can see FinBrain's previous predictions for AMZN (04/11 - 04/17 and 04/30 - 05/11 Time Periods) on the same chart as well.
The method used in this prediction is Deep Learning/Artificial Neural Network based, and using complex mathematical models/methodologies to analyze and extract hidden time series features in vast amounts of AMZN related data. The "trained" and optimized neural network then generates the multi-day ahead predictions which are plotted on the chart and given in the explanation below.
The expected 5 Day Change is 0.945 %
The expected 10 Day Change is 1.803 %
Predictability Indicator is calculated as : 0.757
Predicted 10-Day Ahead Prices are as the followings:
Mon May 21 Tue May 22 Wed May 23 Thu May 24 Fri May 25
1573.6 1577.0 1581.7 1586.3 1589.2
Tue May 29 Wed May 30 Thu May 31 Fri Jun 01 Mon Jun 04
1591.8 1594.4 1597.3 1600.2 1602.7
Please note that outliers/non-linearities might occur, however FinBrain's Artificial Intelligence/Deep Learning Enabled predictions indicate the softened/smoothed moving direction of the stocks/commodities/World Indices/ETFs/Foreign Currencies/Cryptocurrencies.

Wal-Mart $2 Bucks from Strong Support, Entry into India. . .Many believe India and China are the future of retail.
Wal-Mart seems to agree, and on 5/9 announced a $16 billion USD bid for a 77% stake in Flipkart, India's premier online retailer.
Wal-Mart paid up to beat out Amazon for this exposure to Asian retail. Will it be worth it?
Luxury retail is in great demand but everyday retail is struggling, especially in the United States. Wages remain stagnant, consumers are turning more and more to debt, and western countries don't offer much in the way of growth for retailers (indeed, several retailers have been driven to bankruptcy in recent years). Wal-Mart provides a place for the everyday consumer to buy everyday products, but margins can only continue to compress as: 1. the cost of goods rises with a consumer that can't handle increased costs passed onto them, and 2. WMT fights to reorganize to take market share in attractive online and Asian markets.
Wal-Mart needs to catch up to compete with Alibaba and Amazon in markets with growth potential, and seems to be taking the right steps to do so. In the short-term, that could be bad for share price - or is the "bad" already baked in, and are traders\investors ready to pay up for Wal-Mart stock?
Wal-Mart has to compete for its share of fruitful markets, even if it means margin compression.
Looking at the technicals, Wal-Mart has abruptly fallen to near strong support in and around $81 USD. WMT reports Q1 2018 earnings on 5\17, and it's conceivable the numbers can't come in much worse than the downside upset from Q4 2017's earnings call back in February. Is disappointing news baked in to the price already, with Wall Street already expecting a little pain as Wal-Mart transitions into the company it needs to be to take on Amazon and Alibaba in shifting online and global markets?
WMT paid up to jump in to growing East Indian (and Chinese) retail - it more or less had to, and "had to" isn't a good place to be when negotiating deals - but will an exploding Asian retail scene lead to explosive moves upward in the price of WMT shares? The move up may or may not be today or tomorrow, but presently, the company's decisionmaking seems to bode well for Wal-Mart's future.
Please like, follow, and share, and maybe we can have fun and do great things together.
Thanks again!
See it on the site: holsturr.com/category/markets/charts/
** For speculative and research purposes only - good luck! **

BOOT consolidation breakoutNice breakout for BOOT today. I can see this stock heading back up to $20 before it encounters some resistance both from the long term channel it is currently in and from its 52 week high.

WMT | Short Straddle Case12:43:25 May11 short 92 - 84 WMT straddle for 1.50 credit
No catalysts (earnings May 17)
Uncertainty about competition w/ Amazon is stifling trading volume
No sign of strong recovery after earnings miss paired w/ selloff
Wide strike spread leaves 5% margin of error


Huge Potential (profit and game-changer)INS EcosystemOverview
As people's lives are getting busier, they are turning towards technology to make their day to day tasks easier. Online grocery shopping being one of them was $98 billion in 2015 and according to IDG, it is poised to grow to $290 billion in 2020.
Even though convenience is key, cheaper prices can have a huge impact on where and how the consumer shops.
Enter INS ecosystem!
They are creating an ecosystem where suppliers can sell their product directly to the consumer. They want to cut off the middle man, the retailer, who has a markup range of 30% to 50%. This can mean that these savings can be passed onto the consumer.
Consumers can buy products from the platform using Fiat (2-3% card fees), BTC & ETH ( transaction fees) and you guessed it, leads us to the INS token which has virtually no transaction fee. The other payment methods have limited access to loyalty rewards whereas INS holders will be rewarded in full.
That leads us to price and potential price of token!
Currently, a token will cost you $1.29 (22/03/2018 21:37 GMT). When the token was made available for trading, the price was at $4.97 on Jan 12, 2018, quickly rising to $10.93 by 15th Jan 2018. Since then BTC fell and so did this token along with other alt coins. Right now you can buy the token at some discounted prices.
So the potential...
I do believe that if BTC hadn't dropped, this token would have rapidly increased in price. And here are some of the reasons why.
Huge interest from major brands such as Reckitt Benckiser
Pioneers in this industry using blockchain
Price saving for consumer and convenience
Suppliers don't have to deal with retailer bureaucracy
Supplier can reward consumers directly rather than paying for retailer promotions, thereby guaranteeing consumer loyalty.
If they actually manage to pull this off, this will revolutionise the grocery retail industry.
Now, imagine that they manage to pull it off and acquire 1% of the potential grocery market in 2020. That would be $2.9 billion. Now, let's say that their total supply of 50m tokens has been released. That would still put a token at $58 which is nearly 45 times the current value. Also, bear in mind that the suppliers themselves will have to store some of the token themselves to reward the consumers.
Alternatively let's say that they didn't manage to pull this off. Since they have given valid arguments, has interest from major suppliers, listed on major exchanges and hasn't been hyped much, when the hype does actually come, the forecast of $58 could be easily achieved.
Either way I have invested in this token (and no this isn't a paid promotion) as I believe it can provide me a good return on my investment.
Please feel free to share your thoughts on this.
Please do not take this as financial advise. Just my opinion. Do your own research before you do any sort of investment. This is just my analysis of the potential of the token and I could be wrong.

ASOS forms a bearish ascending wedgeASOS forms a bearish ascending wedge
That's bearish, although ASOS is still in an uptrend

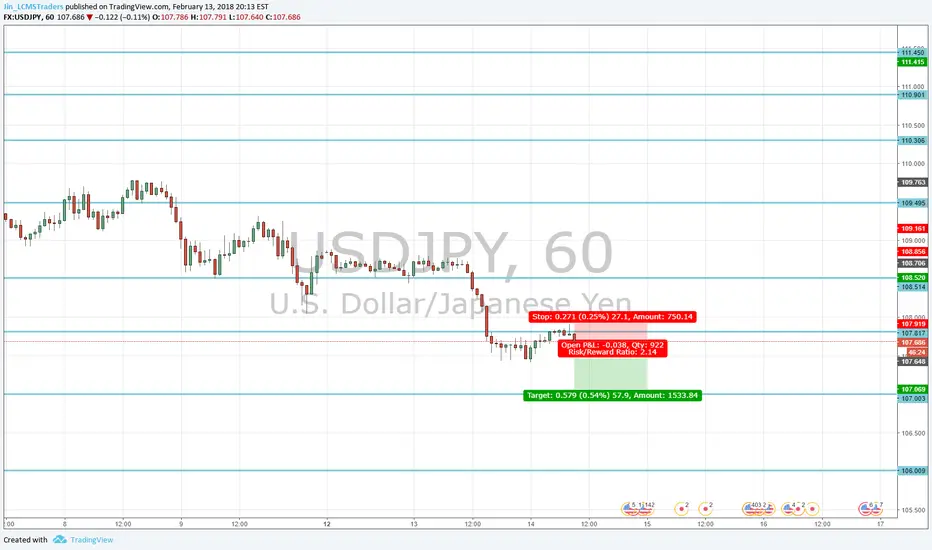
A stronger USD CPI and Retail Sales Data?
This evening, we have US CPI and Retail Sales numbers. A strong result could give the USDJPY the base to propel off.
However, with a strong data, I would be looking towards EURUSD, to move lower from a breach of the 1.2350 level.
Mixed or weak data from the US and we could see USDJPY plunge towards 106.

USDJPY to continue lower
Expect another round of USDYEN moving lower, pausing at 107, before finding support at 106. However, I would look to get out of a trade before the evening.
This evening, we have US CPI and Retail Sales numbers. A strong result could give the USDJPY the base to propel off.
Mixed or weak data from the US and we could see USDJPY plunge towards 106.
ASCENA Retail, Short Term Roll/Consolidating, ASNAI am not licensed or certified by any individual or institution to give financial advice. I am not a professional Stock Trader.
For the short term I believe ASNA is rolling. My prediction for the immediate future is it will continue down to one of my two Support lines (either $1.95ish or $1.85ish). Once Ascena hits one of those lines I believe it will bounce and continue its roll back up to a $2.47ish Resistance. If Ascena hits one of the two Support lines I've drawn and bounces up, and the market tone of the main Indexes ends the current retracemet and reverses back to the ongoing Bull trend, I will consider entering an up play.


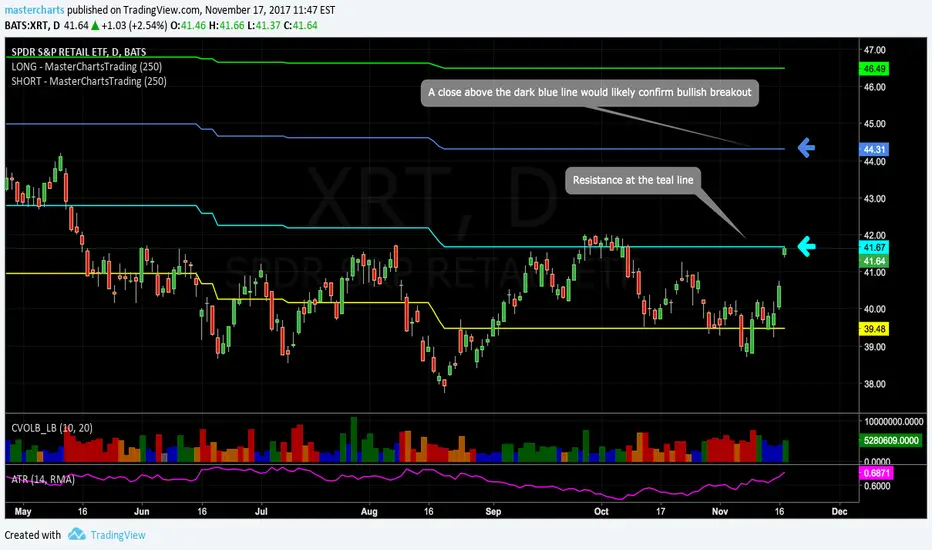
Just a little bit to the upside for #Retail before bullish break#stocks #trading $GPS $KORS $XRT #Investing

Retail ripping back higher XRTWe've seen a massive rip in retail with XRP in the last couple days.
Finally breaking out of this 6 month long Head and Shoulders bottoming pattern. Breaking out over that neckine of 42 was the buy signal. Overall, retail is still in a down trend, and that downward trendline from 2015 highs is our target as well as where we should face profit taking and resistance. It is also coincidentally the 200% measured move of the head and shoulders pattern. Those technical levels always work out despite what the nay sayers may tell you.
THE TRADE:
Long over 42 (head and shoulders neck line)
Target 45 (measured mvoe of head and shoulders)
Stop under 42
We want to be buying the dips on this rip until we reach our target.

Going long FL on WednesdayFL is printing a bullish hammer canldestick price bar near the 11/17 gap-up LOD on above average volume with my momentum/trending oscillators confirming the price move. I am going long FL Wednesday morning using a limit order (GTC-BUY-LMT) @ 40.45. I will have two trailing sell stops (GTC-SELL-STP) @ 38.66 and 38.25 to protect my initial invested capital in case FL does not move higher immediately. I am expecting the stock to move up and through its August and May resistance levels with a new 52-week high being the ultimate goal in the intermediate term.

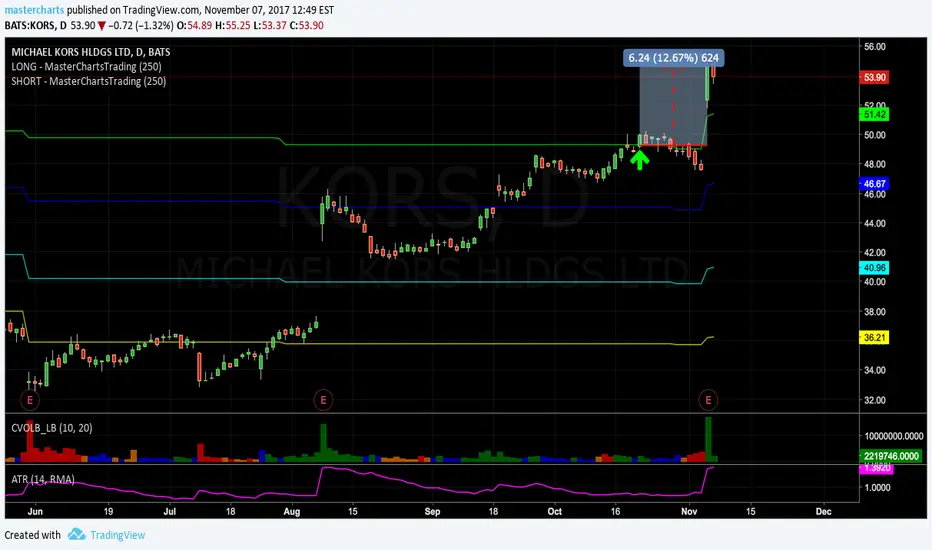
#Retail still holding the gap-up, this is a positive sign ...#support/resistance overhead @ $44.31. $XLY $GES $KORS

ANF Entry - Significant Shifting at all time lowRecent events in the industry with sector support are spiking several stock in the retail fashion field, ANF is strategically placed in this time and buyers are showing their interest at all-time-low.
For me, there are enough signs to support the attempt to build a position in the stock.
*Already holding in the fashion sector at AEO which also spiked and moved nicely, linking the trade here.

#Ross Stores gaps higher following October 26, 2017 breakout ..Simple indicator/overlay strategy. $XRT #retail #ETF

#Retail gaps up towards 1st resistance. A break higher?..Easy support/resistance lines. Break above blue line likely = bull market. $GPS $KORS