Decision Zone for DXY This Week: Around 97.600After a significant downward expansion in DXY, we observed a consolidation around last week's low. This week, the market opened with a pullback.
The first stop for this pullback appears to be the current daily fractal high candle and the weekly bearish FVG on the chart. We can assess potential selling pressure from this area on lower timeframes. We'll be monitoring the wicks within this zone, along with any newly forming FVGs.
If the price breaks above this area, our next points of interest will be the gaps within the zone above the 0.5 swing level, and ultimately the swing high itself as the final target.
Given the current setup, we believe there are promising trading opportunities on EURUSD.
Take care until the next update!
Retracement

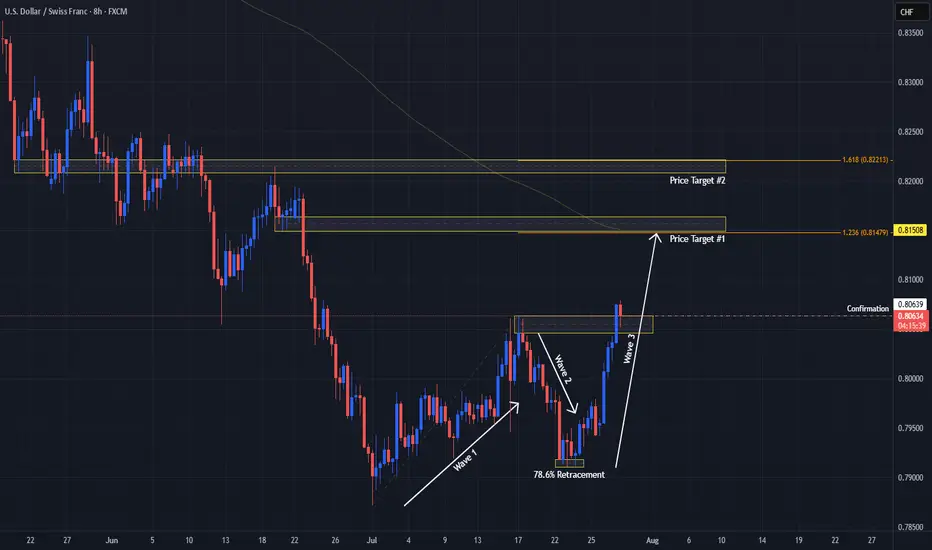
USDCHF Signals Wave 3 With Double Bottom!OANDA:USDCHF has not only formed a Double Bottom Pattern but also may be generating a potential Elliot Impulse Wave!
Bulls are giving the April & June Lows of .8038 - .8088, another go for a second time today after surpassing the first attempted High created July 17th to break above the level.
So far Price today has broken above July 17th Highs and if Bulls are able to hold this level, this would Confirm:
1) A Breakout of the Double Bottom
2) Wave 3 continuing the Impulse Wave in the Elliot Wave Theory!
The Higher Low @ .79106 created on July 25th, broke the downtrend structure as a 78.6% retracement of the Lower Low @ .78719 created July 1st which was a new 14 Year Low, finishing Wave 2 and initiating Wave 3 of the Impulse Wave.
The Extension of Wave 3 typically will end at the 1.236% or 1.618% level which gives us 2 potential Price Targets to start:
Price Target 1) .81479 - 1.236%
Price Target 2) .82213 - 1.618%
Once Wave 3 has ended, we will look for opportunities at the Wave 4 - Wave 5 juncture!
"Three Drives" And EURJPY Bulls Could Be Out!!OANDA:EURJPY has potentially been forming quite a rare Reversal Pattern, the Three Drives Pattern, after making a Bullish Breakout of the Triangle, lets break it down!
Three Drive Patterns are very similar to ABCD patterns except for one thing, a Retracement instead of a Reversal after the CD Leg is finished!
In the CD Leg, Price creates quite a Trading Volume Gap between 172.1 - 171.8 and after Price declines from Point D (normally a Short Opportunity on an ABCD Pattern), Price actually makes a 61.8% Retracement of CD, creating Point E in that very Price Range and moves up, which "drives" a strong case that we potentially could be looking at a Three Drive Pattern!
Now that we have Point E, we can use the Fibonacci Retracement Tool to help give us an idea on where the Extension of the EF Leg could potentially end and the Fibonacci Levels suspected are:
123.6% --> 173.585
138.2% --> 173.795
161.8% --> 174.134
Once Price has made an Extension, shows Reaction, and moves Down from these levels; this could generate a great Short Opportunity!

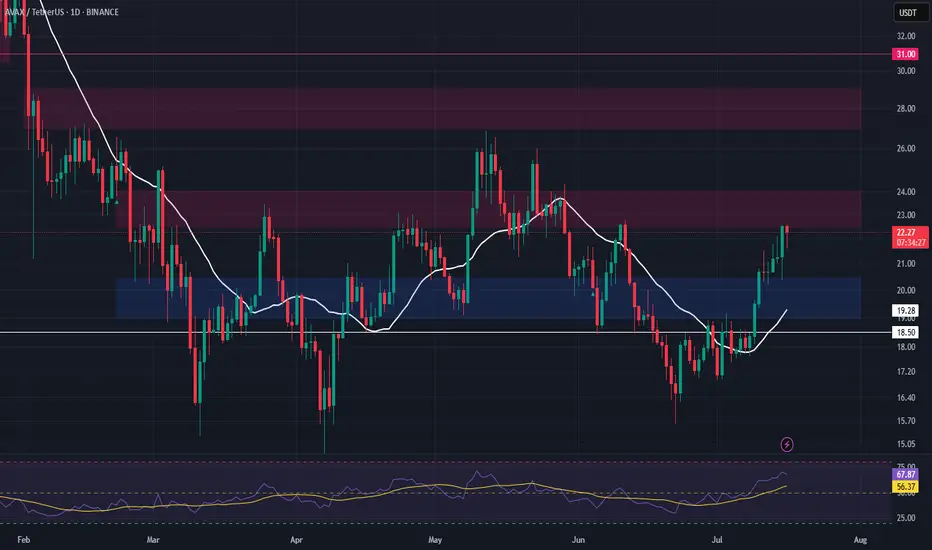
AVAX – Watching for Support Retest After Resistance TestAVAX is currently testing a major resistance level, and we’re anticipating a potential retrace into support. The $19.00–$20.45 zone offers a strong area to enter a long swing position on confirmation of the retest.
📌 Trade Setup:
• Entry Zone: $19.00 – $20.45
• Take Profit Targets:
o 🥇 $22.50 – $24.00
o 🥈 $27.00 – $30.00
• Stop Loss: Daily close below $18.50
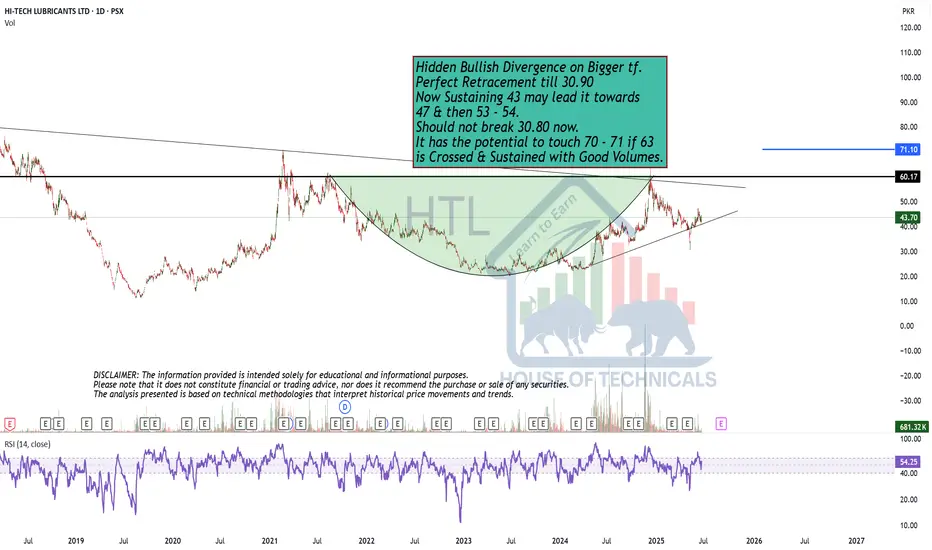
Perfect Retracement till 30.90Hidden Bullish Divergence on Bigger tf.
Perfect Retracement till 30.90
Now Sustaining 43 may lead it towards
47 & then 53 - 54.
Should not break 30.80 now.
It has the potential to touch 70 - 71 if 63
is Crossed & Sustained with Good Volumes.
Bulls Could "Wedge" Their Way Into Higher Prices On EGOANDA:EURGBP has made some impressive moves up since the Low from May 29th and Price just fell short of the Highs of April 11th before falling into a very familiar Bullish Pattern, the Falling Wedge!
The Falling Wedge is typically a Bullish Pattern where we expect Price to give us a Bullish Break of the Falling Resistance and Successful Retest of the Break before Price heads Higher!
Wedge Patterns can play both Reversal and Continuation Patterns dependent upon the location they form and surrounding Major Support/Resistance or Highs/Lows. In this case, we will be looking for a Continuation with Price being in an Uptrend before pausing slightly for a Consolidation Phase to form the "Triangle" of the Pattern.
*It is important to note that both the Falling Resistance and Falling Support have only been tested twice where three tests of both Trendlines should point to a strong equilibrium from both Bears and Bulls, validating the legs of the Triangle and strengthening the Consolidation Bias. ( So we could see Price test the Falling Resistance one last time before falling down to the Falling Support for a 3rd test! )
Lastly, when it comes to a Wedge Pattern, we should suspect that once Price makes a 3rd Test of the Falling Support and Retraces to the 50% Fibonacci Level @ .85887, this will signal the End of the Consolidation Phase!
- And this will be the time to enter!
**Once the Pattern is Confirmed and Breakout is Validated, based on the "Flagpole" or Rally prior to Price falling into the Consolidation Phase we can anticipate Price to potentially rise to the most recent High on April 11th of .87374 and give the next Previous High on November 16th 2023 of .87657 a try!
Fundamentally, news is light this week for both currencies in the pair with GDP m/m releasing for GBP on Friday, July 11th with a Forecast of .1%, a .4% increase from June's -.3%
Also, CPI y/y for GBP will be released the following week on Wednesday, July 16th.

EURJPY Readies Triangle Breakout w/ Elliot WaveOANDA:EURJPY has formed a Triangle Pattern with a Rising Support and Resistance Zone @ 169.5 - 169.7 area.
After the False Breakout last week on Friday, we see Price falls back within the Pattern and finds strong Resistance from the zone.
Now based from the High - to Low - to Lower High where price made a 50% - 61.8% Retracement, we can plot the Trend Based-Fib Tool that suggests with the change of trend ( Price printing a Lower High ) we can expect Lower Prices to come and potentially a Bearish Breakout to the pattern!
First we will want to see where the next Lower Low will be ( currently @ 168.934 ) then wait for a Retracement to a favorable Fibonacci Level based from the Lower High to Lower Low.
Fundamentally, the EUR will have CPI Flash Estimates on Tuesday, and multiple Services PMI on Thursday with ECB President Lagarde speaking Tuesday and Wednesday. This could add volatility!!
Stay Tuned!

XAUUSD Weekly Outlook 16-20 JuneHello traders 👋,
A powerful week ahead with extremely sensitive fundamentals in play.
🔎 Macro Fundamentals
🔥 FOMC rate decision + press conference coming up. This will set the tone for USD and risk markets.
🏦 FOMC statement + economic projections will guide the next dollar liquidity wave.
📊 Key US consumer data via Retail Sales and Core Retail Sales.
🏠 Housing sector updates: Permits, Starts, NAHB.
📈 Business inventories, Philly Fed, CB Leading Index, TIC flows.
⚠ Volatility expected to spike heavily mid-week during the Fed.
The market is positioned for liquidity grabs, with strong potential for traps both sides. Execution requires sniper discipline.
🔬 Technical Structure — Weekly Chart Context
Weekly bullish BOS confirmed.
Weak High sitting at 3448, currently challenged.
We are extended in premium territory after multiple bullish expansions.
Main premium OB zone: 3445 - 3465, highly reactive zone.
Discount demand stands lower around 3320 - 3280 and 3100 key weekly equilibrium.
EMAs remain fully locked bullish.
RSI approaching extended levels (71), risk of profit-taking spikes remains.
🎯 Key Weekly Levels
Type Zone Comment
🔼 Resistance 3445 – 3465 Active premium trap zone
🔼 Resistance 3502 1.272 Fibonacci extension
🔼 Resistance 3572 1.618 Fibonacci extension
🔼 Resistance 3649 2.0 Fibonacci extension
🔽 Support 3320 – 3280 Last valid weekly OB
🔽 Support 3100 Weekly equilibrium & demand
🧭 Weekly Bias
🔧 Primary bias: bullish continuation still intact while weekly structure remains protected. Watch for sweeps above 3445-3465.
🔧 Potential correction risk from high-impact fundamentals (FOMC). Buy dips if structure holds.
🔥 If you enjoy this clean breakdown: hit that 🚀, follow & drop your thoughts below!
Stay sharp traders — we execute with precision.
— GoldFxMinds

Reversal in Zydus Lifesciences1. RSI above 70 on daily timeframe
2. MACD turning green in weekly timeframe
3. Trendline breakout
4. Reversal from 50% retracement

AUDJPY Begins Elliot Correction After Wave 5 Impulse EndsOANDA:AUDJPY seems to have started a Elliot Correction Wave after the Impulsive Elliot Wave came to a finish once Wave 5 ended this morning @ 93.774.
Now after an Impulsive Wave ends, its theory that a Correction comes next and with Price having Retraced to the Golden Ratio creating a Lower High, this is the beginning signs of that theory in the works!
The Sequence will be confirmed once Price Breaks below Point A @ 93.248 where then we should suspect Price to find itself back down into the 92 range where the Correction Wave should come to an end.
RSI is trading back below 50 confirming Price has room to move lower strengthening the Bearish Bias.

GU Bulls Raise "Flag" Eyeing Higher PricesFX:GBPUSD has formed a Bull Flag and we could be getting ready to see the Bulls take the spotlight!
After Price broke through the Previous Level of Structure, Price retraces the High of 1.35589 to the 50% Fibonacci Level @ 1.35022 and is supported pushing Price back up from the Previous Level of Structure.
-The 50% retracement signals the end of the Consolidation Phase of the Pattern.
Now with a Bull Flag being a Continuation Pattern, we can suspect that Price will give us a Bullish Breakout of the Descending Channel and Retest before moving higher Confirming the Pattern and once the Breakout is Validated!
Based off the "Flagpole" of the Pattern, if a Bullish Breakout is Validated and the Retest is Successful, the extension of the Set-up would place the Price Target @ 1.3640 which is at the next big level of Resistance.

EU Prints Three Black Crows!FX:EURUSD has printed a strong Triple Candlestick Pattern called Three Black Crows after having made a 50% Retracement of the failed Higher High @ 1.1407.
This 50% Retracement found price testing a Previous Low and Resistance Zone where price now has broken a Previous Level of Structure being Support and is now on its way up to Retest this Break!
If Price is able to Retrace back to the Level of Structure @ ( 1.1336 - 1.1340 ) and shows signs of Resistance, this could deliver Short opportunities to take Price down to the Next Levels of Support @ 1.131 & 1.126!

Potential NEO 1H ScalpBITGET:NEOUSDT is currently testing resistance around $6.66 with RSI in overbought territory, which could trigger a short-term pullback.
A 0.5–0.618 retracement into the unmitigated hourly FVG ($6.39–$6.47) could provide a compelling long entry, while allowing an RSI reset and potentially forming an IH&S pattern.
The measured target for a breakout above ~$6.66 would be ~7.00 (still valid in case of a direct breakout without a pullback).
Setup 1
• Trigger: Pullback to $6.39–$6.47 and reversal
• Invalidation: Sustained break below $6.39
Setup 2
• Trigger: Break above $6.66 with volume
• Invalidation: Failure to hold $6.66 after breakout

Everybody loves Gold Pt1Everyone loves gold.
With sufficient pips in the bag, we start week 22 with the analysis on gold as highlighted on the chart.
Trade parameters:
SL: 50pips
dtp : dynamic Take profit as momentum leads.

BTC Potential Short-Term PullbackBINANCE:BTCUSDT could be setting itself up for a short-term pullback.
It might be forming a Daily RSI Bear Divergence, with the latest retest of the the main supply zone, and RSI Divs/Breakouts have been reliable leading signals for recent CRYPTOCAP:BTC PA.
Key Levels to Watch
• $119k - Measured wedge target, confirmed with last month's breakout.
• $106.2k-$109.5k - Main supply and ATH, a sustained break above it would invalidate any bearish PA.
• $89.6k-$91.9k - Lots of confluence here:
- Unmitigated daily FVG
- The 200-day EMA is sitting there
- A move here would be between 0.5 and 0.618 Fib retracement of the last leg up, consistent with the typical pullback length of Wave 2 (Elliott Waves theory)
- It has also been an important S/R since November 2024, and a retracement here could form an Inverse Head and Shoulders pattern.
I would be patient with it, as I still see a lot of uncertainty short-term, but I think a pullback to ~$90k could offer a great long entry. Worth keeping a close eye on it.

GBPUSD Week 21 Swing Zone/LevelsNot Always.
Not always will price conform to hypothesis, but in following good RRR success is assured.
We setup week 21 levels and zone as shown with the predicted pathways.
Trade Parameters: Entry on 5 mins chart
Sl 10-15pips
TP usually dynamic but typically 5x
Follow on for trade updates.
As Always PRICE determines trades

GBPUSD Week 20 Swing Zone/LevelsWinning on a roll here. But Market is still the king.
This week could swing either way; i prefer a strategy where you can set alerts and walk away.
Alerts to set 3427 and 2711
Sl always between 10-15pips from 5 min bar entry
tp as the momentum leads.
New market loading .....

Good Retracement Needed
Important Support levels are 77 , 69 & 63
in extreme selling.
a good retracement towards these levels would
open a way to new highs.

Algorand Consolidation "Pointing" To An End??Here we can see COINBASE:ALGOUSD is about finished forming a Continuation Pattern, the Bullish Wedge!
Price has made an impressive .50 increase since Trump taking office but has slipped into quite a steep Consolidation Phase where Price has made run for the 88.6% Retracement and seems to be filling out the rest of the "Point" of the Wedge!
Accompanying the Chart Pattern is a Decrease in Volume as well, signaling the tight Consolidation could be looking to make a break soon!
*With a True Breakout, we will want to be vigilant of multiple factors coming into play with Increase of Volume to Validate the Break of Pattern!
Once the Pattern is Confirmed and a Breakout Validated, based on the "Flagpole" of the Pattern, we could expect a potential extension of price to go behind the current Swing High of .6133 and up into the .70 area!

Will 3 Times Be The Charm For GBPUSD??We can see FX:GBPUSD retrace a tad further up to the Volume Imbalance that was created over the weekend of April 4th - 7th. After Price made its High @ 1.3207, it was immediately rejected back down below the Past Level of Support that is now showing signs of Resistance!
- Following that Higher High not only resulted in a Lower Low but also sent the RSI under 50 into Bearish Territory!
Now in the ICT Methodology of Volume Imbalances, Price is likely to Test or Fill the Imbalance, then once satisfied, has a high potential to turn the opposite direction. Now a Pullback to Fill the Imbalance would land Price right at the 38.2% Fibonacci Level @ 1.28984 where if Bulls are unable to push Price back above, would be an excellent Shorting Opportunity for Bears to overcome.
- RSI is now below the 50 suggesting Bulls have lost steam and strengthens the potential for more downside to occur but that would call for a Break and Retest Scenario on the Rising Support.
Fundamentally, the Federal Reserve will be releasing the CPI y/y and m/m results where analysts believe there to be a .3% decrease in inflation forecasting a 2.5% CPI for March from the previous 2.8% for February. Given this, the FOMC " do not plan to come to rescue Trump with rate cuts" and insist that all the Tariff pressure will actually be a reasoning for Inflation to Rise! So if CPI ends up printing Hotter than Expected (Higher), we could see a renewed strength in the USD.

NVDA Short Term BuyPrice is currently consolidating within a tight range, and a breakout appears imminent. I am looking for a clean break above resistance, followed by a retest of the breakout level, which could provide a strong buy opportunity. If this setup plays out, the next key target would be the $135 level.
However, this move is likely to be a short-term retracement within a larger downtrend. If price struggles to sustain momentum above $135 and shows signs of weakness, it could indicate a continuation of the broader bearish trend. Confirmation will come from price action signals and volume dynamics on the retest.

XRP Weekly-Monthly Analysis / Retracement Levels for BuyWeekly - Monthly trend: Bearish
Chart Pattern: Head & Shoulders (H&S) - Continuation Pattern
Retracement Fib Price Levels:
0.00% (3.4000)
23.60% (2.6879)
38.20% (2.2474)
50.00% (1.8914)
61.80% (1.5353)
78.60% (1.0284)
100.00% (0.3827)
Good prices for buy:
61.80% (1.5353) – Golden Zone / Golden Pocket
78.60% (1.0284) – Entry Zone
Between 78.60% (1.0284) and 100.00% (0.3827) is the Risk Zone, which we have the Neckline of the ‘’ Quadruple Bottom Pattern ‘’ at the price range ‘’ 0.6291 – 0.7850 ‘’

XAU/USD Gold - Both Side Long 30% / Sell 70% Point of InteresetHi everyone, i try to share some idea, feel free to leave a constructive comment to improve my skills ;)
As the GOLD drop on friday, it could be a simple retracement on the 4h TF but in daily the gold rally does not really retraced on previous level.
I should look at 2867 level (Key point 1) to be deterministic if we break the structure it may go to 2830 (Key point 2) and may bounce to 2900-2923 (Key point 3) to mitigate FVG and start the retracement to the 2700 to end the retracement on the OTE around 2700.
If the break of structure fail on (Key point 1) we may bounce directly to (Key point 3) around 2900-2923 and then retrace to the OTE 2700.
If the price breaks 2927 i will consider a bullish continuation and will find another entry after this break to target 3000.
At this moment my feeling is more bearish than bullish.
As the TA suggest that the bearish is near and the last economics are in this favor.
my opinion may change during asian session and the price action on 2867 Key level.
I wish luck to everyone.
Kind Regards
Niko
