COIN/COINBASE Stock: Up to $56, Down to $41, Up to $84?Prediction based on technical indicators:
Up to $56 ATPOC Monday
Retrace Down to $41 throughout rest of week/into next week
Work up to inverse fib (& regular fib) extension level which both align at $83.90ish/$84 & also line with large price level from
price action on zoomed out weekly chart.
Retracement

Bulls divergence retrace continuesAs up to 1550 still bullish and still strong 30-4H chart confirmation breakout but will be shortage of a retrace.
Buy now at 1550 area and let it skyrocket up;
Ethereum still retracing and no 880 area is not the bottom for Ethereum; bear market isn’t over. Take profit 2000 to be safe away from the sell off; if reversal still in control then onto 2500 or somewhere between.
Bottom target is about 600-550 area could happen to go even lower.
**UPDATE FOR BITCOIN**
- same thing 30-4HR chart confirmation breakout will be shortage and now extended more retrace
- still above 20K almost to 21K.. still bullish reversals
- buy 20K take profit about 23-25K big bearish reversal could happen in those zones or between.. if higher like 28K idk we will see how high the retrace needs.
Trade safe y’all.
FYI - Stop saying bitcoin is bottom even Ethereum is bottomed.. the bear market isn’t over because of Fundamental Recession is coming this year as Feds still increasing rates and terminal rate.. might wait until Feds cuts rate , Rate Pause, qualitative easing and qualitative tightening to happen in order get to The bottom.

Enphase retracementEnphase has retraced 50% off of high.
$180 is my stop for a long position. I'm looking for $400+ for a price target, that's what I expect by end of year.
This could go the other way and test $180 but expect more volatility from ENPH in the near term.

Retracement on UJ Again?USDJPY has significantly dropped over the past 2 months by a follow up retracement on the broken supports. Here again the price ended the week by a strong impulse to the downside leaving the BOS fresh(unmitigated). probabaly price would gap or maybe even get to the imbalace zone depending on the technical and fundamental aspects that be take effect next week.

Retrace complete/Further downI kept seeing everyone thinks bitcoin just bottomed.. ( no not quite yet) this what happens people get too greedy.
As bear market still going and still on the move, Feds are still increasing terminal rates and interest rates because the inflation still remained high and not cooling down enough; big happens the Feds will get aggressive and too aggressive until ceiling hits and see economy will break as fundamental Recession is coming sometime around 2023.
Now let’s talk about bitcoin. The retrace is complete nearly hit 20K my analysis had been correct but I might be or be wrong is the retrace isn’t over. As over 1.4 trillion had been wiped out value from the market; bitcoin haven’t reached the potential bottomed yet.. 21-20K has stronger resistance zones but should expect the huge rejection; if I’m wrong then We will see double top form or if should continue the retrace to make the crash sight.
For the bottomed 14-16K is not the bottom; don’t fall for the Trap.
Because things going on the economy and Feds still working on bringing the inflation down and Fundamental Recession is coming sometime around this year. Should expect Rate cuts sometime in late 2023 or Middle 4th Quarter in 2023 so final leg down can happen.
Even if your profit still in green I highly suggest to sell it off until we hit the Top; remember the bear market isn’t over..even tho could be a long term consolidation could happen so please be very careful we still have a lot more to go. Experts sees bitcoin will bottom around 12K but mort said 11-10K zone even bigger surprises can go even lower around $5000,$5,500.
As I see still 12-10K as a bitcoin bottom.

BTC will rally to $56K in the coming 4 monthsI know this is a bold statement to make, but the bottom for BTC is in (beautiful double bottom) and a rally to $56K is imminent, bears are about to get rekt as BTC is going to rally to near its all time high price in the coming months, but it won't make a new all time high just yet, as we are in the four year cycle, this is just a retracement.
The bottom for BTC was in Nov 2022, while the bottom of the last cycle was in Dec 2018, thus this time we are one month ahead, the top of the current four month rally will be in May 2023 instead of June like the last cycle (2019).
We will break out of the bullish falling wedge to the upside very soon in the next 10 days, and we won't stop going up until the end of May, so if you are a bear and you don't want to FOMO, you will have to have patience for a very long time before the prices come down again to the current levels, in the coming months, every time you think the prices are coming down, it will go up instead and test your patience severely.
Buckle up boys and gals, we are going to the moon, soon.
Inshallah.

USDJPY H4 analysisI am not a UJ trader, someone asked for my view and I thought you would like it too.
Price didn't reached OTE on the liquidity void, and that bearish move might be just a retracement before the real rally

Buyers Retrace; bitcoin formed a new supportAfter the Feds increase interest rates and unemployment still rising even 200,000 jobs had added and still under 17K. It is bad news but had you notice the new support formed about 16.8K zone?
It is about the mega whales lures .. it’s a lot of info go and find out.
What I see now the buyers demand zone under 17K bitcoin should mid term retrace.. in order to drop more.
18K ,20K and lastly we might see 28K as the top. Becareful it’s volatile and the unexpected drop reversal will come anytime , trade safe.
If 16K is the bottom then we are bullrun to start but I don’t think so but I still see 12-10500K zone is the bottom.
Let me know your analysis and opinion down the comments, bitcoin can not drop more until the buys retrace.

EURUSD: Temporary Pause Before Headed Higher Again EURUSD has been in a nice and strong recovery from 0.9730 from where we can count five waves up, up into wave 3 from where we have seen a nice reversal south as expected. We see this as a contrat-ternd reaction on the 4h chart. It's wave 4 that is now already in a subwave c so there can be some support coming in, in the next few sessions. The first one is at 1.0440, while the deeper supports are at 1.0293. We will expect a bounce up into fifth wave this month.
GH

GMT Bullish timeHello Traders!
Welcome back to another trade with Analyst Aadil1000x.
Today we are setting a BUY limit in the key reversal area and we are aiming for at least +1.5% profit in GMT.
GMT Buy Limit @ 0.2460
Stoploss 0.2453(-1%)
Target 1, 0.2497(+1.5%)
Final Target 0.2539(+3.2%)
Don't forget to hit the like button and follow to stay connected

UJ needs to Revisit highs before more dropsWe are in a buy zone and this drop is obvious that need to short recovery buys and revisit recent highs.
From 129.560 area we should expect the short or mid buy term revisit and near supply zone. Bear market isn’t over but this is a retrace.
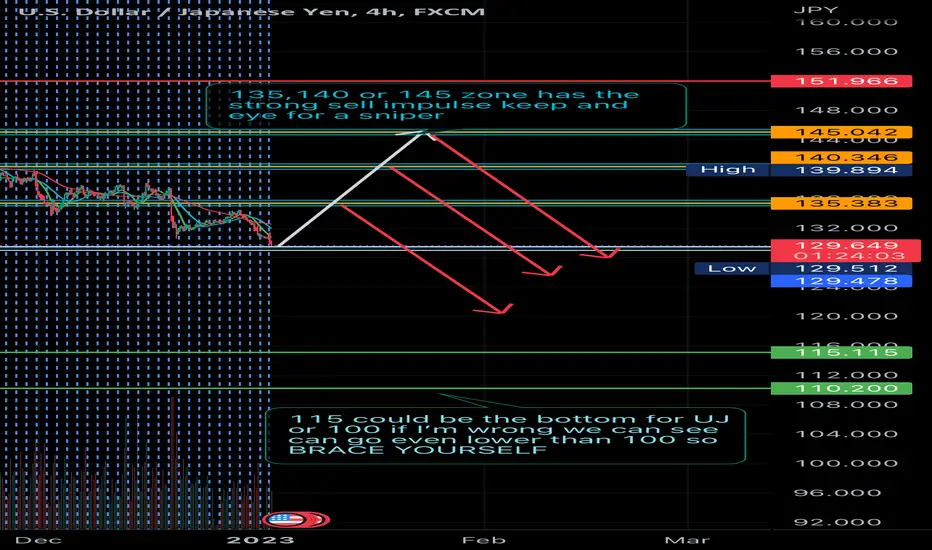
When to Sell ? Sell about around 140 or 145 area get that top dip sniper becareful and choose wisely …. Never know will spike down quickly shortage without a retrace because the bears has a lot of strength.
Trade safe y’all
EU Short Bias Jan 2023At the end of this year we saw price re-accumulate buyers on the yearly time frame. Coming into the new year I expect price to retrace into the monthly fair value gap and raid sell-side liquidity before displacing higher for the year.

US30 showing bullish momentum on 1H Chart. Taking long positionUS30 may return to test its high. Probable retracement Bullish
Double Bottom pattern also forming
Took Long swing position..

US30 BULLISH RETRACEMENT possible on 4H ChartUS30 BULLISH RETRACEMENT possible on 4H Chart
Looking for rejection and buy signal at end of retracement for Long position
Retracement may happen at 34000.00 or 34300.00 zones. Will look for rejections and buy signals in these zones.

Retracement Probability on Monthly ChartBullish Uptrend on Monthly and Weekly charts.
Good Intraday trade on Probable Bearish Reversal return to FIB levels.
Retracement on Weekly is probable.
-------------------------------------------------------------
Game Plan:
Short Intraday Trades on Weekly Retracement back to Weekly MA/EMA line 21 50.
If retracement happens then we will switch to
Bullish and look for buys back up to test Monthly High

Sell the news ? banksters overbought BTC before CME, what now ? comments under the first chart :
BTCUSD
As stated on "some grey eminences making too much money"
I d just say "some banksters got in BTC, and they overbought, too much. now they will give the option to their customers.
www.coindesk.com
Banksters are well know to bet against their customers . . . the next few days could bring surprises.
My personal chart ( uk.tradingview.com ) , with personal god mode settings, is shouting "WARNING" :
I m not telling anyone to short bitcoin, shorting bitcoin is dangerous . . . but . . . perhaps you want to reduce your exposure, have some fiat and serious altcoins ( ZEC is a good bet imo ) ready to rebuy BTC lower ( targets : 16k, 12k , 8500 here )

A lull before the potential stormThe price has finally hit the bottom, temporary as it may seem it's cause the area where the horizontal green and faded pink is where the price has hit twice before making it a solid area to bounce. However the overall trend is down especially after the symmetrical triangle got pierced and crabbed until the recent fall. Now the triangle is a descending triangle and could have a few bounces before breaking down perhaps. Temporary bounce may be in the works to halfway or if it's a strong move, to the orange line then potential retrace back to local lows. Gl and DYOR this is never financial advice, but rather, a analysis.

NZDUSD Analysis on AB=CDNZDUSD Analysis on AB=CD Pattern.
C Retrenchment at exact Fibonacci 0.618.
I am Long with RR Ratio 2.

AUDUSD SELL RETRACEMENT/PULLBACKI am expecting some bullish pressure from the USD this week.
-Therefore AUDUSD should make a bearish move
-I am looking for a final bullish push that will ultimately respect the above level of resistance
-Once price meet resistance, I am expecting a bearish move that will test the previous level of support which will test the previous high.
- I think price will test the .65 area
-Please, like or comment your idea !

GBPJPY BUYHello traders.
GBPJPY has performed a quite bullish price action. But the market makers' game is usually trapping the retailers on Mondays and reverse the trend later during week. So, I am sceptical.
The pair definitely needs corrections and that is not only an opinion of mine.
It is overbought so many big players will close their profits pretty soon. However, it remains bullish in technical analysis and GBP is bouncing from the lows while JPY keeps loosing value.
Drawing Fib levels from the Swing Low to Swing High, based of the last 4H impulse move, I consider the below Fib retracement area as a great long opportunity.
163.585 - 166.057
Note: it is at a weekly Supply level but I see the potential to break it and aim for Multiyear highs.
good luck

XAUUSD potential retracement and entrydownbeat US CPI data about inflation led a market rally which bulls are looking for clues to extend. There was a classic textbook double bottom after which the downtrend reversed into said rally. I myself caught a buy from 1712 to 1731 which was nice. I expect a retracement to 0.786 and probably price consolidation for the next day between 1 and 0.786. When the new York session opens on the 12th of November a bullish movement maybe present.
Sorry for the lack of detail today,
have been busy with uni
A more detailed idea will be published shortly,
TRADE WITH CAUTION
GOOD DAY

Is the retracement over?Hello traders,
Last week there was a deep retracement up to the 79% level on the ICT fibbs.
This week look for bullish opportunities as the market continues to rally higher.
Good luck 💥

EUR / USD Pre-NFPRisky trade before NFP but so many confluences, everything is lined up perfectly. Let's see how it plays out!
