Gold to fall back downI don't see the XAUUSD or Gold contracts rising much more.
We've retraced the 61.8% and yes, if we get a close above, we could go and test the previous swing high. But currently the price action appears to be stalling at the previous market structure.
No trade for me today but I will be looking for a continuation lower tomorrow if these current levels hold.
Retracement

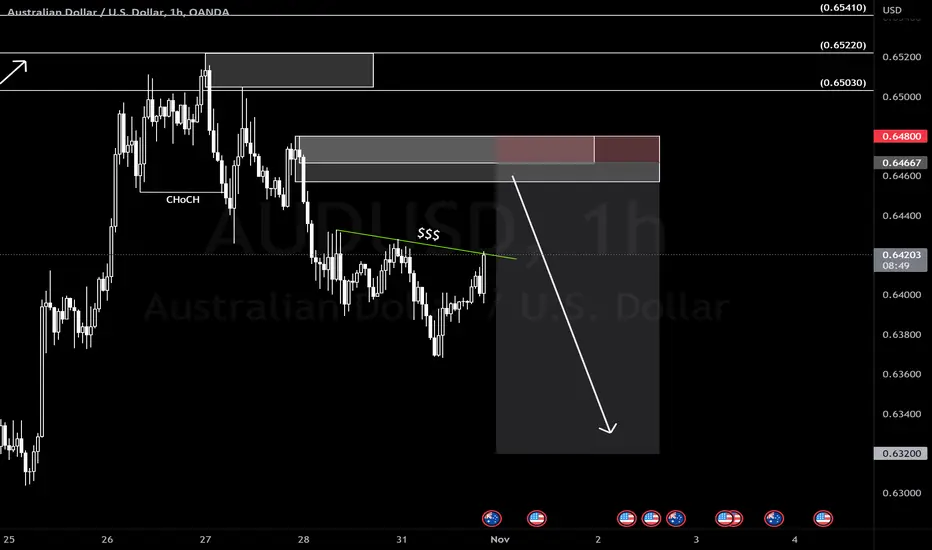
AUDUSD Sell IdeaHere are my thoughts on an AUDUSD sell trade idea. As we can see, market structure is headed down and price is in expansion from the consolidation. I think that it will take out the liquidity and hit supply sometimes around New York session that continue down with higher timeframe structure. If you are familiar with the price cycle, the zone gave us consolidation and expansion and now we wait for the retracement to supply where we will wait for a change of character the another zone on the smaller timeframe to trade from.
GBPUSD have bottomed?Has GBPUSD bottomed? Price action suggest that it has. Since GBPUSD dropped to $1.036, higher lows pattern have formed WITH contracting pattern (tightening). From that pattern I drew a trendline.
Price broke the key moving averages confluenced with the trendline break. Currently price is retracing back to its mean 50/100/200 after testing several times the $1.163 level.
Actionable plan : wait for the price to test the key moving averages (keep it simple) and identify a rejection at those level and then Long.
*Rejection could be anything. but preferably confluenced with pocket pivot (blue bar or green bar at volume indicator)

SOXL retracement tradeSOXL retracement trade to start off the week. Week will probably turn extreme bullish around tuesday / wednesday. This is a quick scalp in the first hour of monday. Playing with puts.


Bitcoin MonthlyFinally we have a nice bullish pullback.
Pullback doesn't mean bullish trend guys.
Patient is the key to be profitable.
Just follow my boxes and you'll be good.
All you need to know to trade safe and with profit.

Is $PI ready to break out of its ~10 month cup and handle?Notes:
* Strong up trend on higher time frames
* Excellent earnings track record
* Basing for the past ~10 months
* Forming a cup and handle pattern while basing
* Printed a pocket pivot signal, indicating institutional buying
* Volume on the daily and weekly time frame seems to be increasing as well
* Strong resistance around the $90 area
Technicals:
Sector: Technology - Communication Equipment
Relative Strength vs. Sector: 6.75
Relative Strength vs. SP500: 17.9
U/D Ratio: 1.09
Base Depth: 137.32%
Distance from breakout buy point: -10.12%
Volume 79.85% above its 15 day avg.
Trade Idea:
* You can enter now based on the pocket pivot signal
* Or given the market conditions you may wait for a break out of the handle as indicated or even a break above the $90 area

USDCAD FINALLY PUSHING DOWN FROM 1.38!Hey guys, hopefully some of you may have got entry's on this one, I think I've covered it at lest 10 times ahah, if your not in a position look for a retracement and the next leg.. simple market structure!!

XAUUSD Fibo retracament 38,2; 23,6; 0,523,6% we have the main resistance
38,2% we had the last support that already is the new resistance, and the 50% the support, with some shadows candles testing it.
If 0,5 is crossed this have a big probability of being the next resistance.
We believe two options of testing the support and resitance, however the 0,382 seems to be a strong resistance, tested several times, moretheless the 0,5 zone will be tested again
Also if you look at 1H tf you'll see the EMA had also crossed the bb middle line, resulting in a short position for Gold

XAUUSD (GOLD) BOUNCE ON 50 UP TO NXT LVL 1681 So this is my idea on what we are about to see happen for XAUUSD once the markets reopen. Since we can see a double bottom has recently formed I am thinking that we are in a prime position to see a 50% retracement from here before bouncing back up towards the next noticeable resistance area around 1681.
Let me know your thoughts and feedback or even just a quick "I Confirm" or "I Disagree" would also be appreciated.

BTCUSDT: Time for some retracementHello traders!
Welcome back to another episode with analyst Aadil1000x.
Yesterday there was some tricky move but the A1000x strategy was able to detect it perfectly and we moved with the market and today BTC is ready to cover yesterday's dip.
Today's move is also tricky let's see how it moves.
Don't forget to hit the like button and follow to stay connected

GBPUSD BUYHi traders.
That's my idea for GBPUSD for a short-tirm buy opportunity up to the recent highs, considering TP levels at the blue horizontal lines. The price is at strong Fib retracement level of 0.5 regarding the last big impulse move of 4H chart but it can retrace a bit more to the second path I drew. Let's see how things will occur.
Goodluck!

BTC - Almost Halfway Through The Accumulation E've been comparing recent BTC capitulation and now accumulation at the lows with the one in 2015. They are very similar in accumulation structure as well a how deep both capitulations went. Don't get me wrong, i don't thing this is a true bottom formation like it was in 2015 leading to the next bull run, but only forming a local bottom that just happens to be very similar as one in 2015. After completing this accumulation i still expect BTC will go into a retracement that can still take us slowly back in 45-50k area, before continuing the falL.
From the comparison with todays price action wth the 2015 one, we can also expect btc to still reach the top of the range, make even higher local high (green box) and still then fall down to the bottom of the range (orange box), before starting a long awaited retracement.
It all depends on a macro picture of the economy by itself. Will see what the stock market does first, but charts do show a local bottom being set for now.
DISCLAMER:
I am not a financial advisor so non of this should be taken as a financial advise. Be well.

$ENSG poised to go higher from here?Notes:
* Very strong up trend on the weekly/monthly charts
* Great earnings for the past few years
* Basing for the past 19 months
* Creating a cup and handle
* Trying to break out of the handle
* Strong resistance around the $85.4 area
Technicals:
Ticker: $ENSG
Sector: Healthcare - Medical Care Facilities
Relative Strength vs. Sector: 28.52
Relative Strength vs. SP500: 11.74
U/D Ratio: 1.15
Base Depth: 36.29%
Distance from breakout buy point: -9.18%
Volume 16.02% above its 15 day avg.
Trade idea:
* Not jumping into this just yet.
* Waiting to see if it can stay above the $85.4 area and hold it as support.

EURUSD H4 setupThe change in the market was signaled by the break in structure and now we're waiting to see if the buyers will step in again.

Long Eur/UsdEur/Usd 15m Chart
Im long Eur/Usd
We have seen CocH ,BOS on M15.
M15 Demand mitigated
M1 BOS
Countertrend trade on HTF, playing the pullback to the H1 OB above
LTF Charts below

ITC go for retracement ???as per my analysis , ITC give chance to buyer by retracment . 296 is target

EURUSD Completes The RetracementEURUSD has completed the retracement right at our entry suggesting a strong bullish move towards the monthly resistance of 1.01202.
Long orders with take profit levels as highlighted on the chart.

EURUSD IMPORTANT TO STICK TO YOUR PLAN!Still not in a short position but was expecting to see this push down. Just thought id break it down and show the next couple areas I'm interested in, long term I see the trend continuing but ill be looking for longs on the retracement just in case.. always remember to trade with a plan and stick to it!

USDCAD Short Opportunity for a Deep Retrace (50%)OPEC has recently announced deep cuts to their output quotas for oil. This has resulted in the Canadian Dollar gaining strength against many currencies as it is a major oil producing economy.
Strength of the Canadian Dollar is now evident on the USDCAD chart. I believe USDCAD will drop for a 50% retrace from it's previous impulse move.

Should expect the big dump then accumulate XRPUSD ( Ripple ) is struggling around 0.5200 area of that very strong resistance zone.
Should expect the big fall down back to the support zone area located 0.35-0.33 area.. the chart from 15min-1HR chart from a head and shoulder pattern in the symmetrical triangle, will cause a huge drop downtrend from that strong resistance zone.
It’s good benefits for the bulls but now taking a water break along the strong to rework there strength.
In order for Ripple to reach 1$ is to drop down the support zone and then skyrocket push up pass the 1$ zone.
In order the bulls to take over is to break above 0.80 area.. staying under 0.80 is still on the bearish downtrend. Trade safe and let’s watch the drop and see bulls take off from 0.35-0.33 area !!
Also the case from the court went very well and things are heating up !
Let me know the comments of your opinion and thank you also I know ripple will win over the court and will have a massive bull run.

KPITTECH is in retracement after Channel breakoutNSE:KPITTECH midcap broke out channel pattern on 2022-09-22 and is in retracement at channel resistance turned as support.
Pros:
Strong fundamentals and financials.
Consistent revenue and profit growth.
-ve net debt.
Consistent dividend yield.
Cons:
Continuous reduction in FII and DII holding.
High PE ratio.
Price above Intrinsic value.
Entry : Enter if price goes above recent high of 684 with strict SL.
Key note : Always follow proper risk management to avoid losing capital from false breakouts as this is common.
Caution : This is a knowledge sharing analysis, not a call.
Profits are not made from following ideas, but by following Risk Management .

SP500 further-gone rally not realisticI am looking forward to sell within premium zone above 0.6 retracement.
